
Poland - Prefabricated Buildings - Market Analysis, Forecast, Size, Trends and Insights
Get instant access to more than 2 million reports, dashboards, and datasets on the IndexBox Platform.
View PricingAugust 2023 Sees Poland's Export of Prefabricated Buildings Drop by 6% to $40M
Poland Prefabricated Buildings Exports
In August 2023, approximately 11K tons of prefabricated buildings were exported from Poland; picking up by 15% on the previous month. Overall, exports, however, continue to indicate a slight descent. The most prominent rate of growth was recorded in January 2023 when exports increased by 23% month-to-month.
In value terms, prefabricated buildings exports fell to $40M (IndexBox estimates) in August 2023. Over the period under review, exports recorded a relatively flat trend pattern. The pace of growth was the most pronounced in May 2023 when exports increased by 27% m-o-m.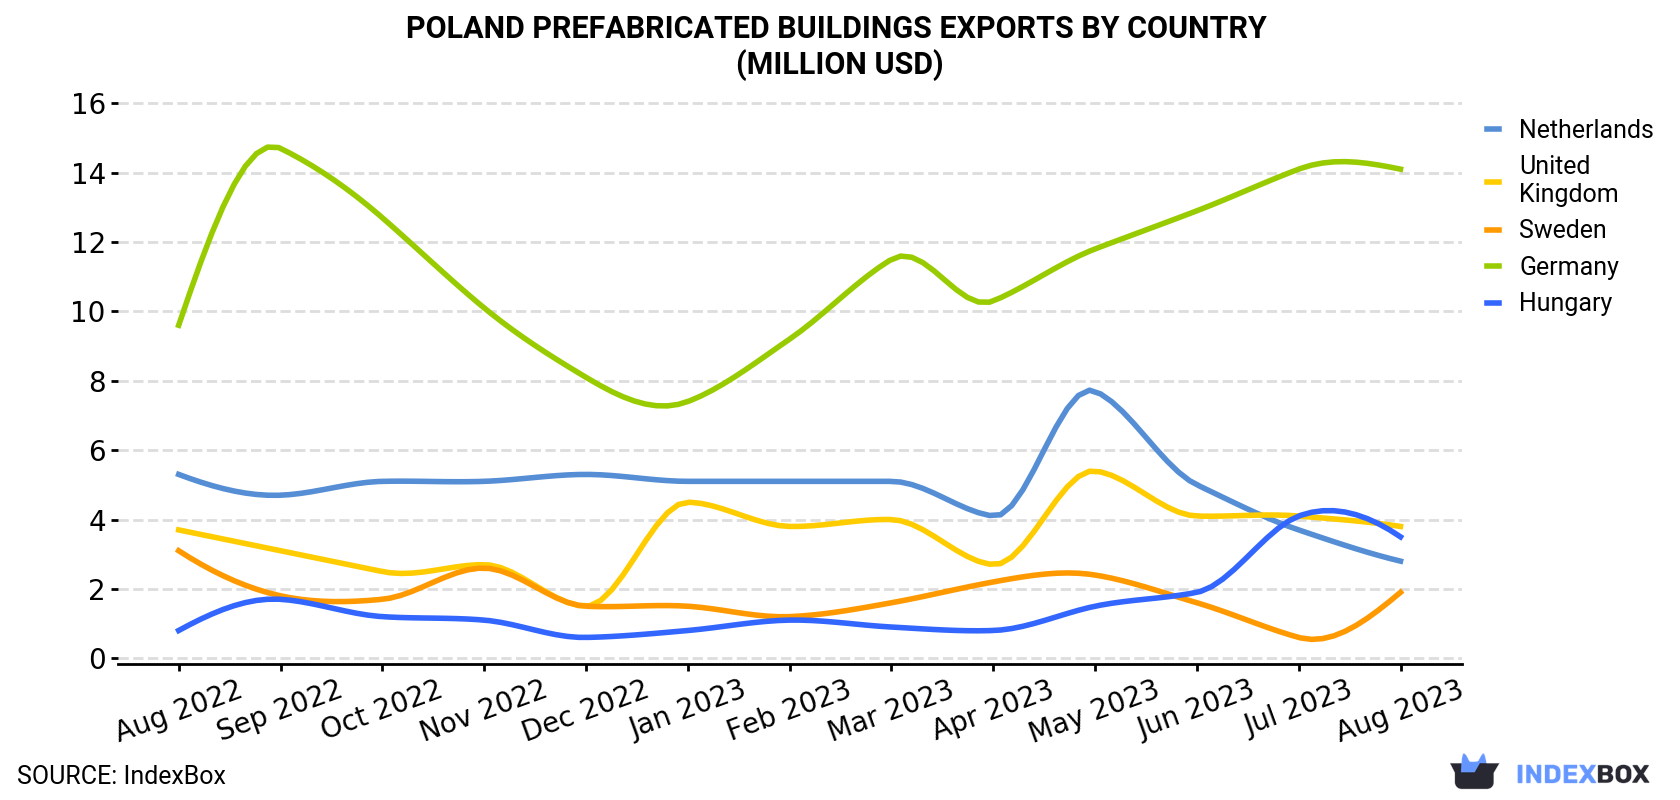
| COUNTRY | Export Value of Prefabricated Buildings in Poland (million USD) | ||||||||||||
|---|---|---|---|---|---|---|---|---|---|---|---|---|---|
| Aug 2022 | Sep 2022 | Oct 2022 | Nov 2022 | Dec 2022 | Jan 2023 | Feb 2023 | Mar 2023 | Apr 2023 | May 2023 | Jun 2023 | Jul 2023 | Aug 2023 | |
| Germany | 9.6 | 14.7 | 12.7 | 10.1 | 8.1 | 7.4 | 9.2 | 11.5 | 10.3 | 11.8 | 12.9 | 14.1 | 14.1 |
| United Kingdom | 3.7 | 3.1 | 2.5 | 2.7 | 1.5 | 4.5 | 3.8 | 4.0 | 2.7 | 5.4 | 4.1 | 4.1 | 3.8 |
| Hungary | 0.8 | 1.7 | 1.2 | 1.1 | 0.6 | 0.8 | 1.1 | 0.9 | 0.8 | 1.5 | 1.9 | 4.1 | 3.5 |
| Netherlands | 5.3 | 4.7 | 5.1 | 5.1 | 5.3 | 5.1 | 5.1 | 5.1 | 4.1 | 7.7 | 5.0 | 3.7 | 2.8 |
| Sweden | 3.1 | 1.8 | 1.7 | 2.6 | 1.5 | 1.5 | 1.2 | 1.6 | 2.2 | 2.4 | 1.6 | 0.6 | 1.9 |
| Others | 14.9 | 13.8 | 13.7 | 15.6 | 12.1 | 12.5 | 19.6 | 19.6 | 14.8 | 15.7 | 20.1 | 15.6 | 13.6 |
| Total | 37.3 | 39.8 | 36.8 | 37.1 | 29.0 | 31.7 | 39.9 | 42.7 | 35.0 | 44.5 | 45.5 | 42.2 | 39.6 |
Exports by Country
Germany (4K tons) was the main destination for prefabricated buildings exports from Poland, accounting for a 37% share of total exports. Moreover, prefabricated buildings exports to Germany exceeded the volume sent to the second major destination, Sweden (1.6K tons), twofold. The UK (971 tons) ranked third in terms of total exports with a 9.2% share.
From August 2022 to August 2023, the average monthly growth rate of volume to Germany totaled +2.0%. Exports to the other major destinations recorded the following average monthly rates of exports growth: Sweden (-3.5% per month) and the UK (+0.1% per month).
In value terms, Germany ($14M) remains the key foreign market for prefabricated buildings exports from Poland, comprising 36% of total exports. The second position in the ranking was taken by the UK ($3.8M), with a 9.5% share of total exports. It was followed by Hungary, with an 8.9% share.
From August 2022 to August 2023, the average monthly growth rate of value to Germany stood at +3.3%. Exports to the other major destinations recorded the following average monthly rates of exports growth: the UK (+0.2% per month) and Hungary (+13.2% per month).
Export Prices by Country
In August 2023, the prefabricated buildings price stood at $3,734 per ton (FOB, Poland), falling by -18.3% against the previous month. Over the last twelve months, it increased at an average monthly rate of +1.7%. The pace of growth appeared the most rapid in July 2023 when the average export price increased by 27% m-o-m. As a result, the export price attained the peak level of $4,570 per ton, and then contracted markedly in the following month.
There were significant differences in the average prices for the major external markets. In August 2023, the country with the highest price was the United States ($10,237 per ton), while the average price for exports to Sweden ($1,167 per ton) was amongst the lowest.
From August 2022 to August 2023, the most notable rate of growth in terms of prices was recorded for supplies to Hungary (+12.3%), while the prices for the other major destinations experienced more modest paces of growth.
This report provides an in-depth analysis of the prefabricated buildings market in Poland. Within it, you will discover the latest data on market trends and opportunities by country, consumption, production and price developments, as well as the global trade (imports and exports). The forecast exhibits the market prospects through 2030.
Product coverage:
- Prodcom 16232000 - Prefabricated buildings of wood
- Prodcom 25111030 - Prefabricated buildings, of iron or steel
- Prodcom 399900Z0 - Prefabricated buildings of plastics, concrete or aluminium
Country coverage:
- Poland
Data coverage:
- Market volume and value
- Per Capita consumption
- Forecast of the market dynamics in the medium term
- Trade (exports and imports) in Poland
- Export and import prices
- Market trends, drivers and restraints
- Key market players and their profiles
Reasons to buy this report:
- Take advantage of the latest data
- Find deeper insights into current market developments
- Discover vital success factors affecting the market
This report is designed for manufacturers, distributors, importers, and wholesalers, as well as for investors, consultants and advisors.
In this report, you can find information that helps you to make informed decisions on the following issues:
- How to diversify your business and benefit from new market opportunities
- How to load your idle production capacity
- How to boost your sales on overseas markets
- How to increase your profit margins
- How to make your supply chain more sustainable
- How to reduce your production and supply chain costs
- How to outsource production to other countries
- How to prepare your business for global expansion
While doing this research, we combine the accumulated expertise of our analysts and the capabilities of artificial intelligence. The AI-based platform, developed by our data scientists, constitutes the key working tool for business analysts, empowering them to discover deep insights and ideas from the marketing data.
-
1. INTRODUCTION
Making Data-Driven Decisions to Grow Your Business
- REPORT DESCRIPTION
- RESEARCH METHODOLOGY AND AI PLATFORM
- DATA-DRIVEN DECISIONS FOR YOUR BUSINESS
- GLOSSARY AND SPECIFIC TERMS
-
2. EXECUTIVE SUMMARY
A Quick Overview of Market Performance
- KEY FINDINGS
- MARKET TRENDS This Chapter is Available Only for the Professional Edition PRO
-
3. MARKET OVERVIEW
Understanding the Current State of The Market and Its Prospects
- MARKET SIZE
- MARKET STRUCTURE
- TRADE BALANCE
- PER CAPITA CONSUMPTION
- MARKET FORECAST TO 2030
-
4. MOST PROMISING PRODUCT
Finding New Products to Diversify Your Business
This Chapter is Available Only for the Professional Edition PRO- TOP PRODUCTS TO DIVERSIFY YOUR BUSINESS
- BEST-SELLING PRODUCTS
- MOST CONSUMED PRODUCT
- MOST TRADED PRODUCT
- MOST PROFITABLE PRODUCT FOR EXPORT
-
5. MOST PROMISING SUPPLYING COUNTRIES
Choosing the Best Countries to Establish Your Sustainable Supply Chain
This Chapter is Available Only for the Professional Edition PRO- TOP COUNTRIES TO SOURCE YOUR PRODUCT
- TOP PRODUCING COUNTRIES
- TOP EXPORTING COUNTRIES
- LOW-COST EXPORTING COUNTRIES
-
6. MOST PROMISING OVERSEAS MARKETS
Choosing the Best Countries to Boost Your Exports
This Chapter is Available Only for the Professional Edition PRO- TOP OVERSEAS MARKETS FOR EXPORTING YOUR PRODUCT
- TOP CONSUMING MARKETS
- UNSATURATED MARKETS
- TOP IMPORTING MARKETS
- MOST PROFITABLE MARKETS
7. PRODUCTION
The Latest Trends and Insights into The Industry
- PRODUCTION VOLUME AND VALUE
8. IMPORTS
The Largest Import Supplying Countries
- IMPORTS FROM 2012–2023
- IMPORTS BY COUNTRY
- IMPORT PRICES BY COUNTRY
9. EXPORTS
The Largest Destinations for Exports
- EXPORTS FROM 2012–2023
- EXPORTS BY COUNTRY
- EXPORT PRICES BY COUNTRY
-
10. PROFILES OF MAJOR PRODUCERS
The Largest Producers on The Market and Their Profiles
This Chapter is Available Only for the Professional Edition PRO -
LIST OF TABLES
- Key Findings In 2023
- Market Volume, In Physical Terms, 2012–2023
- Market Value, 2012–2023
- Per Capita Consumption In 2012-2023
- Imports, In Physical Terms, By Country, 2012–2023
- Imports, In Value Terms, By Country, 2012–2023
- Import Prices, By Country Of Origin, 2012–2023
- Exports, In Physical Terms, By Country, 2012–2023
- Exports, In Value Terms, By Country, 2012–2023
- Export Prices, By Country Of Destination, 2012–2023
-
LIST OF FIGURES
- Market Volume, In Physical Terms, 2012–2023
- Market Value, 2012–2023
- Market Structure – Domestic Supply vs. Imports, In Physical Terms, 2012-2023
- Market Structure – Domestic Supply vs. Imports, In Value Terms, 2012-2023
- Trade Balance, In Physical Terms, 2012-2023
- Trade Balance, In Value Terms, 2012-2023
- Per Capita Consumption, 2012-2023
- Market Volume Forecast to 2030
- Market Value Forecast to 2030
- Products: Market Size And Growth, By Type
- Products: Average Per Capita Consumption, By Type
- Products: Exports And Growth, By Type
- Products: Export Prices And Growth, By Type
- Production Volume And Growth
- Exports And Growth
- Export Prices And Growth
- Market Size And Growth
- Per Capita Consumption
- Imports And Growth
- Import Prices
- Production, In Physical Terms, 2012–2023
- Production, In Value Terms, 2012–2023
- Imports, In Physical Terms, 2012–2023
- Imports, In Value Terms, 2012–2023
- Imports, In Physical Terms, By Country, 2023
- Imports, In Physical Terms, By Country, 2012–2023
- Imports, In Value Terms, By Country, 2012–2023
- Import Prices, By Country Of Origin, 2012–2023
- Exports, In Physical Terms, 2012–2023
- Exports, In Value Terms, 2012–2023
- Exports, In Physical Terms, By Country, 2023
- Exports, In Physical Terms, By Country, 2012–2023
- Exports, In Value Terms, By Country, 2012–2023
- Export Prices, By Country Of Destination, 2012–2023


