Export of Copper Foil in July 2023 in the Netherlands Hits a Low of $8.4M
Netherlands Copper Foil Exports
After two months of growth, overseas shipments of copper foil decreased by -18.6% to 812 tons in July 2023. Over the period under review, exports saw a noticeable contraction. The most prominent rate of growth was recorded in January 2023 with an increase of 31% against the previous month.
In value terms, copper foil exports dropped significantly to $8.4M (IndexBox estimates) in July 2023. Overall, exports continue to indicate a perceptible slump. The pace of growth appeared the most rapid in November 2022 with an increase of 35% month-to-month.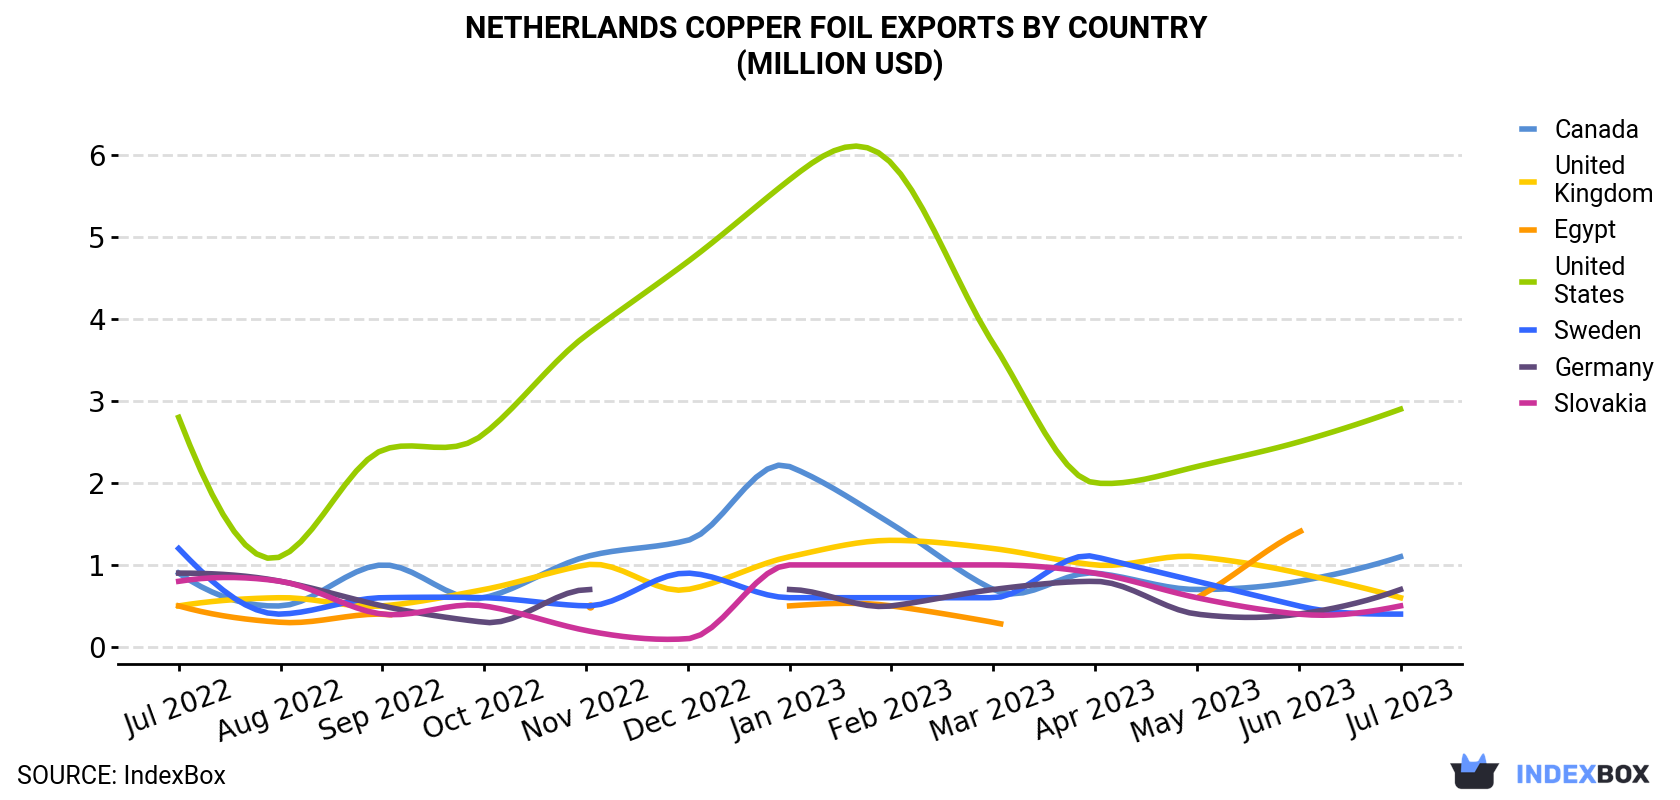
| COUNTRY | Export Value of Copper Foil in Netherlands (million USD) | ||||||||||||
|---|---|---|---|---|---|---|---|---|---|---|---|---|---|
| Jul 2022 | Aug 2022 | Sep 2022 | Oct 2022 | Nov 2022 | Dec 2022 | Jan 2023 | Feb 2023 | Mar 2023 | Apr 2023 | May 2023 | Jun 2023 | Jul 2023 | |
| United States | 2.8 | 1.1 | 2.4 | 2.6 | 3.8 | 4.7 | 5.7 | 5.9 | 3.7 | 2.0 | 2.2 | 2.5 | 2.9 |
| Canada | 0.9 | 0.5 | 1.0 | 0.6 | 1.1 | 1.3 | 2.2 | 1.5 | 0.7 | 0.9 | 0.7 | 0.8 | 1.1 |
| Germany | 0.9 | 0.8 | 0.5 | 0.3 | 0.7 | < 0.1 | 0.7 | 0.5 | 0.7 | 0.8 | 0.4 | 0.4 | 0.7 |
| United Kingdom | 0.5 | 0.6 | 0.5 | 0.7 | 1.0 | 0.7 | 1.1 | 1.3 | 1.2 | 1.0 | 1.1 | 0.9 | 0.6 |
| Slovakia | 0.8 | 0.8 | 0.4 | 0.5 | 0.2 | 0.1 | 1.0 | 1.0 | 1.0 | 0.9 | 0.6 | 0.4 | 0.5 |
| Sweden | 1.2 | 0.4 | 0.6 | 0.6 | 0.5 | 0.9 | 0.6 | 0.6 | 0.6 | 1.1 | 0.8 | 0.5 | 0.4 |
| Egypt | 0.5 | 0.3 | 0.4 | N/A | 0.5 | N/A | 0.5 | 0.5 | 0.3 | N/A | 0.6 | 1.4 | N/A |
| Others | 4.1 | 5.9 | 3.8 | 4.1 | 5.0 | 3.2 | 2.9 | 4.8 | 5.3 | 3.2 | 3.6 | 4.5 | 2.2 |
| Total | 11.8 | 10.4 | 9.6 | 9.4 | 12.7 | 11.1 | 14.7 | 16.1 | 13.5 | 9.8 | 10.1 | 11.4 | 8.4 |
Exports by Country
The United States (234 tons) was the main destination for copper foil exports from the Netherlands, with a 29% share of total exports. Moreover, copper foil exports to the United States exceeded the volume sent to the second major destination, Canada (99 tons), twofold. The third position in this ranking was taken by Germany (88 tons), with an 11% share.
From July 2022 to July 2023, the average monthly rate of growth in terms of volume to the United States totaled -1.7%. Exports to the other major destinations recorded the following average monthly rates of exports growth: Canada (-0.6% per month) and Germany (-2.7% per month).
In value terms, the United States ($2.9M) remains the key foreign market for copper foil exports from the Netherlands, comprising 35% of total exports. The second position in the ranking was held by Canada ($1.1M), with a 13% share of total exports. It was followed by Germany, with a 7.9% share.
From July 2022 to July 2023, the average monthly growth rate of value to the United States was relatively modest. Exports to the other major destinations recorded the following average monthly rates of exports growth: Canada (+1.5% per month) and Germany (-2.2% per month).
Export Prices by Country
In July 2023, the copper foil price stood at $10,290 per ton (FOB, Netherlands), declining by -10.3% against the previous month. Overall, the export price, however, showed a relatively flat trend pattern. The most prominent rate of growth was recorded in November 2022 when the average export price increased by 9.7% month-to-month. Over the period under review, the average export prices reached the peak figure at $11,920 per ton in May 2023; however, from June 2023 to July 2023, the export prices failed to regain momentum.
Prices varied noticeably by the country of destination: the country with the highest price was Sweden ($12,670 per ton), while the average price for exports to Malaysia ($1,820 per ton) was amongst the lowest.
From July 2022 to July 2023, the most notable rate of growth in terms of prices was recorded for supplies to China (+2.5%), while the prices for the other major destinations experienced more modest paces of growth.
-
1. INTRODUCTION
Making Data-Driven Decisions to Grow Your Business
- REPORT DESCRIPTION
- RESEARCH METHODOLOGY AND AI PLATFORM
- DATA-DRIVEN DECISIONS FOR YOUR BUSINESS
- GLOSSARY AND SPECIFIC TERMS
-
2. EXECUTIVE SUMMARY
A Quick Overview of Market Performance
- KEY FINDINGS
- MARKET TRENDS This Chapter is Available Only for the Professional Edition PRO
-
3. MARKET OVERVIEW
Understanding the Current State of The Market and Its Prospects
- MARKET SIZE
- MARKET STRUCTURE
- TRADE BALANCE
- PER CAPITA CONSUMPTION
- MARKET FORECAST TO 2030
-
4. MOST PROMISING PRODUCT
Finding New Products to Diversify Your Business
This Chapter is Available Only for the Professional Edition PRO- TOP PRODUCTS TO DIVERSIFY YOUR BUSINESS
- BEST-SELLING PRODUCTS
- MOST CONSUMED PRODUCT
- MOST TRADED PRODUCT
- MOST PROFITABLE PRODUCT FOR EXPORT
-
5. MOST PROMISING SUPPLYING COUNTRIES
Choosing the Best Countries to Establish Your Sustainable Supply Chain
This Chapter is Available Only for the Professional Edition PRO- TOP COUNTRIES TO SOURCE YOUR PRODUCT
- TOP PRODUCING COUNTRIES
- TOP EXPORTING COUNTRIES
- LOW-COST EXPORTING COUNTRIES
-
6. MOST PROMISING OVERSEAS MARKETS
Choosing the Best Countries to Boost Your Exports
This Chapter is Available Only for the Professional Edition PRO- TOP OVERSEAS MARKETS FOR EXPORTING YOUR PRODUCT
- TOP CONSUMING MARKETS
- UNSATURATED MARKETS
- TOP IMPORTING MARKETS
- MOST PROFITABLE MARKETS
7. PRODUCTION
The Latest Trends and Insights into The Industry
- PRODUCTION VOLUME AND VALUE
8. IMPORTS
The Largest Import Supplying Countries
- IMPORTS FROM 2012–2023
- IMPORTS BY COUNTRY
- IMPORT PRICES BY COUNTRY
9. EXPORTS
The Largest Destinations for Exports
- EXPORTS FROM 2012–2023
- EXPORTS BY COUNTRY
- EXPORT PRICES BY COUNTRY
-
10. PROFILES OF MAJOR PRODUCERS
The Largest Producers on The Market and Their Profiles
This Chapter is Available Only for the Professional Edition PRO -
LIST OF TABLES
- Key Findings In 2023
- Market Volume, In Physical Terms, 2012–2023
- Market Value, 2012–2023
- Per Capita Consumption In 2012-2023
- Imports, In Physical Terms, By Country, 2012–2023
- Imports, In Value Terms, By Country, 2012–2023
- Import Prices, By Country Of Origin, 2012–2023
- Exports, In Physical Terms, By Country, 2012–2023
- Exports, In Value Terms, By Country, 2012–2023
- Export Prices, By Country Of Destination, 2012–2023
-
LIST OF FIGURES
- Market Volume, In Physical Terms, 2012–2023
- Market Value, 2012–2023
- Market Structure – Domestic Supply vs. Imports, In Physical Terms, 2012-2023
- Market Structure – Domestic Supply vs. Imports, In Value Terms, 2012-2023
- Trade Balance, In Physical Terms, 2012-2023
- Trade Balance, In Value Terms, 2012-2023
- Per Capita Consumption, 2012-2023
- Market Volume Forecast to 2030
- Market Value Forecast to 2030
- Products: Market Size And Growth, By Type
- Products: Average Per Capita Consumption, By Type
- Products: Exports And Growth, By Type
- Products: Export Prices And Growth, By Type
- Production Volume And Growth
- Exports And Growth
- Export Prices And Growth
- Market Size And Growth
- Per Capita Consumption
- Imports And Growth
- Import Prices
- Production, In Physical Terms, 2012–2023
- Production, In Value Terms, 2012–2023
- Imports, In Physical Terms, 2012–2023
- Imports, In Value Terms, 2012–2023
- Imports, In Physical Terms, By Country, 2023
- Imports, In Physical Terms, By Country, 2012–2023
- Imports, In Value Terms, By Country, 2012–2023
- Import Prices, By Country Of Origin, 2012–2023
- Exports, In Physical Terms, 2012–2023
- Exports, In Value Terms, 2012–2023
- Exports, In Physical Terms, By Country, 2023
- Exports, In Physical Terms, By Country, 2012–2023
- Exports, In Value Terms, By Country, 2012–2023
- Export Prices, By Country Of Destination, 2012–2023


