Significant Increase in Accumulator Imports Reaches $417M in September 2023 in the Netherlands
Netherlands Accumulator Imports
In September 2023, supplies from abroad of electric accumulators increased by 11% to 10M units, rising for the second month in a row after five months of decline. Overall, imports, however, recorded a relatively flat trend pattern. The pace of growth appeared the most rapid in October 2022 with an increase of 26% m-o-m. Imports peaked at 16M units in February 2023; however, from March 2023 to September 2023, imports remained at a lower figure.
In value terms, accumulator imports expanded rapidly to $417M (IndexBox estimates) in September 2023. In general, imports, however, saw a pronounced contraction. The pace of growth appeared the most rapid in November 2022 with an increase of 24% against the previous month. As a result, imports reached the peak of $640M. From December 2022 to September 2023, the growth of imports failed to regain momentum.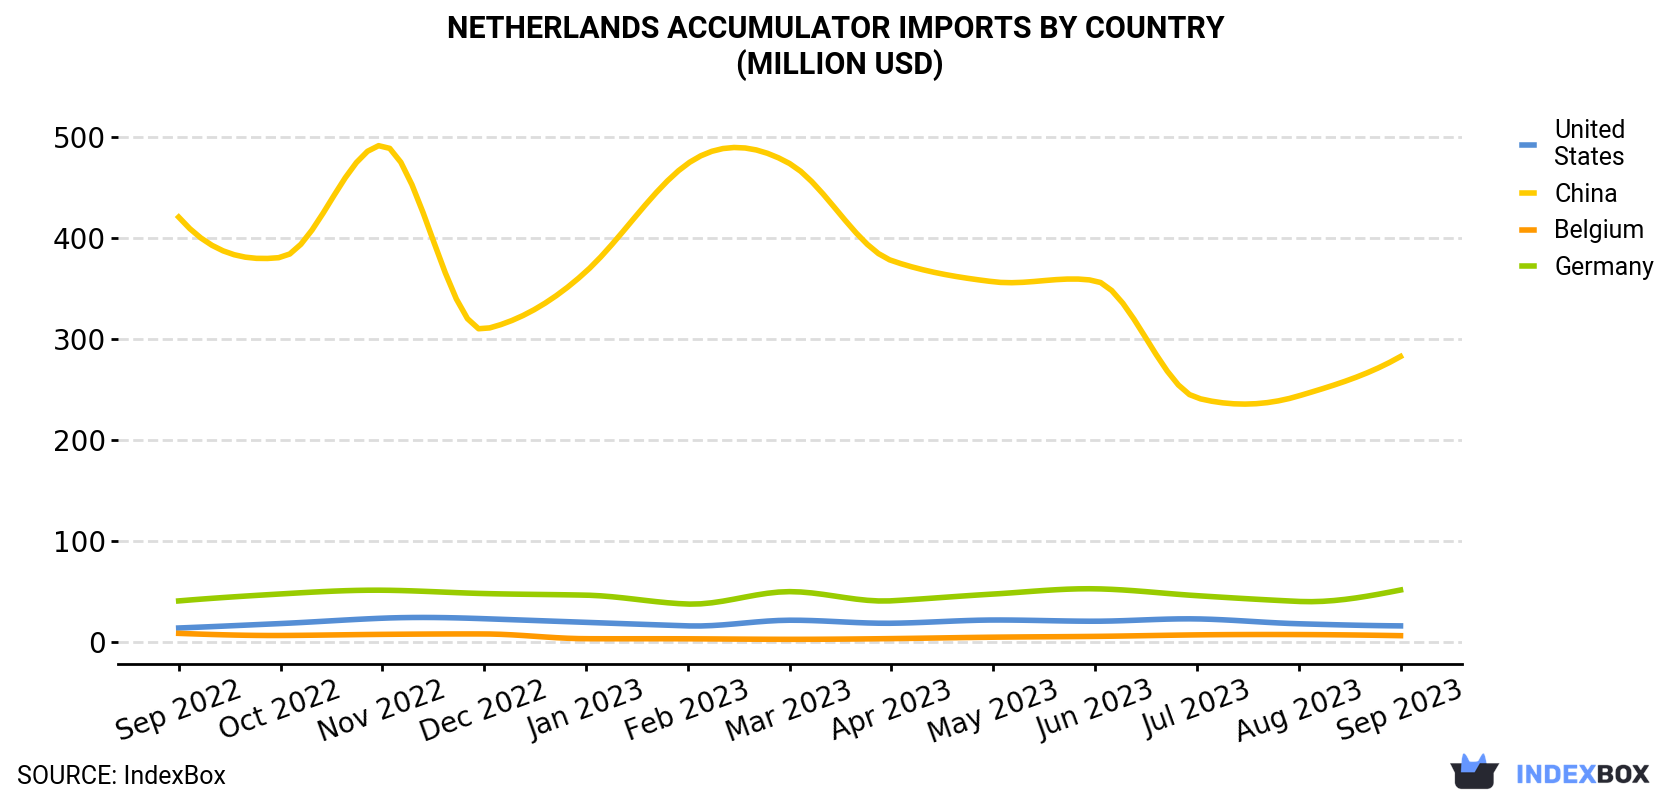
| COUNTRY | Import Value of Accumulator in Netherlands (million USD) | ||||||||||||
|---|---|---|---|---|---|---|---|---|---|---|---|---|---|
| Sep 2022 | Oct 2022 | Nov 2022 | Dec 2022 | Jan 2023 | Feb 2023 | Mar 2023 | Apr 2023 | May 2023 | Jun 2023 | Jul 2023 | Aug 2023 | Sep 2023 | |
| China | 421 | 381 | 492 | 310 | 367 | 474 | 474 | 378 | 357 | 358 | 242 | 244 | 283 |
| Germany | 41.1 | 48.0 | 51.7 | 48.4 | 46.8 | 38.0 | 50.3 | 41.2 | 47.9 | 53.1 | 46.3 | 40.6 | 51.9 |
| United States | 14.3 | 18.7 | 24.0 | 23.5 | 19.9 | 16.4 | 22.0 | 19.0 | 22.2 | 21.0 | 23.3 | 18.5 | 16.4 |
| Belgium | 9.0 | 6.9 | 8.0 | 8.4 | 3.7 | 3.6 | 3.1 | 3.8 | 5.2 | 6.0 | 7.5 | 7.8 | 6.7 |
| Others | 62.7 | 63.0 | 64.3 | 60.2 | 63.4 | 58.8 | 70.5 | 55.1 | 55.5 | 64.5 | 61.0 | 59.0 | 58.8 |
| Total | 548 | 517 | 640 | 450 | 501 | 591 | 620 | 497 | 488 | 503 | 380 | 370 | 417 |
Imports by Country
In September 2023, China (8.4M units) constituted the largest accumulator supplier to the Netherlands, with a 81% share of total imports. Moreover, accumulator imports from China exceeded the figures recorded by the second-largest supplier, Germany (488K units), more than tenfold. The United States (361K units) ranked third in terms of total imports with a 3.5% share.
From September 2022 to September 2023, the average monthly growth rate of volume from China was relatively modest. The remaining supplying countries recorded the following average monthly rates of imports growth: Germany (+0.8% per month) and the United States (+0.9% per month).
In value terms, China ($283M) constituted the largest supplier of accumulator to the Netherlands, comprising 68% of total imports. The second position in the ranking was taken by Germany ($52M), with a 12% share of total imports. It was followed by the United States, with a 3.9% share.
From September 2022 to September 2023, the average monthly rate of growth in terms of value from China totaled -3.2%. The remaining supplying countries recorded the following average monthly rates of imports growth: Germany (+2.0% per month) and the United States (+1.1% per month).
Imports by Type
In September 2023, nickel-cadmium, nickel metal hydride, lithium-ion, lithium polymer and nickel-iron accumulators (9.7M units) was the main type of accumulator supplied to the Netherlands, accounting for a 94% share of total imports. Moreover, nickel-cadmium, nickel metal hydride, lithium-ion, lithium polymer and nickel-iron accumulators exceeded the figures recorded for the second-largest type, lead-acid accumulators for starting piston engines (338K units), more than tenfold.
From September 2022 to September 2023, the average monthly rate of growth in terms of the volume of import of nickel-cadmium, nickel metal hydride, lithium-ion, lithium polymer and nickel-iron accumulators was relatively modest. With regard to the other supplied products, the following average monthly rates of growth were recorded: lead-acid accumulators for starting piston engines (-8.0% per month) and lead-acid accumulators (excluding starter batteries) (-2.3% per month).
In value terms, nickel-cadmium, nickel metal hydride, lithium-ion, lithium polymer and nickel-iron accumulators ($360M) constituted the largest type of accumulator supplied to the Netherlands, comprising 86% of total imports. The second position in the ranking was held by lead-acid accumulators (excluding starter batteries) ($33M), with a 7.8% share of total imports.
Import Prices by Country
In September 2023, the accumulator price amounted to $40.4 per unit (CIF, Netherlands), rising by 2% against the previous month. Over the period under review, the import price, however, recorded a mild descent. The most prominent rate of growth was recorded in March 2023 an increase of 26% against the previous month. The import price peaked at $48.7 per unit in September 2022; however, from October 2022 to September 2023, import prices failed to regain momentum.
There were significant differences in the average prices amongst the major supplying countries. In September 2023, the country with the highest price was Germany ($106 per unit), while the price for China ($33.7 per unit) was amongst the lowest.
From September 2022 to September 2023, the most notable rate of growth in terms of prices was attained by Belgium (+13.8%), while the prices for the other major suppliers experienced more modest paces of growth.
-
1. INTRODUCTION
Making Data-Driven Decisions to Grow Your Business
- REPORT DESCRIPTION
- RESEARCH METHODOLOGY AND AI PLATFORM
- DATA-DRIVEN DECISIONS FOR YOUR BUSINESS
- GLOSSARY AND SPECIFIC TERMS
-
2. EXECUTIVE SUMMARY
A Quick Overview of Market Performance
- KEY FINDINGS
- MARKET TRENDS This Chapter is Available Only for the Professional Edition PRO
-
3. MARKET OVERVIEW
Understanding the Current State of The Market and Its Prospects
- MARKET SIZE
- MARKET STRUCTURE
- TRADE BALANCE
- PER CAPITA CONSUMPTION
- MARKET FORECAST TO 2030
-
4. MOST PROMISING PRODUCT
Finding New Products to Diversify Your Business
This Chapter is Available Only for the Professional Edition PRO- TOP PRODUCTS TO DIVERSIFY YOUR BUSINESS
- BEST-SELLING PRODUCTS
- MOST CONSUMED PRODUCT
- MOST TRADED PRODUCT
- MOST PROFITABLE PRODUCT FOR EXPORT
-
5. MOST PROMISING SUPPLYING COUNTRIES
Choosing the Best Countries to Establish Your Sustainable Supply Chain
This Chapter is Available Only for the Professional Edition PRO- TOP COUNTRIES TO SOURCE YOUR PRODUCT
- TOP PRODUCING COUNTRIES
- TOP EXPORTING COUNTRIES
- LOW-COST EXPORTING COUNTRIES
-
6. MOST PROMISING OVERSEAS MARKETS
Choosing the Best Countries to Boost Your Exports
This Chapter is Available Only for the Professional Edition PRO- TOP OVERSEAS MARKETS FOR EXPORTING YOUR PRODUCT
- TOP CONSUMING MARKETS
- UNSATURATED MARKETS
- TOP IMPORTING MARKETS
- MOST PROFITABLE MARKETS
7. PRODUCTION
The Latest Trends and Insights into The Industry
- PRODUCTION VOLUME AND VALUE
8. IMPORTS
The Largest Import Supplying Countries
- IMPORTS FROM 2012–2023
- IMPORTS BY COUNTRY
- IMPORT PRICES BY COUNTRY
9. EXPORTS
The Largest Destinations for Exports
- EXPORTS FROM 2012–2023
- EXPORTS BY COUNTRY
- EXPORT PRICES BY COUNTRY
-
10. PROFILES OF MAJOR PRODUCERS
The Largest Producers on The Market and Their Profiles
This Chapter is Available Only for the Professional Edition PRO -
LIST OF TABLES
- Key Findings In 2023
- Market Volume, In Physical Terms, 2012–2023
- Market Value, 2012–2023
- Per Capita Consumption In 2012-2023
- Imports, In Physical Terms, By Country, 2012–2023
- Imports, In Value Terms, By Country, 2012–2023
- Import Prices, By Country Of Origin, 2012–2023
- Exports, In Physical Terms, By Country, 2012–2023
- Exports, In Value Terms, By Country, 2012–2023
- Export Prices, By Country Of Destination, 2012–2023
-
LIST OF FIGURES
- Market Volume, In Physical Terms, 2012–2023
- Market Value, 2012–2023
- Market Structure – Domestic Supply vs. Imports, In Physical Terms, 2012-2023
- Market Structure – Domestic Supply vs. Imports, In Value Terms, 2012-2023
- Trade Balance, In Physical Terms, 2012-2023
- Trade Balance, In Value Terms, 2012-2023
- Per Capita Consumption, 2012-2023
- Market Volume Forecast to 2030
- Market Value Forecast to 2030
- Products: Market Size And Growth, By Type
- Products: Average Per Capita Consumption, By Type
- Products: Exports And Growth, By Type
- Products: Export Prices And Growth, By Type
- Production Volume And Growth
- Exports And Growth
- Export Prices And Growth
- Market Size And Growth
- Per Capita Consumption
- Imports And Growth
- Import Prices
- Production, In Physical Terms, 2012–2023
- Production, In Value Terms, 2012–2023
- Imports, In Physical Terms, 2012–2023
- Imports, In Value Terms, 2012–2023
- Imports, In Physical Terms, By Country, 2023
- Imports, In Physical Terms, By Country, 2012–2023
- Imports, In Value Terms, By Country, 2012–2023
- Import Prices, By Country Of Origin, 2012–2023
- Exports, In Physical Terms, 2012–2023
- Exports, In Value Terms, 2012–2023
- Exports, In Physical Terms, By Country, 2023
- Exports, In Physical Terms, By Country, 2012–2023
- Exports, In Value Terms, By Country, 2012–2023
- Export Prices, By Country Of Destination, 2012–2023


