Mexico - Soft Drinks - Market Analysis, Forecast, Size, Trends and Insights
Get instant access to more than 2 million reports, dashboards, and datasets on the IndexBox Platform.
View PricingMexico's Soft Drink Exports Skyrocket to $54M in October 2023
Mexico Soft Drink Exports
In October 2023, shipments abroad of soft drinks increased by 11% to 49M litres for the first time since July 2023, thus ending a two-month declining trend. Over the period under review, exports, however, saw a abrupt slump. The most prominent rate of growth was recorded in July 2023 with an increase of 43% m-o-m. Over the period under review, the exports hit record highs at 92M litres in October 2022; however, from November 2022 to October 2023, the exports stood at a somewhat lower figure.
In value terms, soft drink exports soared to $54M (IndexBox estimates) in October 2023. Overall, exports, however, recorded a noticeable descent. The most prominent rate of growth was recorded in July 2023 with an increase of 47% m-o-m. Over the period under review, the exports hit record highs at 87M litres in October 2022; however, from November 2022 to October 2023, the exports failed to regain momentum.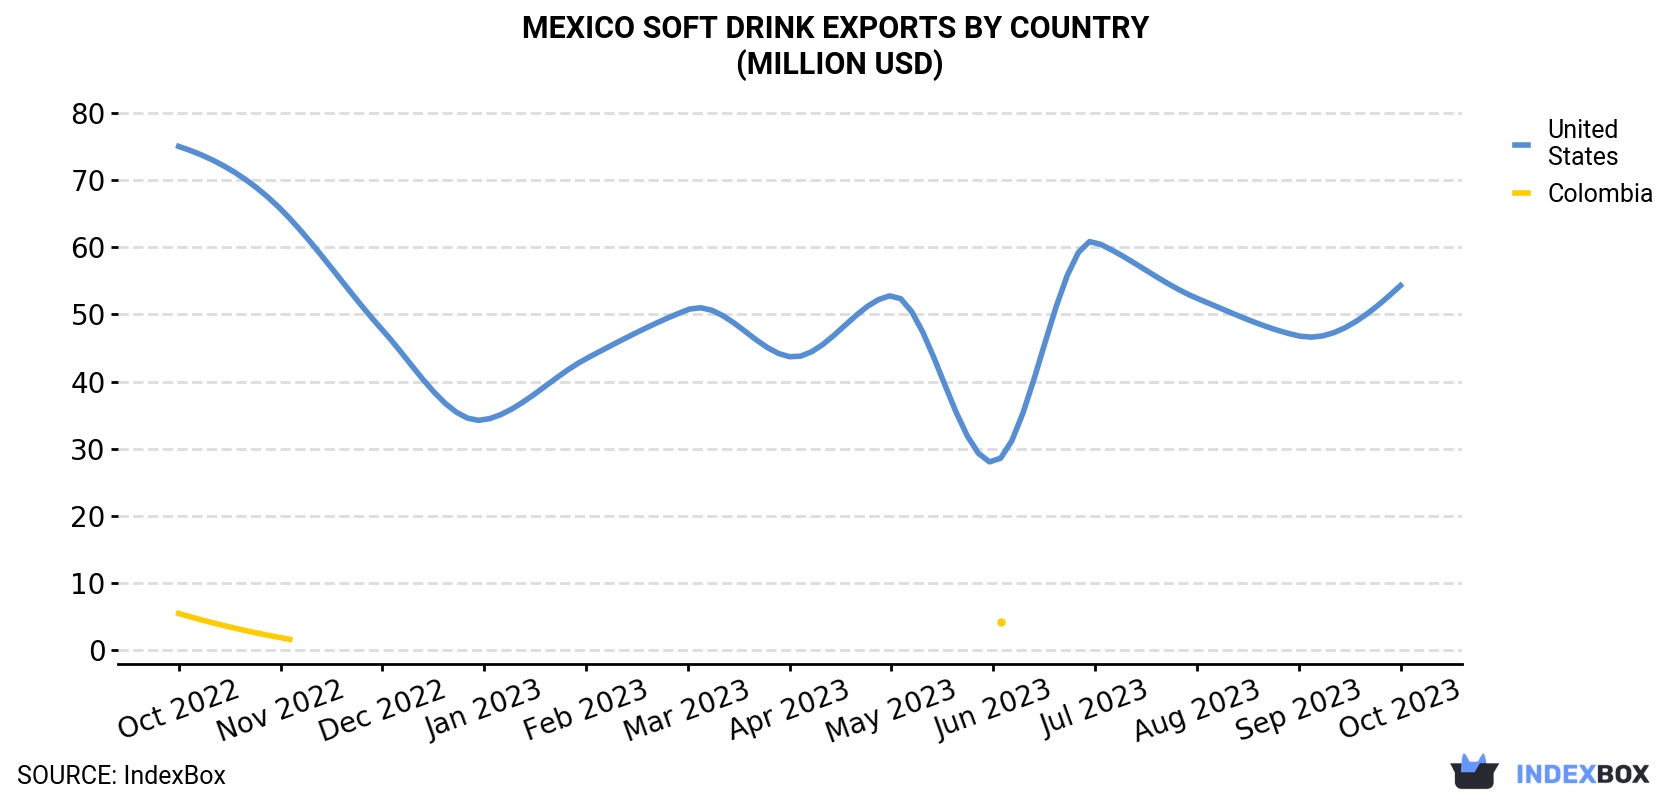
| COUNTRY | Export Value of Soft Drink in Mexico (million USD) | ||||||||||||
|---|---|---|---|---|---|---|---|---|---|---|---|---|---|
| Oct 2022 | Nov 2022 | Dec 2022 | Jan 2023 | Feb 2023 | Mar 2023 | Apr 2023 | May 2023 | Jun 2023 | Jul 2023 | Aug 2023 | Sep 2023 | Oct 2023 | |
| United States | 75.0 | 65.7 | 47.7 | 34.3 | 43.4 | 50.7 | 43.7 | 52.8 | 28.0 | 60.8 | 52.4 | 46.8 | 54.3 |
| Colombia | 5.5 | 1.9 | N/A | N/A | N/A | N/A | N/A | N/A | 4.3 | N/A | N/A | N/A | N/A |
| Others | 6.4 | 7.3 | N/A | N/A | N/A | < 0.1 | N/A | N/A | 9.0 | N/A | N/A | N/A | < 0.1 |
| Total | 86.9 | 74.9 | 47.7 | 34.3 | 43.4 | 50.7 | 43.7 | 52.8 | 41.4 | 60.8 | 52.4 | 46.8 | 54.3 |
Exports by Country
The United States (49M litres) was the main destination for soft drink exports from Mexico, accounting for a approximately 99.9% share of total exports.
From October 2022 to October 2023, the average monthly rate of growth in terms of volume to the United States stood at -4.0%.
In value terms, the United States ($54M) also remains the key foreign market for soft drink exports from Mexico.
From October 2022 to October 2023, the average monthly rate of growth in terms of value to the United States totaled -2.7%.
Exports by Type
Sugary soft drinks (49M litres) was the largest type of soft drink exported from Mexico, accounting for a approximately 100% share of total exports.
From October 2022 to October 2023, the average monthly growth rate of the volume of export of sugary soft drinks stood at -1.1%.
In value terms, sugary soft drinks ($54M) also remains the largest type of soft drink exported from Mexico.
From October 2022 to October 2023, the average monthly rate of growth in terms of the export volume of sugary soft drinks was relatively modest.
Export Prices by Country
In October 2023, the soft drink price stood at $1.1 per litre (FOB, Mexico), with an increase of 4.2% against the previous month. Over the last twelve-month period, it increased at an average monthly rate of +1.4%. The pace of growth appeared the most rapid in January 2023 when the average export price increased by 14% against the previous month. Over the period under review, the average export prices reached the maximum in October 2023.
As there is only one major export destination, the average price level is determined by prices for the United States.
From October 2022 to October 2023, the rate of growth in terms of prices for Colombia amounted to +2.2% per month.
This report provides an in-depth analysis of the soft drink market in Mexico. Within it, you will discover the latest data on market trends and opportunities by country, consumption, production and price developments, as well as the global trade (imports and exports). The forecast exhibits the market prospects through 2030.
Product coverage:
- Prodcom 11071930 - Waters, with added sugar, other sweetening matter or flavoured, i.e. soft drinks (including mineral and aerated)
- Prodcom 11071950 - z Non-alcoholic beverages not containing milk fat (excluding sweetened or unsweetened mineral, aerated or flavoured waters)
- Prodcom 11071970 - Non-alcoholic beverages containing milk fat
- Prodcom 110000Z1 - Non-alcoholic beverages, not containing milk, milk products and fats derived therefrom (excl. water, fruit or vegetable juices)
- Prodcom 11051010 - Non-alcoholic beer and beer containing . 0.5% alcohol
Country coverage:
- Mexico
Data coverage:
- Market volume and value
- Per Capita consumption
- Forecast of the market dynamics in the medium term
- Trade (exports and imports) in Mexico
- Export and import prices
- Market trends, drivers and restraints
- Key market players and their profiles
Reasons to buy this report:
- Take advantage of the latest data
- Find deeper insights into current market developments
- Discover vital success factors affecting the market
This report is designed for manufacturers, distributors, importers, and wholesalers, as well as for investors, consultants and advisors.
In this report, you can find information that helps you to make informed decisions on the following issues:
- How to diversify your business and benefit from new market opportunities
- How to load your idle production capacity
- How to boost your sales on overseas markets
- How to increase your profit margins
- How to make your supply chain more sustainable
- How to reduce your production and supply chain costs
- How to outsource production to other countries
- How to prepare your business for global expansion
While doing this research, we combine the accumulated expertise of our analysts and the capabilities of artificial intelligence. The AI-based platform, developed by our data scientists, constitutes the key working tool for business analysts, empowering them to discover deep insights and ideas from the marketing data.
-
1. INTRODUCTION
Making Data-Driven Decisions to Grow Your Business
- REPORT DESCRIPTION
- RESEARCH METHODOLOGY AND AI PLATFORM
- DATA-DRIVEN DECISIONS FOR YOUR BUSINESS
- GLOSSARY AND SPECIFIC TERMS
-
2. EXECUTIVE SUMMARY
A Quick Overview of Market Performance
- KEY FINDINGS
- MARKET TRENDS This Chapter is Available Only for the Professional Edition PRO
-
3. MARKET OVERVIEW
Understanding the Current State of The Market and Its Prospects
- MARKET SIZE
- MARKET STRUCTURE
- TRADE BALANCE
- PER CAPITA CONSUMPTION
- MARKET FORECAST TO 2030
-
4. MOST PROMISING PRODUCT
Finding New Products to Diversify Your Business
This Chapter is Available Only for the Professional Edition PRO- TOP PRODUCTS TO DIVERSIFY YOUR BUSINESS
- BEST-SELLING PRODUCTS
- MOST CONSUMED PRODUCT
- MOST TRADED PRODUCT
- MOST PROFITABLE PRODUCT FOR EXPORT
-
5. MOST PROMISING SUPPLYING COUNTRIES
Choosing the Best Countries to Establish Your Sustainable Supply Chain
This Chapter is Available Only for the Professional Edition PRO- TOP COUNTRIES TO SOURCE YOUR PRODUCT
- TOP PRODUCING COUNTRIES
- TOP EXPORTING COUNTRIES
- LOW-COST EXPORTING COUNTRIES
-
6. MOST PROMISING OVERSEAS MARKETS
Choosing the Best Countries to Boost Your Exports
This Chapter is Available Only for the Professional Edition PRO- TOP OVERSEAS MARKETS FOR EXPORTING YOUR PRODUCT
- TOP CONSUMING MARKETS
- UNSATURATED MARKETS
- TOP IMPORTING MARKETS
- MOST PROFITABLE MARKETS
7. PRODUCTION
The Latest Trends and Insights into The Industry
- PRODUCTION VOLUME AND VALUE
8. IMPORTS
The Largest Import Supplying Countries
- IMPORTS FROM 2012–2023
- IMPORTS BY COUNTRY
- IMPORT PRICES BY COUNTRY
9. EXPORTS
The Largest Destinations for Exports
- EXPORTS FROM 2012–2023
- EXPORTS BY COUNTRY
- EXPORT PRICES BY COUNTRY
-
10. PROFILES OF MAJOR PRODUCERS
The Largest Producers on The Market and Their Profiles
This Chapter is Available Only for the Professional Edition PRO -
LIST OF TABLES
- Key Findings In 2023
- Market Volume, In Physical Terms, 2012–2023
- Market Value, 2012–2023
- Per Capita Consumption In 2012-2023
- Imports, In Physical Terms, By Country, 2012–2023
- Imports, In Value Terms, By Country, 2012–2023
- Import Prices, By Country Of Origin, 2012–2023
- Exports, In Physical Terms, By Country, 2012–2023
- Exports, In Value Terms, By Country, 2012–2023
- Export Prices, By Country Of Destination, 2012–2023
-
LIST OF FIGURES
- Market Volume, In Physical Terms, 2012–2023
- Market Value, 2012–2023
- Market Structure – Domestic Supply vs. Imports, In Physical Terms, 2012-2023
- Market Structure – Domestic Supply vs. Imports, In Value Terms, 2012-2023
- Trade Balance, In Physical Terms, 2012-2023
- Trade Balance, In Value Terms, 2012-2023
- Per Capita Consumption, 2012-2023
- Market Volume Forecast to 2030
- Market Value Forecast to 2030
- Products: Market Size And Growth, By Type
- Products: Average Per Capita Consumption, By Type
- Products: Exports And Growth, By Type
- Products: Export Prices And Growth, By Type
- Production Volume And Growth
- Exports And Growth
- Export Prices And Growth
- Market Size And Growth
- Per Capita Consumption
- Imports And Growth
- Import Prices
- Production, In Physical Terms, 2012–2023
- Production, In Value Terms, 2012–2023
- Imports, In Physical Terms, 2012–2023
- Imports, In Value Terms, 2012–2023
- Imports, In Physical Terms, By Country, 2023
- Imports, In Physical Terms, By Country, 2012–2023
- Imports, In Value Terms, By Country, 2012–2023
- Import Prices, By Country Of Origin, 2012–2023
- Exports, In Physical Terms, 2012–2023
- Exports, In Value Terms, 2012–2023
- Exports, In Physical Terms, By Country, 2023
- Exports, In Physical Terms, By Country, 2012–2023
- Exports, In Value Terms, By Country, 2012–2023
- Export Prices, By Country Of Destination, 2012–2023


