
Mexico - Electric Filament Lamps - Market Analysis, Forecast, Size, Trends and Insights
Get instant access to more than 2 million reports, dashboards, and datasets on the IndexBox Platform.
View PricingPrice of Mexican Electric Filament Lamps Plummet to $20.6 per Thousand Units
Mexico Electric Filament Lamp Import Price in June 2023
In June 2023, the electric filament lamp price amounted to $20.6 per thousand units (CIF, Mexico), with a decrease of -41.4% against the previous month. Over the period under review, the import price recorded a relatively flat trend pattern. The most prominent rate of growth was recorded in August 2022 when the average import price increased by 981% m-o-m. As a result, import price attained the peak level of $224 per thousand units. From September 2022 to June 2023, the average import prices remained at a lower figure.
As there is only one major supplying country, the average price level is determined by prices for China.
From June 2022 to June 2023, the rate of growth in terms of prices for China amounted to 0.0% per month.
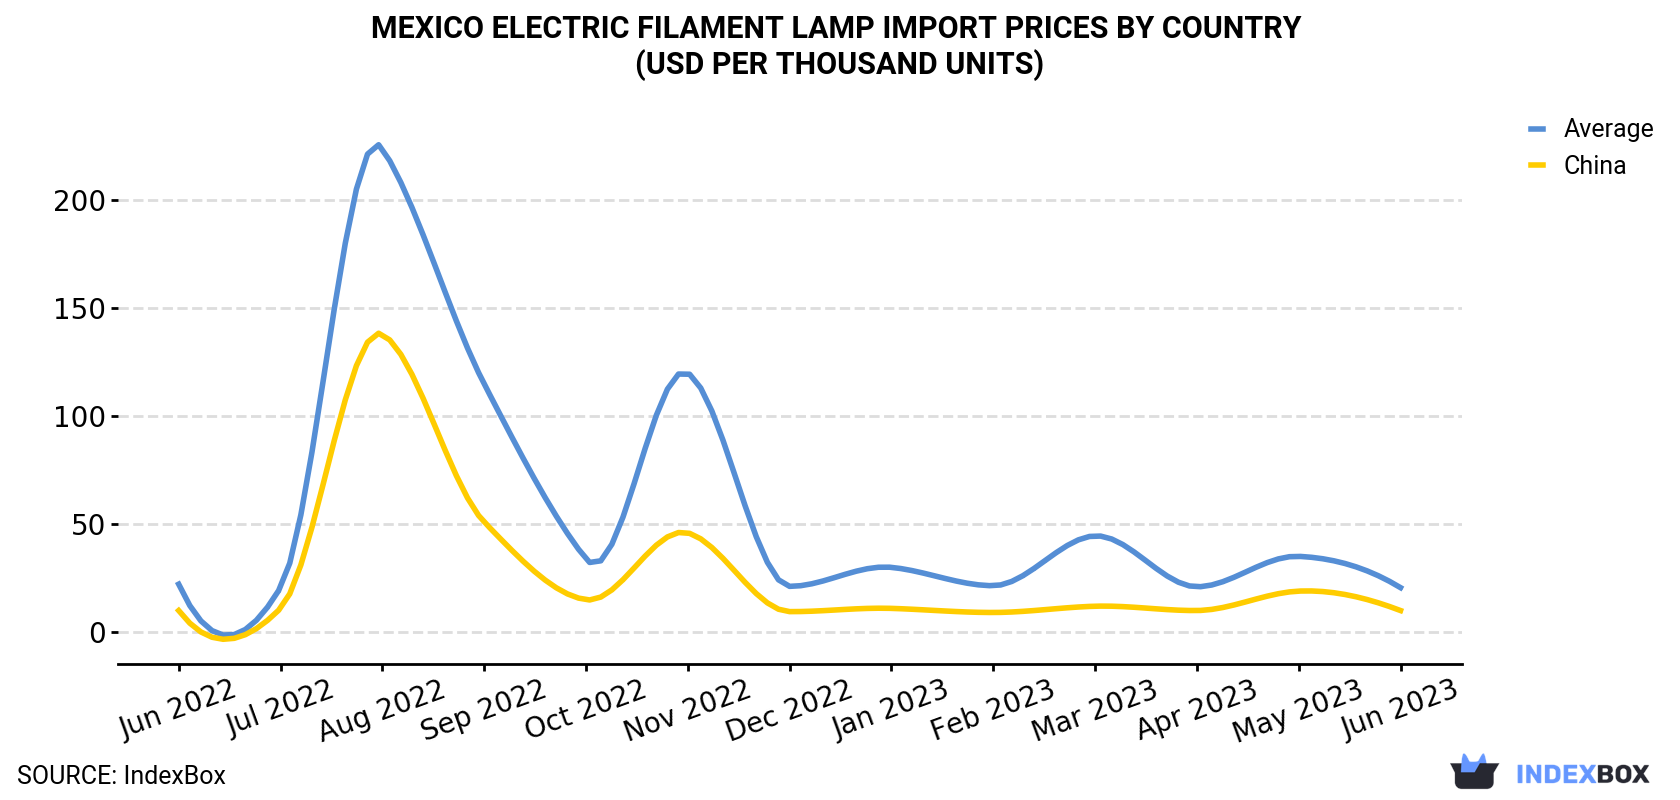
| COUNTRY | Import Price of Electric Filament Lamp in Mexico (USD per thousand units) | ||||||||||||
|---|---|---|---|---|---|---|---|---|---|---|---|---|---|
| Jun 2022 | Jul 2022 | Aug 2022 | Sep 2022 | Oct 2022 | Nov 2022 | Dec 2022 | Jan 2023 | Feb 2023 | Mar 2023 | Apr 2023 | May 2023 | Jun 2023 | |
| China | 10.0 | 11.0 | 138 | 51.0 | 15.0 | 46.0 | 9.5 | 11.0 | 9.1 | 12.0 | 10.0 | 19.0 | 10.0 |
| Average | 22.2 | 20.7 | 224 | 115 | 33.9 | 120 | 21.2 | 30.0 | 21.5 | 44.6 | 21.0 | 35.1 | 20.6 |
Mexico Electric Filament Lamp Imports
In June 2023, approximately 140M units of electric filament lamps were imported into Mexico; with an increase of 54% against May 2023 figures. Overall, imports, however, saw a perceptible slump. The pace of growth was the most pronounced in December 2022 with an increase of 555% month-to-month. Imports peaked at 196M units in July 2022; however, from August 2022 to June 2023, imports remained at a lower figure.
In value terms, electric filament lamp imports declined to $2.9M (IndexBox estimates) in June 2023. Over the period under review, imports, however, saw a perceptible setback. The growth pace was the most rapid in February 2023 with an increase of 36% m-o-m. Imports peaked at 4.2M units in June 2022; however, from July 2022 to June 2023, imports remained at a lower figure.
Mexico Electric Filament Lamp Imports by Country
In June 2023, China (136M units) was the main supplier of electric filament lamp to Mexico, accounting for a approximately 98% share of total imports.
From June 2022 to June 2023, the average monthly growth rate of volume from China stood at -2.4%.
In value terms, China ($1.4M) constituted the largest supplier of electric filament lamp to Mexico.
From June 2022 to June 2023, the average monthly rate of growth in terms of value from China stood at -2.4%.
This report provides an in-depth analysis of the electric filament lamp market in Mexico. Within it, you will discover the latest data on market trends and opportunities by country, consumption, production and price developments, as well as the global trade (imports and exports). The forecast exhibits the market prospects through 2030.
Product coverage:
- Prodcom 27401300 - Filament lamps of a power . .200 W and for a voltage > .100 V including reflector lamps (excluding ultraviolet, infrared lamps, t ungsten halogen filament lamps and sealed beam lamp units)
- Prodcom 27401460 - Filament lamps for motorcycles or other motor vehicles excluding sealed beam lamp units, tungsten halogen lamps
- Prodcom 27401490 - Filament lamps n.e.c.
Country coverage:
- Mexico
Data coverage:
- Market volume and value
- Per Capita consumption
- Forecast of the market dynamics in the medium term
- Trade (exports and imports) in Mexico
- Export and import prices
- Market trends, drivers and restraints
- Key market players and their profiles
Reasons to buy this report:
- Take advantage of the latest data
- Find deeper insights into current market developments
- Discover vital success factors affecting the market
This report is designed for manufacturers, distributors, importers, and wholesalers, as well as for investors, consultants and advisors.
In this report, you can find information that helps you to make informed decisions on the following issues:
- How to diversify your business and benefit from new market opportunities
- How to load your idle production capacity
- How to boost your sales on overseas markets
- How to increase your profit margins
- How to make your supply chain more sustainable
- How to reduce your production and supply chain costs
- How to outsource production to other countries
- How to prepare your business for global expansion
While doing this research, we combine the accumulated expertise of our analysts and the capabilities of artificial intelligence. The AI-based platform, developed by our data scientists, constitutes the key working tool for business analysts, empowering them to discover deep insights and ideas from the marketing data.
-
1. INTRODUCTION
Making Data-Driven Decisions to Grow Your Business
- REPORT DESCRIPTION
- RESEARCH METHODOLOGY AND AI PLATFORM
- DATA-DRIVEN DECISIONS FOR YOUR BUSINESS
- GLOSSARY AND SPECIFIC TERMS
-
2. EXECUTIVE SUMMARY
A Quick Overview of Market Performance
- KEY FINDINGS
- MARKET TRENDS This Chapter is Available Only for the Professional Edition PRO
-
3. MARKET OVERVIEW
Understanding the Current State of The Market and Its Prospects
- MARKET SIZE
- MARKET STRUCTURE
- TRADE BALANCE
- PER CAPITA CONSUMPTION
- MARKET FORECAST TO 2030
-
4. MOST PROMISING PRODUCT
Finding New Products to Diversify Your Business
This Chapter is Available Only for the Professional Edition PRO- TOP PRODUCTS TO DIVERSIFY YOUR BUSINESS
- BEST-SELLING PRODUCTS
- MOST CONSUMED PRODUCT
- MOST TRADED PRODUCT
- MOST PROFITABLE PRODUCT FOR EXPORT
-
5. MOST PROMISING SUPPLYING COUNTRIES
Choosing the Best Countries to Establish Your Sustainable Supply Chain
This Chapter is Available Only for the Professional Edition PRO- TOP COUNTRIES TO SOURCE YOUR PRODUCT
- TOP PRODUCING COUNTRIES
- TOP EXPORTING COUNTRIES
- LOW-COST EXPORTING COUNTRIES
-
6. MOST PROMISING OVERSEAS MARKETS
Choosing the Best Countries to Boost Your Exports
This Chapter is Available Only for the Professional Edition PRO- TOP OVERSEAS MARKETS FOR EXPORTING YOUR PRODUCT
- TOP CONSUMING MARKETS
- UNSATURATED MARKETS
- TOP IMPORTING MARKETS
- MOST PROFITABLE MARKETS
7. PRODUCTION
The Latest Trends and Insights into The Industry
- PRODUCTION VOLUME AND VALUE
8. IMPORTS
The Largest Import Supplying Countries
- IMPORTS FROM 2012–2023
- IMPORTS BY COUNTRY
- IMPORT PRICES BY COUNTRY
9. EXPORTS
The Largest Destinations for Exports
- EXPORTS FROM 2012–2023
- EXPORTS BY COUNTRY
- EXPORT PRICES BY COUNTRY
-
10. PROFILES OF MAJOR PRODUCERS
The Largest Producers on The Market and Their Profiles
This Chapter is Available Only for the Professional Edition PRO -
LIST OF TABLES
- Key Findings In 2023
- Market Volume, In Physical Terms, 2012–2023
- Market Value, 2012–2023
- Per Capita Consumption In 2012-2023
- Imports, In Physical Terms, By Country, 2012–2023
- Imports, In Value Terms, By Country, 2012–2023
- Import Prices, By Country Of Origin, 2012–2023
- Exports, In Physical Terms, By Country, 2012–2023
- Exports, In Value Terms, By Country, 2012–2023
- Export Prices, By Country Of Destination, 2012–2023
-
LIST OF FIGURES
- Market Volume, In Physical Terms, 2012–2023
- Market Value, 2012–2023
- Market Structure – Domestic Supply vs. Imports, In Physical Terms, 2012-2023
- Market Structure – Domestic Supply vs. Imports, In Value Terms, 2012-2023
- Trade Balance, In Physical Terms, 2012-2023
- Trade Balance, In Value Terms, 2012-2023
- Per Capita Consumption, 2012-2023
- Market Volume Forecast to 2030
- Market Value Forecast to 2030
- Products: Market Size And Growth, By Type
- Products: Average Per Capita Consumption, By Type
- Products: Exports And Growth, By Type
- Products: Export Prices And Growth, By Type
- Production Volume And Growth
- Exports And Growth
- Export Prices And Growth
- Market Size And Growth
- Per Capita Consumption
- Imports And Growth
- Import Prices
- Production, In Physical Terms, 2012–2023
- Production, In Value Terms, 2012–2023
- Imports, In Physical Terms, 2012–2023
- Imports, In Value Terms, 2012–2023
- Imports, In Physical Terms, By Country, 2023
- Imports, In Physical Terms, By Country, 2012–2023
- Imports, In Value Terms, By Country, 2012–2023
- Import Prices, By Country Of Origin, 2012–2023
- Exports, In Physical Terms, 2012–2023
- Exports, In Value Terms, 2012–2023
- Exports, In Physical Terms, By Country, 2023
- Exports, In Physical Terms, By Country, 2012–2023
- Exports, In Value Terms, By Country, 2012–2023
- Export Prices, By Country Of Destination, 2012–2023


