
Japan - Transmission Apparatus Incorporating Reception Apparatus - Market Analysis, Forecast, Size, Trends and Insights
Get instant access to more than 2 million reports, dashboards, and datasets on the IndexBox Platform.
View PricingJapan's Import of Transmission Apparatus Soars to $976M in July 2023
Japan Transmission Apparatus Imports
In July 2023, transmission apparatus imports into Japan soared to 2M units, surging by 17% against the previous month's figure. Overall, imports, however, saw a perceptible descent. The growth pace was the most rapid in September 2022 with an increase of 110% month-to-month. Imports peaked at 3.9M units in January 2023; however, from February 2023 to July 2023, imports failed to regain momentum.
In value terms, transmission apparatus imports skyrocketed to $976M (IndexBox estimates) in July 2023. Over the period under review, imports, however, continue to indicate a slight setback. The growth pace was the most rapid in September 2022 with an increase of 230% m-o-m. Over the period under review, imports reached the maximum at 2.7B units in January 2023; however, from February 2023 to July 2023, imports remained at a lower figure.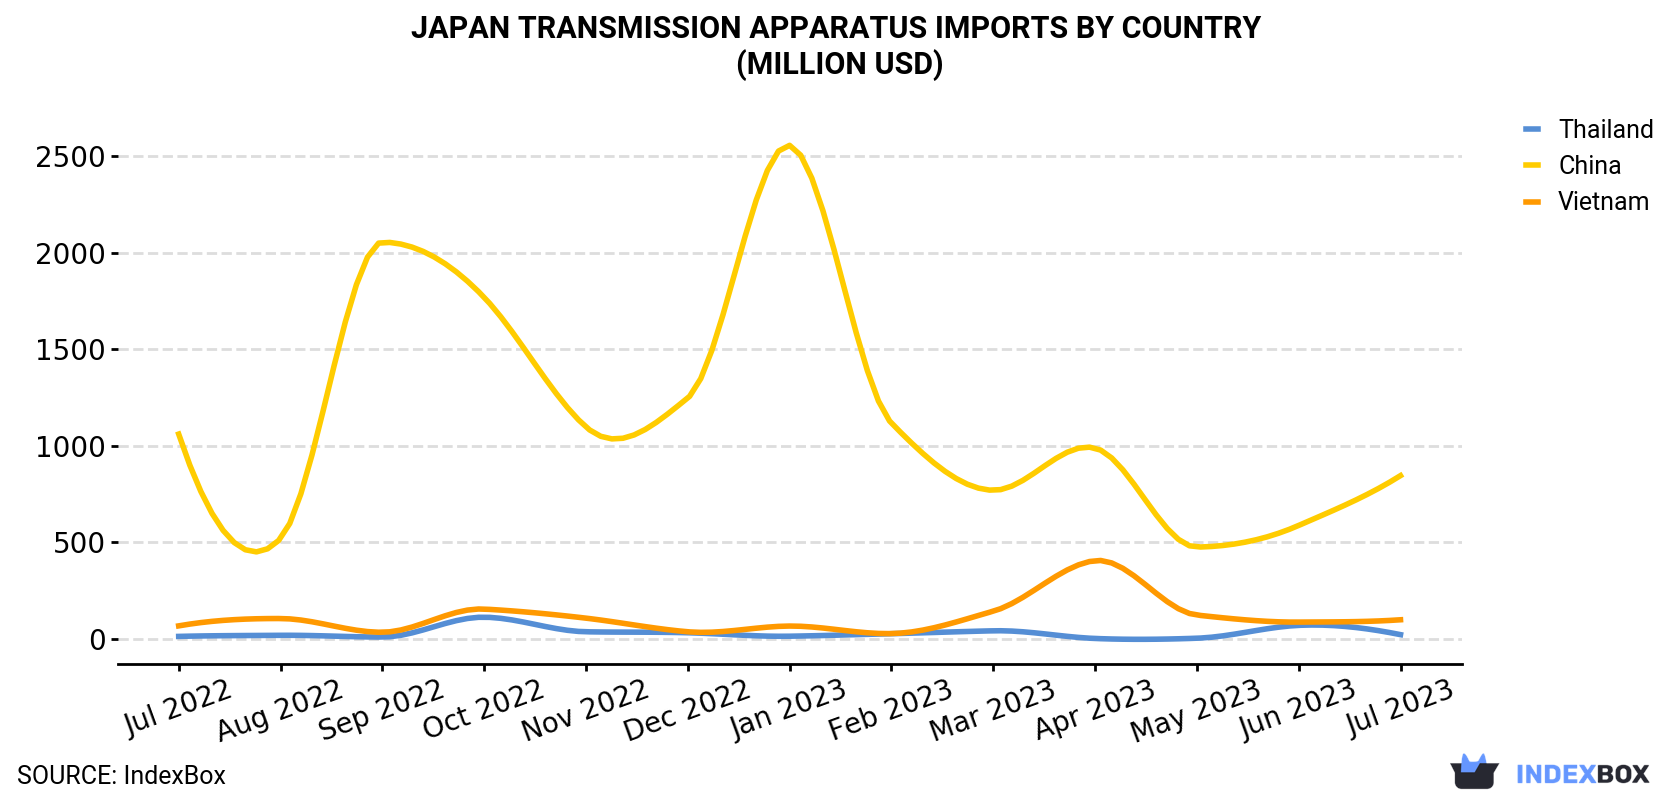
| COUNTRY | Import Value of Transmission Apparatus in Japan (million USD) | ||||||||||||
|---|---|---|---|---|---|---|---|---|---|---|---|---|---|
| Jul 2022 | Aug 2022 | Sep 2022 | Oct 2022 | Nov 2022 | Dec 2022 | Jan 2023 | Feb 2023 | Mar 2023 | Apr 2023 | May 2023 | Jun 2023 | Jul 2023 | |
| China | 1,060 | 519 | 2,054 | 1,768 | 1,097 | 1,247 | 2,555 | 1,117 | 769 | 988 | 475 | 587 | 845 |
| Vietnam | 67.0 | 105 | 33.9 | 154 | 107 | 36.5 | 66.1 | 27.1 | 143 | 405 | 123 | 86.6 | 98.6 |
| Thailand | 12.5 | 18.2 | 9.2 | 112 | 36.5 | 31.4 | 13.5 | 26.5 | 41.5 | 1.8 | 3.1 | 69.7 | 21.6 |
| Others | 28.7 | 14.6 | 71.2 | 41.0 | 10.9 | 13.0 | 17.8 | 5.5 | 19.1 | 10.0 | 4.9 | 12.2 | 10.2 |
| Total | 1,168 | 657 | 2,168 | 2,075 | 1,251 | 1,329 | 2,652 | 1,176 | 972 | 1,405 | 606 | 755 | 976 |
Imports by Country
In July 2023, China (1.7M units) constituted the largest supplier of transmission apparatus to Japan, accounting for a 84% share of total imports. Moreover, transmission apparatus imports from China exceeded the figures recorded by the second-largest supplier, Vietnam (264K units), sixfold.
From July 2022 to July 2023, the average monthly rate of growth in terms of volume from China stood at -3.5%. The remaining supplying countries recorded the following average monthly rates of imports growth: Vietnam (+3.0% per month) and Thailand (+1.7% per month).
In value terms, China ($845M) constituted the largest supplier of transmission apparatus to Japan, comprising 87% of total imports. The second position in the ranking was taken by Vietnam ($99M), with a 10% share of total imports.
From July 2022 to July 2023, the average monthly rate of growth in terms of value from China amounted to -1.9%. The remaining supplying countries recorded the following average monthly rates of imports growth: Vietnam (+3.3% per month) and Thailand (+4.6% per month).
Imports by Type
In July 2023, mobile phones (1.9M units) was the main type of transmission apparatus supplied to Japan, accounting for a 99% share of total imports. It was followed by transmission apparatus for radio-broadcasting and television (with reception apparatus) (13K units), with a 0.7% share of total imports.
From July 2022 to July 2023, the average monthly rate of growth in terms of the volume of import of mobile phones stood at -3.0%.
In value terms, mobile phones ($967M) constituted the largest type of transmission apparatus supplied to Japan, comprising 99% of total imports. The second position in the ranking was taken by transmission apparatus for radio-broadcasting and television (with reception apparatus) ($8.9M), with a 0.9% share of total imports.
Import Prices by Country
In July 2023, the transmission apparatus price amounted to $498 per unit (CIF, Japan), surging by 11% against the previous month. In general, import price indicated a modest expansion from July 2022 to July 2023: its price increased at an average monthly rate of +1.5% over the last twelve-month period. The trend pattern, however, indicated some noticeable fluctuations being recorded throughout the analyzed period. Based on July 2023 figures, transmission apparatus import price increased by +10.8% against June 2023 indices. The most prominent rate of growth was recorded in September 2022 an increase of 57% against the previous month. The import price peaked at $686 per unit in January 2023; however, from February 2023 to July 2023, import prices remained at a lower figure.
Prices varied noticeably by the country of origin: the country with the highest price was Thailand ($807 per unit), while the price for Vietnam ($373 per unit) was amongst the lowest.
From July 2022 to July 2023, the most notable rate of growth in terms of prices was attained by Thailand (+2.9%), while the prices for the other major suppliers experienced more modest paces of growth.
This report provides a comprehensive view of the transmission apparatus industry in Japan, tracking demand, supply, and trade flows across the national value chain. It explains how demand across key channels and end-use segments shapes consumption patterns, while also mapping the role of input availability, production efficiency, and regulatory standards on supply.
Beyond headline metrics, the study benchmarks prices, margins, and trade routes so you can see where value is created and how it moves between domestic suppliers and international partners. The analysis is designed to support strategic planning, market entry, portfolio prioritization, and risk management in the transmission apparatus landscape in Japan.
Quick navigation
- Key findings
- Report scope
- Product coverage
- Country coverage
- Methodology
- Forecasts to 2035
- Price analysis
- Market participants
- Country profiles
- How to use this report
- FAQ
Key findings
- Domestic demand is shaped by both household and industrial usage, with trade flows linking local supply to imports and exports.
- Pricing dynamics reflect unit values, freight costs, exchange rates, and regulatory shifts that affect sourcing decisions.
- Supply depends on input availability and production efficiency, creating a distinct national cost curve.
- Market concentration varies by segment, creating different competitive landscapes and entry barriers.
- The 2035 outlook highlights where capacity investment and demand growth are most aligned within the country.
Report scope
The report combines market sizing with trade intelligence and price analytics for Japan. It covers both historical performance and the forward outlook to 2035, allowing you to compare cycles, structural shifts, and policy impacts.
- Market size and growth in value and volume terms
- Consumption structure by end-use segments
- Production capacity, output, and cost dynamics
- Trade flows, exporters, importers, and balances
- Price benchmarks, unit values, and margin signals
- Competitive context and market entry conditions
Product coverage
- Prodcom 26301100 - Transmission apparatus for radio-broadcasting and television, w ith reception apparatus
- Prodcom 26302200 - Telephones for cellular networks or for other wireless networks
Country coverage
- Japan
Country profile and benchmarks
This report provides a consistent view of market size, trade balance, prices, and per-capita indicators for Japan. The profile highlights demand structure and trade position, enabling benchmarking against regional and global peers.
Methodology
The analysis is built on a multi-source framework that combines official statistics, trade records, company disclosures, and expert validation. Data are standardized, reconciled, and cross-checked to ensure consistency across time series.
- International trade data (exports, imports, and mirror statistics)
- National production and consumption statistics
- Company-level information from financial filings and public releases
- Price series and unit value benchmarks
- Analyst review, outlier checks, and time-series validation
All data are normalized to a common product definition and mapped to a consistent set of codes. This ensures that comparisons across time are aligned and actionable.
Forecasts to 2035
The forecast horizon extends to 2035 and is based on a structured model that links transmission apparatus demand and supply to macroeconomic indicators, trade patterns, and sector-specific drivers. The model captures both cyclical and structural factors and reflects known policy and technology shifts in Japan.
- Historical baseline: 2012-2025
- Forecast horizon: 2026-2035
- Scenario-based sensitivity to income growth, substitution, and regulation
- Capacity and investment outlook for major producing companies
Each projection is built from national historical patterns and the broader regional context, allowing the report to show where growth is concentrated and where risks are elevated.
Price analysis and trade dynamics
Prices are analyzed in detail, including export and import unit values, regional spreads, and changes in trade costs. The report highlights how seasonality, freight rates, exchange rates, and supply disruptions influence pricing and margins.
- Price benchmarks by country and sub-region
- Export and import unit value trends
- Seasonality and calendar effects in trade flows
- Price outlook to 2035 under baseline assumptions
Profiles of market participants
Key producers, exporters, and distributors are profiled with a focus on their operational scale, geographic footprint, product mix, and market positioning. This helps identify competitive pressure points, partnership opportunities, and routes to differentiation.
- Business focus and production capabilities
- Geographic reach and distribution networks
- Cost structure and pricing strategy indicators
- Compliance, certification, and sustainability context
How to use this report
- Quantify domestic demand and identify the most attractive segments
- Evaluate export opportunities and prioritize target destinations
- Track price dynamics and protect margins
- Benchmark performance against leading competitors
- Build evidence-based forecasts for investment decisions
This report is designed for manufacturers, distributors, importers, wholesalers, investors, and advisors who need a clear, data-driven picture of transmission apparatus dynamics in Japan.
FAQ
What is included in the transmission apparatus market in Japan?
The market size aggregates consumption and trade data, presented in both value and volume terms.
How are the forecasts to 2035 built?
The projections combine historical trends with macroeconomic indicators, trade dynamics, and sector-specific drivers.
Does the report cover prices and margins?
Yes, it includes export and import unit values, regional spreads, and a pricing outlook to 2035.
Which benchmarks are included?
The report benchmarks market size, trade balance, prices, and per-capita indicators for Japan.
Can this report support market entry decisions?
Yes, it highlights demand hotspots, trade routes, pricing trends, and competitive context.
1. INTRODUCTION
Making Data-Driven Decisions to Grow Your Business
- REPORT DESCRIPTION
- RESEARCH METHODOLOGY AND THE AI PLATFORM
- DATA-DRIVEN DECISIONS FOR YOUR BUSINESS
- GLOSSARY AND SPECIFIC TERMS
2. EXECUTIVE SUMMARY
A Quick Overview of Market Performance
- KEY FINDINGS
- MARKET TRENDSThis Chapter is Available Only for the Professional EditionPRO
3. MARKET OVERVIEW
Understanding the Current State of The Market and its Prospects
- MARKET SIZE: HISTORICAL DATA (2012–2025) AND FORECAST (2026–2035)
- MARKET STRUCTURE: HISTORICAL DATA (2012–2025) AND FORECAST (2026–2035)
- TRADE BALANCE: HISTORICAL DATA (2012–2025) AND FORECAST (2026–2035)
- PER CAPITA CONSUMPTION: HISTORICAL DATA (2012–2025) AND FORECAST (2026–2035)
- MARKET FORECAST TO 2035
4. MOST PROMISING PRODUCTS FOR DIVERSIFICATION
Finding New Products to Diversify Your Business
- TOP PRODUCTS TO DIVERSIFY YOUR BUSINESS
- BEST-SELLING PRODUCTS
- MOST CONSUMED PRODUCTS
- MOST TRADED PRODUCTS
- MOST PROFITABLE PRODUCTS FOR EXPORTS
5. MOST PROMISING SUPPLYING COUNTRIES
Choosing the Best Countries to Establish Your Sustainable Supply Chain
- TOP COUNTRIES TO SOURCE YOUR PRODUCT
- TOP PRODUCING COUNTRIES
- TOP EXPORTING COUNTRIES
- LOW-COST EXPORTING COUNTRIES
6. MOST PROMISING OVERSEAS MARKETS
Choosing the Best Countries to Boost Your Export
- TOP OVERSEAS MARKETS FOR EXPORTING YOUR PRODUCT
- TOP CONSUMING MARKETS
- UNSATURATED MARKETS
- TOP IMPORTING MARKETS
- MOST PROFITABLE MARKETS
7. PRODUCTION
The Latest Trends and Insights into The Industry
- PRODUCTION VOLUME AND VALUE: HISTORICAL DATA (2012–2025) AND FORECAST (2026–2035)
8. IMPORTS
The Largest Import Supplying Countries
- IMPORTS: HISTORICAL DATA (2012–2025) AND FORECAST (2026–2035)
- IMPORTS BY COUNTRY: HISTORICAL DATA (2012–2025)
- IMPORT PRICES BY COUNTRY: HISTORICAL DATA (2012–2025)
9. EXPORTS
The Largest Destinations for Exports
- EXPORTS: HISTORICAL DATA (2012–2025) AND FORECAST (2026–2035)
- EXPORTS BY COUNTRY: HISTORICAL DATA (2012–2025)
- EXPORT PRICES BY COUNTRY: HISTORICAL DATA (2012–2025)
10. PROFILES OF MAJOR PRODUCERS
The Largest Producers on The Market and Their Profiles
LIST OF TABLES
- Key Findings In 2025
- Market Volume, In Physical Terms: Historical Data (2012–2025) and Forecast (2026–2035)
- Market Value: Historical Data (2012–2025) and Forecast (2026–2035)
- Per Capita Consumption: Historical Data (2012–2025) and Forecast (2026–2035)
- Imports, In Physical Terms, By Country, 2012–2025
- Imports, In Value Terms, By Country, 2012–2025
- Import Prices, By Country, 2012–2025
- Exports, In Physical Terms, By Country, 2012–2025
- Exports, In Value Terms, By Country, 2012–2025
- Export Prices, By Country, 2012–2025
LIST OF FIGURES
- Market Volume, In Physical Terms: Historical Data (2012–2025) and Forecast (2026–2035)
- Market Value: Historical Data (2012–2025) and Forecast (2026–2035)
- Market Structure – Domestic Supply vs. Imports, in Physical Terms: Historical Data (2012–2025) and Forecast (2026–2035)
- Market Structure – Domestic Supply vs. Imports, in Value Terms: Historical Data (2012–2025) and Forecast (2026–2035)
- Trade Balance, In Physical Terms: Historical Data (2012–2025) and Forecast (2026–2035)
- Trade Balance, In Value Terms: Historical Data (2012–2025) and Forecast (2026–2035)
- Per Capita Consumption: Historical Data (2012–2025) and Forecast (2026–2035)
- Market Volume Forecast to 2035
- Market Value Forecast to 2035
- Market Size and Growth, By Product
- Average Per Capita Consumption, By Product
- Exports and Growth, By Product
- Export Prices and Growth, By Product
- Production Volume and Growth
- Exports and Growth
- Export Prices and Growth
- Market Size and Growth
- Per Capita Consumption
- Imports and Growth
- Import Prices
- Production, In Physical Terms: Historical Data (2012–2025) and Forecast (2026–2035)
- Production, In Value Terms: Historical Data (2012–2025) and Forecast (2026–2035)
- Imports, In Physical Terms: Historical Data (2012–2025) and Forecast (2026–2035)
- Imports, In Value Terms: Historical Data (2012–2025) and Forecast (2026–2035)
- Imports, In Physical Terms, By Country, 2025
- Imports, In Physical Terms, By Country, 2012–2025
- Imports, In Value Terms, By Country, 2012–2025
- Import Prices, By Country, 2012–2025
- Exports, In Physical Terms: Historical Data (2012–2025) and Forecast (2026–2035)
- Exports, In Value Terms: Historical Data (2012–2025) and Forecast (2026–2035)
- Exports, In Physical Terms, By Country, 2025
- Exports, In Physical Terms, By Country, 2012–2025
- Exports, In Value Terms, By Country, 2012–2025
- Export Prices, By Country, 2012–2025
Recommended posts
Free Data: Transmission Apparatus Incorporating Reception Apparatus - Japan
Instant access. No credit card needed.


