
Japan - Cotton Yarn - Market Analysis, Forecast, Size, Trends And Insights
Get instant access to more than 2 million reports, dashboards, and datasets on the IndexBox Platform.
View PricingSeptember 2023 Sees Japan's Cotton Yarn Imports Plummet to $13M
Japan Cotton Yarn Imports
In September 2023, overseas purchases of cotton yarn decreased by -17.7% to 3.1K tons for the first time since May 2023, thus ending a three-month rising trend. In general, imports showed a mild reduction. The most prominent rate of growth was recorded in April 2023 when imports increased by 25% m-o-m.
In value terms, cotton yarn imports declined rapidly to $13M (IndexBox estimates) in September 2023. Over the period under review, imports continue to indicate a pronounced decline. The pace of growth appeared the most rapid in April 2023 with an increase of 14% against the previous month.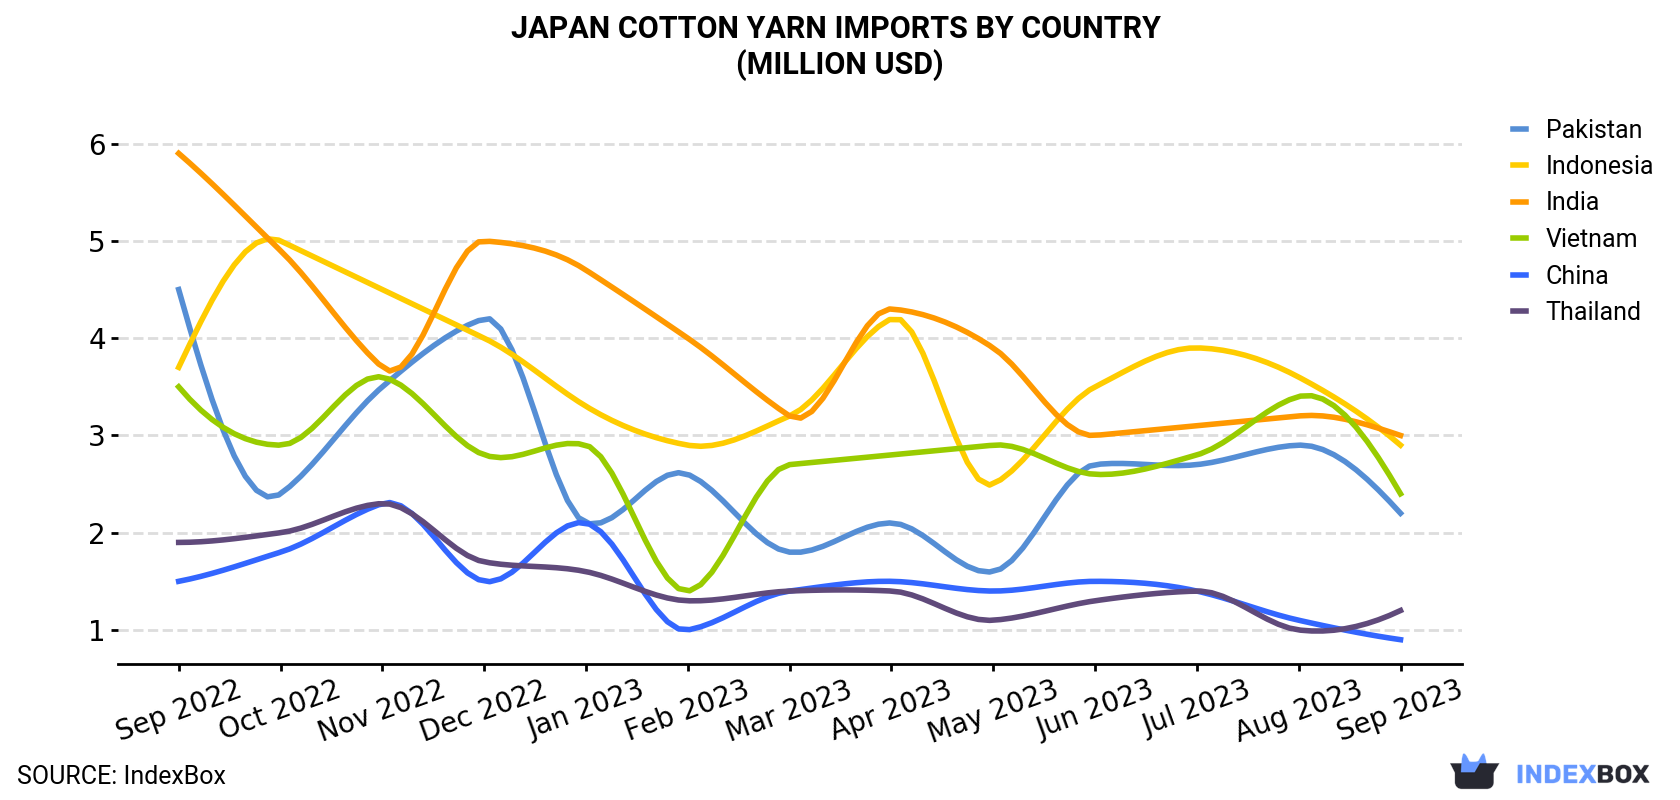
| COUNTRY | Import Value of Cotton Yarn in Japan (million USD) | ||||||||||||
|---|---|---|---|---|---|---|---|---|---|---|---|---|---|
| Sep 2022 | Oct 2022 | Nov 2022 | Dec 2022 | Jan 2023 | Feb 2023 | Mar 2023 | Apr 2023 | May 2023 | Jun 2023 | Jul 2023 | Aug 2023 | Sep 2023 | |
| India | 5.9 | 4.9 | 3.7 | 5.0 | 4.7 | 4.0 | 3.2 | 4.3 | 3.9 | 3.0 | 3.1 | 3.2 | 3.0 |
| Indonesia | 3.7 | 5.0 | 4.5 | 4.0 | 3.3 | 2.9 | 3.2 | 4.2 | 2.5 | 3.5 | 3.9 | 3.6 | 2.9 |
| Vietnam | 3.5 | 2.9 | 3.6 | 2.8 | 2.9 | 1.4 | 2.7 | 2.8 | 2.9 | 2.6 | 2.8 | 3.4 | 2.4 |
| Pakistan | 4.5 | 2.4 | 3.5 | 4.2 | 2.1 | 2.6 | 1.8 | 2.1 | 1.6 | 2.7 | 2.7 | 2.9 | 2.2 |
| Thailand | 1.9 | 2.0 | 2.3 | 1.7 | 1.6 | 1.3 | 1.4 | 1.4 | 1.1 | 1.3 | 1.4 | 1.0 | 1.2 |
| China | 1.5 | 1.8 | 2.3 | 1.5 | 2.1 | 1.0 | 1.4 | 1.5 | 1.4 | 1.5 | 1.4 | 1.1 | 0.9 |
| Others | 0.6 | 0.6 | 0.6 | 0.9 | 0.4 | 0.7 | 1.2 | 0.7 | 0.5 | 0.7 | 1.1 | 0.6 | 0.5 |
| Total | 21.6 | 19.6 | 20.5 | 20.1 | 17.1 | 13.9 | 14.9 | 17.0 | 13.9 | 15.3 | 16.3 | 15.8 | 13.1 |
Imports by Country
Indonesia (837 tons), Pakistan (721 tons) and Vietnam (686 tons) were the main suppliers of cotton yarn imports to Japan, with a combined 72% share of total imports.
From September 2022 to September 2023, the most notable rate of growth in terms of purchases, amongst the main suppliers, was attained by Indonesia (with a CAGR of +0.5%), while imports for the other leaders experienced a decline.
In value terms, India ($3M), Indonesia ($2.9M) and Vietnam ($2.4M) constituted the largest cotton yarn suppliers to Japan, together comprising 64% of total imports.
Indonesia, with a CAGR of -1.9%, saw the highest rates of growth with regard to the value of imports, in terms of the main suppliers over the period under review, while purchases for the other leaders experienced a decline.
Imports by Type
In September 2023, cotton yarn (other than sewing thread), containing 85% or more by weight of cotton, not put up for retail sale (2.9K tons) was the main type of cotton yarn supplied to Japan, accounting for a 94% share of total imports. Moreover, cotton yarn (other than sewing thread), containing 85% or more by weight of cotton, not put up for retail sale exceeded the figures recorded for the second-largest type, cotton yarn (other than sewing thread), containing less than 85% by weight of cotton, not put up for retail sale (183 tons), more than tenfold.
From September 2022 to September 2023, the average monthly rate of growth in terms of the volume of import of cotton yarn (other than sewing thread), containing 85% or more by weight of cotton, not put up for retail sale totaled -1.5%. With regard to the other supplied products, the following average monthly rates of growth were recorded: cotton yarn (other than sewing thread), containing less than 85% by weight of cotton, not put up for retail sale (-2.2% per month) and cotton yarn (other than sewing thread), put up for retail sale (+1.6% per month).
In value terms, cotton yarn (other than sewing thread), containing 85% or more by weight of cotton, not put up for retail sale ($12M) constituted the largest type of cotton yarn supplied to Japan, comprising 91% of total imports. The second position in the ranking was taken by cotton yarn (other than sewing thread), containing less than 85% by weight of cotton, not put up for retail sale ($848K), with a 6.5% share of total imports.
Import Prices by Country
In September 2023, the cotton yarn price amounted to $4,183 per ton (CIF, Japan), stabilizing at the previous month. Over the period under review, the import price, however, recorded a pronounced reduction. The growth pace was the most rapid in May 2023 an increase of 2.9% m-o-m. Over the period under review, average import prices reached the peak figure at $5,706 per ton in September 2022; however, from October 2022 to September 2023, import prices remained at a lower figure.
There were significant differences in the average prices amongst the major supplying countries. In September 2023, the country with the highest price was Thailand ($6,687 per ton), while the price for Pakistan ($3,028 per ton) was amongst the lowest.
From September 2022 to September 2023, the most notable rate of growth in terms of prices was attained by Thailand (+0.3%), while the prices for the other major suppliers experienced a decline.
This report provides an in-depth analysis of the cotton yarn market in Japan. Within it, you will discover the latest data on market trends and opportunities by country, consumption, production and price developments, as well as the global trade (imports and exports). The forecast exhibits the market prospects through 2030.
Product coverage:
- Prodcom 13106160 - Cotton yarn, p.r.s. (excluding sewing thread)
- Prodcom 131061Z1 - Cotton yarn of uncombed fibres, n.p.r.s.
- Prodcom 131061Z2 - Cotton yarn of combed fibres, n.p.r.s.
- Prodcom 13106132 - Yarn of uncombed cotton, n.p.r.s., for woven fabrics (excluding for carpets and floor coverings)
- Prodcom 13106133 - Yarn of uncombed cotton, n.p.r.s., for knitted fabrics and hosiery
- Prodcom 13106135 - Yarn of uncombed cotton, n.p.r.s., for other uses (including carpets and floor coverings)
- Prodcom 13106152 - Yarn of combed cotton, n.p.r.s., for woven fabrics (excluding for carpets and floor coverings)
- Prodcom 13106153 - Yarn of combed cotton, n.p.r.s., for knitted fabrics and hosiery
- Prodcom 13106155 - Yarn of combed cotton, n.p.r.s., for other uses (including carpets and floor coverings)
Country coverage:
- Japan
Data coverage:
- Market volume and value
- Per Capita consumption
- Forecast of the market dynamics in the medium term
- Trade (exports and imports) in Japan
- Export and import prices
- Market trends, drivers and restraints
- Key market players and their profiles
Reasons to buy this report:
- Take advantage of the latest data
- Find deeper insights into current market developments
- Discover vital success factors affecting the market
This report is designed for manufacturers, distributors, importers, and wholesalers, as well as for investors, consultants and advisors.
In this report, you can find information that helps you to make informed decisions on the following issues:
- How to diversify your business and benefit from new market opportunities
- How to load your idle production capacity
- How to boost your sales on overseas markets
- How to increase your profit margins
- How to make your supply chain more sustainable
- How to reduce your production and supply chain costs
- How to outsource production to other countries
- How to prepare your business for global expansion
While doing this research, we combine the accumulated expertise of our analysts and the capabilities of artificial intelligence. The AI-based platform, developed by our data scientists, constitutes the key working tool for business analysts, empowering them to discover deep insights and ideas from the marketing data.
-
1. INTRODUCTION
Making Data-Driven Decisions to Grow Your Business
- REPORT DESCRIPTION
- RESEARCH METHODOLOGY AND AI PLATFORM
- DATA-DRIVEN DECISIONS FOR YOUR BUSINESS
- GLOSSARY AND SPECIFIC TERMS
-
2. EXECUTIVE SUMMARY
A Quick Overview of Market Performance
- KEY FINDINGS
- MARKET TRENDS This Chapter is Available Only for the Professional Edition PRO
-
3. MARKET OVERVIEW
Understanding the Current State of The Market and Its Prospects
- MARKET SIZE
- MARKET STRUCTURE
- TRADE BALANCE
- PER CAPITA CONSUMPTION
- MARKET FORECAST TO 2030
-
4. MOST PROMISING PRODUCT
Finding New Products to Diversify Your Business
This Chapter is Available Only for the Professional Edition PRO- TOP PRODUCTS TO DIVERSIFY YOUR BUSINESS
- BEST-SELLING PRODUCTS
- MOST CONSUMED PRODUCT
- MOST TRADED PRODUCT
- MOST PROFITABLE PRODUCT FOR EXPORT
-
5. MOST PROMISING SUPPLYING COUNTRIES
Choosing the Best Countries to Establish Your Sustainable Supply Chain
This Chapter is Available Only for the Professional Edition PRO- TOP COUNTRIES TO SOURCE YOUR PRODUCT
- TOP PRODUCING COUNTRIES
- TOP EXPORTING COUNTRIES
- LOW-COST EXPORTING COUNTRIES
-
6. MOST PROMISING OVERSEAS MARKETS
Choosing the Best Countries to Boost Your Exports
This Chapter is Available Only for the Professional Edition PRO- TOP OVERSEAS MARKETS FOR EXPORTING YOUR PRODUCT
- TOP CONSUMING MARKETS
- UNSATURATED MARKETS
- TOP IMPORTING MARKETS
- MOST PROFITABLE MARKETS
7. PRODUCTION
The Latest Trends and Insights into The Industry
- PRODUCTION VOLUME AND VALUE
8. IMPORTS
The Largest Import Supplying Countries
- IMPORTS FROM 2012–2023
- IMPORTS BY COUNTRY
- IMPORT PRICES BY COUNTRY
9. EXPORTS
The Largest Destinations for Exports
- EXPORTS FROM 2012–2023
- EXPORTS BY COUNTRY
- EXPORT PRICES BY COUNTRY
-
10. PROFILES OF MAJOR PRODUCERS
The Largest Producers on The Market and Their Profiles
This Chapter is Available Only for the Professional Edition PRO -
LIST OF TABLES
- Key Findings In 2023
- Market Volume, In Physical Terms, 2012–2023
- Market Value, 2012–2023
- Per Capita Consumption In 2012-2023
- Imports, In Physical Terms, By Country, 2012–2023
- Imports, In Value Terms, By Country, 2012–2023
- Import Prices, By Country Of Origin, 2012–2023
- Exports, In Physical Terms, By Country, 2012–2023
- Exports, In Value Terms, By Country, 2012–2023
- Export Prices, By Country Of Destination, 2012–2023
-
LIST OF FIGURES
- Market Volume, In Physical Terms, 2012–2023
- Market Value, 2012–2023
- Market Structure – Domestic Supply vs. Imports, In Physical Terms, 2012-2023
- Market Structure – Domestic Supply vs. Imports, In Value Terms, 2012-2023
- Trade Balance, In Physical Terms, 2012-2023
- Trade Balance, In Value Terms, 2012-2023
- Per Capita Consumption, 2012-2023
- Market Volume Forecast to 2030
- Market Value Forecast to 2030
- Products: Market Size And Growth, By Type
- Products: Average Per Capita Consumption, By Type
- Products: Exports And Growth, By Type
- Products: Export Prices And Growth, By Type
- Production Volume And Growth
- Exports And Growth
- Export Prices And Growth
- Market Size And Growth
- Per Capita Consumption
- Imports And Growth
- Import Prices
- Production, In Physical Terms, 2012–2023
- Production, In Value Terms, 2012–2023
- Imports, In Physical Terms, 2012–2023
- Imports, In Value Terms, 2012–2023
- Imports, In Physical Terms, By Country, 2023
- Imports, In Physical Terms, By Country, 2012–2023
- Imports, In Value Terms, By Country, 2012–2023
- Import Prices, By Country Of Origin, 2012–2023
- Exports, In Physical Terms, 2012–2023
- Exports, In Value Terms, 2012–2023
- Exports, In Physical Terms, By Country, 2023
- Exports, In Physical Terms, By Country, 2012–2023
- Exports, In Value Terms, By Country, 2012–2023
- Export Prices, By Country Of Destination, 2012–2023


