
Japan - Ball and Roller Bearings - Market Analysis, Forecast, Size, Trends And Insights
Get instant access to more than 2 million reports, dashboards, and datasets on the IndexBox Platform.
View PricingExport of Bearings Sees Substantial Drop to $212M in Japan During November 2023
Japan Bearing Exports
In November 2023, approximately 14K tons of ball and roller bearings were exported from Japan; which is down by -6.1% on the previous month. In general, exports showed a slight slump. The pace of growth appeared the most rapid in June 2023 when exports increased by 24% against the previous month.
In value terms, bearing exports fell to $212M (IndexBox estimates) in November 2023. Over the period under review, exports saw a perceptible setback. The pace of growth appeared the most rapid in June 2023 with an increase of 17% month-to-month.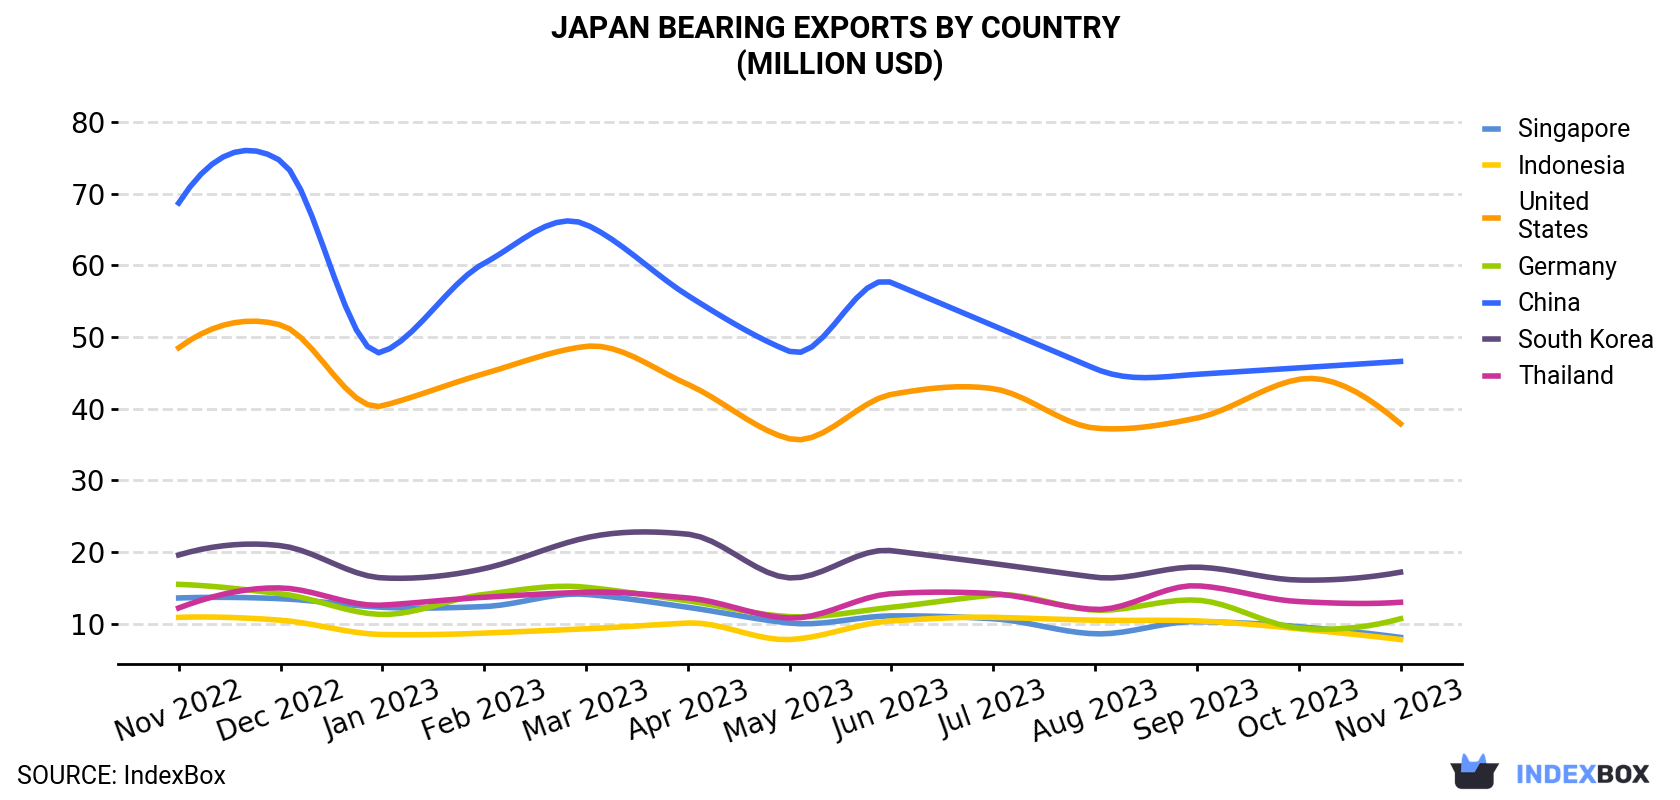
| COUNTRY | Export Value of Bearing in Japan (million USD) | ||||||||||||
|---|---|---|---|---|---|---|---|---|---|---|---|---|---|
| Nov 2022 | Dec 2022 | Jan 2023 | Feb 2023 | Mar 2023 | Apr 2023 | May 2023 | Jun 2023 | Jul 2023 | Aug 2023 | Sep 2023 | Oct 2023 | Nov 2023 | |
| China | 68.7 | 74.6 | 47.9 | 60.3 | 65.7 | 55.8 | 48.0 | 57.6 | 51.6 | 45.6 | 44.8 | 45.7 | 46.6 |
| United States | 48.5 | 51.7 | 40.4 | 44.9 | 48.7 | 43.4 | 35.8 | 42.0 | 42.8 | 37.3 | 38.7 | 44.1 | 37.9 |
| South Korea | 19.6 | 20.9 | 16.4 | 17.7 | 22.0 | 22.5 | 16.4 | 20.2 | 18.4 | 16.5 | 17.9 | 16.1 | 17.2 |
| Thailand | 12.2 | 15.0 | 12.6 | 13.7 | 14.4 | 13.6 | 10.8 | 14.2 | 14.2 | 12.0 | 15.3 | 13.1 | 13.0 |
| Germany | 15.5 | 14.2 | 11.3 | 14.1 | 15.1 | 13.2 | 11.0 | 12.3 | 14.0 | 11.9 | 13.3 | 9.4 | 10.7 |
| Singapore | 13.6 | 13.5 | 12.3 | 12.4 | 14.1 | 12.3 | 10.1 | 11.1 | 10.7 | 8.6 | 10.3 | 9.6 | 8.1 |
| Indonesia | 10.9 | 10.5 | 8.5 | 8.7 | 9.3 | 10.1 | 7.8 | 10.4 | 10.9 | 10.5 | 10.4 | 9.3 | 7.8 |
| Others | 88.5 | 94.7 | 75.7 | 82.7 | 85.7 | 86.5 | 71.7 | 80.6 | 86.0 | 70.5 | 81.1 | 80.4 | 70.3 |
| Total | 278 | 295 | 225 | 255 | 275 | 257 | 212 | 248 | 249 | 213 | 232 | 228 | 212 |
Exports by Country
China (3K tons), the United States (2K tons) and South Korea (1.1K tons) were the main destinations of bearing exports from Japan, together accounting for 44% of total exports. Thailand, Germany, Singapore and Indonesia lagged somewhat behind, together comprising a further 23%.
From November 2022 to November 2023, the biggest increases were in Thailand (with a CAGR of -0.1%), while shipments for the other leaders experienced a decline.
In value terms, China ($47M), the United States ($38M) and South Korea ($17M) were the largest markets for bearing exported from Japan worldwide, with a combined 48% share of total exports. These countries were followed by Thailand, Germany, Singapore and Indonesia, which together accounted for a further 19%.
In terms of the main countries of destination, Thailand, with a CAGR of +0.6%, recorded the highest growth rate of the value of exports, over the period under review, while shipments for the other leaders experienced a decline.
Export Prices by Country
In November 2023, the bearing price stood at $15,249 per ton (FOB, Japan), approximately mirroring the previous month. In general, the export price showed a relatively flat trend pattern. The growth pace was the most rapid in January 2023 when the average export price increased by 4.6% month-to-month. As a result, the export price reached the peak level of $17,235 per ton. From February 2023 to November 2023, the the average export prices failed to regain momentum.
There were significant differences in the average prices for the major overseas markets. In November 2023, the country with the highest price was Mexico ($20,336 per ton), while the average price for exports to the United Arab Emirates ($10,004 per ton) was amongst the lowest.
From November 2022 to November 2023, the most notable rate of growth in terms of prices was recorded for supplies to Mexico (+0.8%), while the prices for the other major destinations experienced more modest paces of growth.
This report provides an in-depth analysis of the bearing market in Japan. Within it, you will discover the latest data on market trends and opportunities by country, consumption, production and price developments, as well as the global trade (imports and exports). The forecast exhibits the market prospects through 2030.
Product coverage:
- Prodcom 28151030 - Ball bearings
- Prodcom 28151053 - Tapered roller bearings (including cone and tapered roller assemblies)
- Prodcom 28151055 - Spherical roller bearings
- Prodcom 28151057 - Cylindrical roller bearings (excluding roller bearings, needle roller bearings)
- Prodcom 28151070 - Needle roller bearings
- Prodcom 28151090 - Roller bearings (including combined ball/roller bearings) (excluding tapered roller bearings, spherical roller bearings, n eedle roller bearings)
Country coverage:
- Japan
Data coverage:
- Market volume and value
- Per Capita consumption
- Forecast of the market dynamics in the medium term
- Trade (exports and imports) in Japan
- Export and import prices
- Market trends, drivers and restraints
- Key market players and their profiles
Reasons to buy this report:
- Take advantage of the latest data
- Find deeper insights into current market developments
- Discover vital success factors affecting the market
This report is designed for manufacturers, distributors, importers, and wholesalers, as well as for investors, consultants and advisors.
In this report, you can find information that helps you to make informed decisions on the following issues:
- How to diversify your business and benefit from new market opportunities
- How to load your idle production capacity
- How to boost your sales on overseas markets
- How to increase your profit margins
- How to make your supply chain more sustainable
- How to reduce your production and supply chain costs
- How to outsource production to other countries
- How to prepare your business for global expansion
While doing this research, we combine the accumulated expertise of our analysts and the capabilities of artificial intelligence. The AI-based platform, developed by our data scientists, constitutes the key working tool for business analysts, empowering them to discover deep insights and ideas from the marketing data.
-
1. INTRODUCTION
Making Data-Driven Decisions to Grow Your Business
- REPORT DESCRIPTION
- RESEARCH METHODOLOGY AND AI PLATFORM
- DATA-DRIVEN DECISIONS FOR YOUR BUSINESS
- GLOSSARY AND SPECIFIC TERMS
-
2. EXECUTIVE SUMMARY
A Quick Overview of Market Performance
- KEY FINDINGS
- MARKET TRENDS This Chapter is Available Only for the Professional Edition PRO
-
3. MARKET OVERVIEW
Understanding the Current State of The Market and Its Prospects
- MARKET SIZE
- MARKET STRUCTURE
- TRADE BALANCE
- PER CAPITA CONSUMPTION
- MARKET FORECAST TO 2030
-
4. MOST PROMISING PRODUCT
Finding New Products to Diversify Your Business
This Chapter is Available Only for the Professional Edition PRO- TOP PRODUCTS TO DIVERSIFY YOUR BUSINESS
- BEST-SELLING PRODUCTS
- MOST CONSUMED PRODUCT
- MOST TRADED PRODUCT
- MOST PROFITABLE PRODUCT FOR EXPORT
-
5. MOST PROMISING SUPPLYING COUNTRIES
Choosing the Best Countries to Establish Your Sustainable Supply Chain
This Chapter is Available Only for the Professional Edition PRO- TOP COUNTRIES TO SOURCE YOUR PRODUCT
- TOP PRODUCING COUNTRIES
- TOP EXPORTING COUNTRIES
- LOW-COST EXPORTING COUNTRIES
-
6. MOST PROMISING OVERSEAS MARKETS
Choosing the Best Countries to Boost Your Exports
This Chapter is Available Only for the Professional Edition PRO- TOP OVERSEAS MARKETS FOR EXPORTING YOUR PRODUCT
- TOP CONSUMING MARKETS
- UNSATURATED MARKETS
- TOP IMPORTING MARKETS
- MOST PROFITABLE MARKETS
7. PRODUCTION
The Latest Trends and Insights into The Industry
- PRODUCTION VOLUME AND VALUE
8. IMPORTS
The Largest Import Supplying Countries
- IMPORTS FROM 2012–2023
- IMPORTS BY COUNTRY
- IMPORT PRICES BY COUNTRY
9. EXPORTS
The Largest Destinations for Exports
- EXPORTS FROM 2012–2023
- EXPORTS BY COUNTRY
- EXPORT PRICES BY COUNTRY
-
10. PROFILES OF MAJOR PRODUCERS
The Largest Producers on The Market and Their Profiles
This Chapter is Available Only for the Professional Edition PRO -
LIST OF TABLES
- Key Findings In 2023
- Market Volume, In Physical Terms, 2012–2023
- Market Value, 2012–2023
- Per Capita Consumption In 2012-2023
- Imports, In Physical Terms, By Country, 2012–2023
- Imports, In Value Terms, By Country, 2012–2023
- Import Prices, By Country Of Origin, 2012–2023
- Exports, In Physical Terms, By Country, 2012–2023
- Exports, In Value Terms, By Country, 2012–2023
- Export Prices, By Country Of Destination, 2012–2023
-
LIST OF FIGURES
- Market Volume, In Physical Terms, 2012–2023
- Market Value, 2012–2023
- Market Structure – Domestic Supply vs. Imports, In Physical Terms, 2012-2023
- Market Structure – Domestic Supply vs. Imports, In Value Terms, 2012-2023
- Trade Balance, In Physical Terms, 2012-2023
- Trade Balance, In Value Terms, 2012-2023
- Per Capita Consumption, 2012-2023
- Market Volume Forecast to 2030
- Market Value Forecast to 2030
- Products: Market Size And Growth, By Type
- Products: Average Per Capita Consumption, By Type
- Products: Exports And Growth, By Type
- Products: Export Prices And Growth, By Type
- Production Volume And Growth
- Exports And Growth
- Export Prices And Growth
- Market Size And Growth
- Per Capita Consumption
- Imports And Growth
- Import Prices
- Production, In Physical Terms, 2012–2023
- Production, In Value Terms, 2012–2023
- Imports, In Physical Terms, 2012–2023
- Imports, In Value Terms, 2012–2023
- Imports, In Physical Terms, By Country, 2023
- Imports, In Physical Terms, By Country, 2012–2023
- Imports, In Value Terms, By Country, 2012–2023
- Import Prices, By Country Of Origin, 2012–2023
- Exports, In Physical Terms, 2012–2023
- Exports, In Value Terms, 2012–2023
- Exports, In Physical Terms, By Country, 2023
- Exports, In Physical Terms, By Country, 2012–2023
- Exports, In Value Terms, By Country, 2012–2023
- Export Prices, By Country Of Destination, 2012–2023


