
Italy - Footwear - Market Analysis, Forecast, Size, Trends And Insights
Get instant access to more than 2 million reports, dashboards, and datasets on the IndexBox Platform.
View PricingSignificant Decrease in Italy's August 2023 Export of Waterproof Shoes to $8.3M
Italy Waterproof Footwear Exports
In August 2023, overseas shipments of waterproof footwear decreased by -43.7% to 374K pairs for the first time since April 2023, thus ending a three-month rising trend. Over the period under review, exports recorded a slight curtailment. The most prominent rate of growth was recorded in September 2022 with an increase of 169% month-to-month. As a result, the exports attained the peak of 1.1M pairs. From October 2022 to August 2023, the growth of the exports remained at a lower figure.
In value terms, waterproof footwear exports plummeted to $8.3M (IndexBox estimates) in August 2023. Overall, exports, however, continue to indicate a relatively flat trend pattern. The pace of growth was the most pronounced in September 2022 with an increase of 131% against the previous month. As a result, the exports reached the peak of $19M. From October 2022 to August 2023, the growth of the exports failed to regain momentum.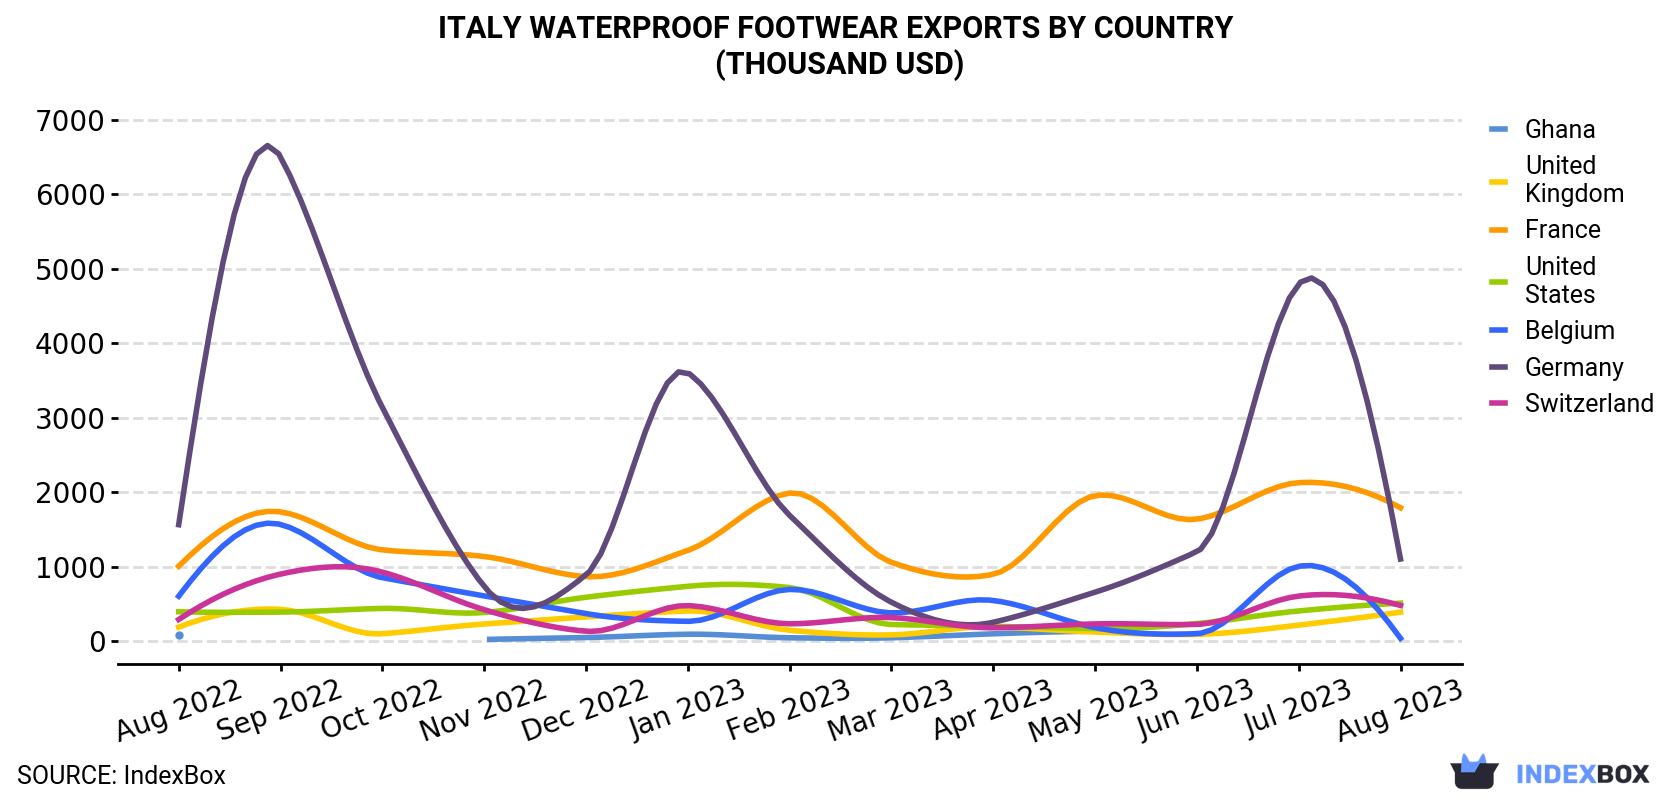
| COUNTRY | Export Value of Waterproof Footwear in Italy (thousand USD) | ||||||||||||
|---|---|---|---|---|---|---|---|---|---|---|---|---|---|
| Aug 2022 | Sep 2022 | Oct 2022 | Nov 2022 | Dec 2022 | Jan 2023 | Feb 2023 | Mar 2023 | Apr 2023 | May 2023 | Jun 2023 | Jul 2023 | Aug 2023 | |
| France | 1,008 | 1,738 | 1,227 | 1,138 | 868 | 1,220 | 1,990 | 1,060 | 899 | 1,956 | 1,639 | 2,130 | 1,792 |
| Germany | 1,565 | 6,504 | 3,140 | 736 | 890 | 3,607 | 1,690 | 524 | 255 | 659 | 1,202 | 4,798 | 1,104 |
| United States | 396 | 392 | 441 | 386 | 591 | 738 | 721 | 225 | 201 | 170 | 238 | 407 | 512 |
| Switzerland | 292 | 902 | 929 | 424 | 135 | 479 | 235 | 318 | 181 | 233 | 227 | 607 | 481 |
| United Kingdom | 190 | 429 | 101 | 232 | 327 | 407 | 148 | 86.0 | 193 | 124 | 92.3 | 217 | 391 |
| Belgium | 605 | 1,569 | 854 | 609 | 372 | 268 | 696 | 381 | 548 | 183 | 102 | 1,007 | 39.4 |
| Ghana | 85.2 | N/A | N/A | 24.9 | 50.4 | 94.6 | 47.1 | 47.0 | 100 | 136 | N/A | N/A | N/A |
| Others | 3,924 | 7,097 | 5,084 | 3,108 | 2,235 | 2,178 | 4,582 | 3,508 | 2,338 | 2,388 | 3,246 | 4,701 | 3,990 |
| Total | 8,065 | 18,631 | 11,776 | 6,659 | 5,470 | 8,990 | 10,110 | 6,150 | 4,715 | 5,848 | 6,746 | 13,868 | 8,310 |
Exports by Country
France (140K pairs) was the main destination for waterproof footwear exports from Italy, with a 37% share of total exports. Moreover, waterproof footwear exports to France exceeded the volume sent to the second major destination, Germany (59K pairs), twofold. The third position in this ranking was taken by Switzerland (15K pairs), with a 3.9% share.
From August 2022 to August 2023, the average monthly rate of growth in terms of volume to France amounted to +4.8%. Exports to the other major destinations recorded the following average monthly rates of exports growth: Germany (-3.0% per month) and Switzerland (+5.2% per month).
In value terms, France ($1.8M), Germany ($1.1M) and the United States ($512K) were the largest markets for waterproof footwear exported from Italy worldwide, together accounting for 41% of total exports. These countries were followed by Switzerland, the UK and Belgium, which together accounted for a further 11%.
the UK, with a CAGR of +6.2%, saw the highest growth rate of the value of exports, among the main countries of destination over the period under review, while shipments for the other leaders experienced more modest paces of growth.
Exports by Type
Waterproof footwear, no toe cap, over ankle (316K pairs) was the largest type of waterproof footwear exported from Italy, accounting for a 84% share of total exports. Moreover, waterproof footwear, no toe cap, over ankle exceeded the volume of the second product type, waterproof footwear, no toe cap, nes (58K pairs), fivefold.
From August 2022 to August 2023, the average monthly rate of growth in terms of the volume of export of waterproof footwear, no toe cap, over ankle was relatively modest.
In value terms, the most traded types of waterproof footwear in Italy were waterproof footwear, no toe cap, over ankle ($5M) and waterproof footwear, no toe cap, nes ($3.3M).
Footwear; waterproof, n.e.s. in heading no. 6401, rubber or plastic outer soles and uppers (not assembled by stitch, rivet, nail, screw, plug or similar), with a CAGR of +1.8%, recorded the highest rates of growth with regard to the value of exports, in terms of the main product categories over the period under review.
Export Prices by Country
In August 2023, the waterproof footwear price amounted to $22.2 per pair (FOB, Italy), increasing by 6.4% against the previous month. Over the period from August 2022 to August 2023, it increased at an average monthly rate of +1.3%. The most prominent rate of growth was recorded in March 2023 when the average export price increased by 22% m-o-m. The export price peaked in August 2023.
Prices varied noticeably by the country of destination: the country with the highest price was the United States ($94.6 per pair), while the average price for exports to Bosnia and Herzegovina ($8.2 per pair) was amongst the lowest.
From August 2022 to August 2023, the most notable rate of growth in terms of prices was recorded for supplies to Belgium (+11.6%), while the prices for the other major destinations experienced more modest paces of growth.
This report provides an in-depth analysis of the waterproof footwear market in Italy. Within it, you will discover the latest data on market trends and opportunities by country, consumption, production and price developments, as well as the global trade (imports and exports). The forecast exhibits the market prospects through 2030.
Product coverage:
- Prodcom 15201100 - Waterproof footwear, with uppers in rubber or plastics (excluding incorporating a protective metal toecap)
Country coverage:
- Italy
Data coverage:
- Market volume and value
- Per Capita consumption
- Forecast of the market dynamics in the medium term
- Trade (exports and imports) in Italy
- Export and import prices
- Market trends, drivers and restraints
- Key market players and their profiles
Reasons to buy this report:
- Take advantage of the latest data
- Find deeper insights into current market developments
- Discover vital success factors affecting the market
This report is designed for manufacturers, distributors, importers, and wholesalers, as well as for investors, consultants and advisors.
In this report, you can find information that helps you to make informed decisions on the following issues:
- How to diversify your business and benefit from new market opportunities
- How to load your idle production capacity
- How to boost your sales on overseas markets
- How to increase your profit margins
- How to make your supply chain more sustainable
- How to reduce your production and supply chain costs
- How to outsource production to other countries
- How to prepare your business for global expansion
While doing this research, we combine the accumulated expertise of our analysts and the capabilities of artificial intelligence. The AI-based platform, developed by our data scientists, constitutes the key working tool for business analysts, empowering them to discover deep insights and ideas from the marketing data.
-
1. INTRODUCTION
Making Data-Driven Decisions to Grow Your Business
- REPORT DESCRIPTION
- RESEARCH METHODOLOGY AND AI PLATFORM
- DATA-DRIVEN DECISIONS FOR YOUR BUSINESS
- GLOSSARY AND SPECIFIC TERMS
-
2. EXECUTIVE SUMMARY
A Quick Overview of Market Performance
- KEY FINDINGS
- MARKET TRENDS This Chapter is Available Only for the Professional Edition PRO
-
3. MARKET OVERVIEW
Understanding the Current State of The Market and Its Prospects
- MARKET SIZE
- MARKET STRUCTURE
- TRADE BALANCE
- PER CAPITA CONSUMPTION
- MARKET FORECAST TO 2030
-
4. MOST PROMISING PRODUCT
Finding New Products to Diversify Your Business
This Chapter is Available Only for the Professional Edition PRO- TOP PRODUCTS TO DIVERSIFY YOUR BUSINESS
- BEST-SELLING PRODUCTS
- MOST CONSUMED PRODUCT
- MOST TRADED PRODUCT
- MOST PROFITABLE PRODUCT FOR EXPORT
-
5. MOST PROMISING SUPPLYING COUNTRIES
Choosing the Best Countries to Establish Your Sustainable Supply Chain
This Chapter is Available Only for the Professional Edition PRO- TOP COUNTRIES TO SOURCE YOUR PRODUCT
- TOP PRODUCING COUNTRIES
- TOP EXPORTING COUNTRIES
- LOW-COST EXPORTING COUNTRIES
-
6. MOST PROMISING OVERSEAS MARKETS
Choosing the Best Countries to Boost Your Exports
This Chapter is Available Only for the Professional Edition PRO- TOP OVERSEAS MARKETS FOR EXPORTING YOUR PRODUCT
- TOP CONSUMING MARKETS
- UNSATURATED MARKETS
- TOP IMPORTING MARKETS
- MOST PROFITABLE MARKETS
7. PRODUCTION
The Latest Trends and Insights into The Industry
- PRODUCTION VOLUME AND VALUE
8. IMPORTS
The Largest Import Supplying Countries
- IMPORTS FROM 2012–2023
- IMPORTS BY COUNTRY
- IMPORT PRICES BY COUNTRY
9. EXPORTS
The Largest Destinations for Exports
- EXPORTS FROM 2012–2023
- EXPORTS BY COUNTRY
- EXPORT PRICES BY COUNTRY
-
10. PROFILES OF MAJOR PRODUCERS
The Largest Producers on The Market and Their Profiles
This Chapter is Available Only for the Professional Edition PRO -
LIST OF TABLES
- Key Findings In 2023
- Market Volume, In Physical Terms, 2012–2023
- Market Value, 2012–2023
- Per Capita Consumption In 2012-2023
- Imports, In Physical Terms, By Country, 2012–2023
- Imports, In Value Terms, By Country, 2012–2023
- Import Prices, By Country Of Origin, 2012–2023
- Exports, In Physical Terms, By Country, 2012–2023
- Exports, In Value Terms, By Country, 2012–2023
- Export Prices, By Country Of Destination, 2012–2023
-
LIST OF FIGURES
- Market Volume, In Physical Terms, 2012–2023
- Market Value, 2012–2023
- Market Structure – Domestic Supply vs. Imports, In Physical Terms, 2012-2023
- Market Structure – Domestic Supply vs. Imports, In Value Terms, 2012-2023
- Trade Balance, In Physical Terms, 2012-2023
- Trade Balance, In Value Terms, 2012-2023
- Per Capita Consumption, 2012-2023
- Market Volume Forecast to 2030
- Market Value Forecast to 2030
- Products: Market Size And Growth, By Type
- Products: Average Per Capita Consumption, By Type
- Products: Exports And Growth, By Type
- Products: Export Prices And Growth, By Type
- Production Volume And Growth
- Exports And Growth
- Export Prices And Growth
- Market Size And Growth
- Per Capita Consumption
- Imports And Growth
- Import Prices
- Production, In Physical Terms, 2012–2023
- Production, In Value Terms, 2012–2023
- Imports, In Physical Terms, 2012–2023
- Imports, In Value Terms, 2012–2023
- Imports, In Physical Terms, By Country, 2023
- Imports, In Physical Terms, By Country, 2012–2023
- Imports, In Value Terms, By Country, 2012–2023
- Import Prices, By Country Of Origin, 2012–2023
- Exports, In Physical Terms, 2012–2023
- Exports, In Value Terms, 2012–2023
- Exports, In Physical Terms, By Country, 2023
- Exports, In Physical Terms, By Country, 2012–2023
- Exports, In Value Terms, By Country, 2012–2023
- Export Prices, By Country Of Destination, 2012–2023


