
Italy - Vermouth - Market Analysis, Forecast, Size, Trends And Insights
Get instant access to more than 2 million reports, dashboards, and datasets on the IndexBox Platform.
View PricingItaly's Export of Vermouth Plunges to $28M in November 2023
Italy Vermouth Exports
In November 2023, shipments abroad of vermouth decreased by -9.7% to 12M litres for the first time since August 2023, thus ending a two-month rising trend. Over the period under review, exports recorded a relatively flat trend pattern. The most prominent rate of growth was recorded in March 2023 with an increase of 35% m-o-m. The exports peaked at 14M litres in October 2023, and then contracted in the following month.
In value terms, vermouth exports fell to $28M (IndexBox estimates) in November 2023. Overall, total exports indicated a slight increase from November 2022 to November 2023: its value increased at an average monthly rate of +1.1% over the last twelve-month period. The trend pattern, however, indicated some noticeable fluctuations being recorded throughout the analyzed period. Based on November 2023 figures, exports increased by +37.0% against August 2023 indices. The pace of growth appeared the most rapid in March 2023 with an increase of 36% m-o-m. Over the period under review, the exports attained the peak figure at 32M litres in October 2023, and then shrank in the following month.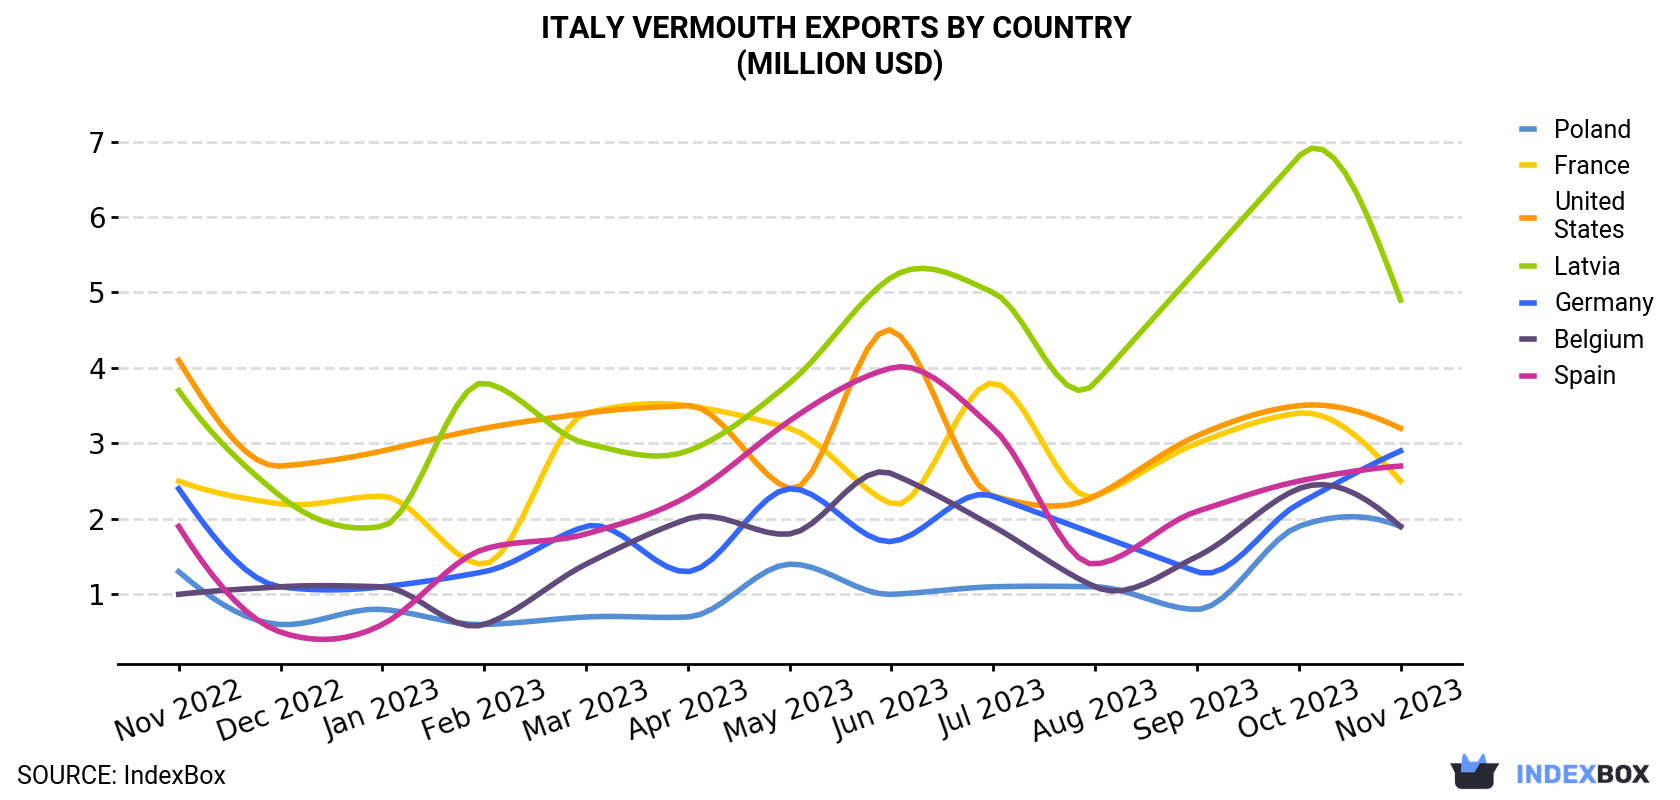
| COUNTRY | Export Value of Vermouth in Italy (million USD) | ||||||||||||
|---|---|---|---|---|---|---|---|---|---|---|---|---|---|
| Nov 2022 | Dec 2022 | Jan 2023 | Feb 2023 | Mar 2023 | Apr 2023 | May 2023 | Jun 2023 | Jul 2023 | Aug 2023 | Sep 2023 | Oct 2023 | Nov 2023 | |
| Latvia | 3.7 | 2.3 | 1.9 | 3.8 | 3.0 | 2.9 | 3.8 | 5.2 | 5.0 | 3.8 | 5.3 | 6.8 | 4.9 |
| United States | 4.1 | 2.7 | 2.9 | 3.2 | 3.4 | 3.5 | 2.4 | 4.5 | 2.3 | 2.3 | 3.1 | 3.5 | 3.2 |
| Germany | 2.4 | 1.1 | 1.1 | 1.3 | 1.9 | 1.3 | 2.4 | 1.7 | 2.3 | 1.8 | 1.3 | 2.2 | 2.9 |
| Spain | 1.9 | 0.5 | 0.6 | 1.6 | 1.8 | 2.3 | 3.3 | 4.0 | 3.2 | 1.4 | 2.1 | 2.5 | 2.7 |
| France | 2.5 | 2.2 | 2.3 | 1.4 | 3.4 | 3.5 | 3.2 | 2.2 | 3.8 | 2.3 | 3.0 | 3.4 | 2.5 |
| Poland | 1.3 | 0.6 | 0.8 | 0.6 | 0.7 | 0.7 | 1.4 | 1.0 | 1.1 | 1.1 | 0.8 | 1.9 | 1.9 |
| Belgium | 1.0 | 1.1 | 1.1 | 0.6 | 1.4 | 2.0 | 1.8 | 2.6 | 1.9 | 1.1 | 1.5 | 2.4 | 1.9 |
| Others | 7.8 | 4.9 | 5.1 | 4.9 | 7.9 | 9.9 | 9.3 | 9.2 | 8.6 | 6.7 | 8.7 | 9.4 | 8.1 |
| Total | 24.7 | 15.2 | 15.9 | 17.3 | 23.5 | 26.2 | 27.8 | 30.3 | 28.3 | 20.6 | 25.8 | 32.3 | 28.2 |
Exports by Country
Latvia (2.4M litres), Germany (2.3M litres) and Spain (1.4M litres) were the main destinations of vermouth exports from Italy, with a combined 49% share of total exports. France, Poland, Belgium and the United States lagged somewhat behind, together comprising a further 28%.
From November 2022 to November 2023, the biggest increases were in Belgium (with a CAGR of +2.7%), while shipments for the other leaders experienced more modest paces of growth.
In value terms, Latvia ($4.9M), the United States ($3.2M) and Germany ($2.9M) were the largest markets for vermouth exported from Italy worldwide, with a combined 39% share of total exports. These countries were followed by Spain, France, Belgium and Poland, which together accounted for a further 32%.
Belgium, with a CAGR of +5.6%, saw the highest growth rate of the value of exports, among the main countries of destination over the period under review, while shipments for the other leaders experienced more modest paces of growth.
Export Prices by Country
In November 2023, the vermouth price amounted to $2.3 per litre (FOB, Italy), declining by -3.3% against the previous month. Over the last twelve-month period, it increased at an average monthly rate of +1.2%. The most prominent rate of growth was recorded in April 2023 an increase of 20% m-o-m. As a result, the export price attained the peak level of $2,698 per thousand litres. From May 2023 to November 2023, the the average export prices failed to regain momentum.
Prices varied noticeably by the country of destination: the country with the highest price was the United States ($6.4 per litre), while the average price for exports to Germany ($1.3 per litre) was amongst the lowest.
From November 2022 to November 2023, the most notable rate of growth in terms of prices was recorded for supplies to France (+3.0%), while the prices for the other major destinations experienced more modest paces of growth.
This report provides an in-depth analysis of the vermouth market in Italy. Within it, you will discover the latest data on market trends and opportunities by country, consumption, production and price developments, as well as the global trade (imports and exports). The forecast exhibits the market prospects through 2030.
Product coverage:
- Prodcom 11041000 - Vermouth and other wine of fresh grapes flavoured with plants or aromatic substances (excluding alcohol duty)
Country coverage:
- Italy
Data coverage:
- Market volume and value
- Per Capita consumption
- Forecast of the market dynamics in the medium term
- Trade (exports and imports) in Italy
- Export and import prices
- Market trends, drivers and restraints
- Key market players and their profiles
Reasons to buy this report:
- Take advantage of the latest data
- Find deeper insights into current market developments
- Discover vital success factors affecting the market
This report is designed for manufacturers, distributors, importers, and wholesalers, as well as for investors, consultants and advisors.
In this report, you can find information that helps you to make informed decisions on the following issues:
- How to diversify your business and benefit from new market opportunities
- How to load your idle production capacity
- How to boost your sales on overseas markets
- How to increase your profit margins
- How to make your supply chain more sustainable
- How to reduce your production and supply chain costs
- How to outsource production to other countries
- How to prepare your business for global expansion
While doing this research, we combine the accumulated expertise of our analysts and the capabilities of artificial intelligence. The AI-based platform, developed by our data scientists, constitutes the key working tool for business analysts, empowering them to discover deep insights and ideas from the marketing data.
-
1. INTRODUCTION
Making Data-Driven Decisions to Grow Your Business
- REPORT DESCRIPTION
- RESEARCH METHODOLOGY AND AI PLATFORM
- DATA-DRIVEN DECISIONS FOR YOUR BUSINESS
- GLOSSARY AND SPECIFIC TERMS
-
2. EXECUTIVE SUMMARY
A Quick Overview of Market Performance
- KEY FINDINGS
- MARKET TRENDS This Chapter is Available Only for the Professional Edition PRO
-
3. MARKET OVERVIEW
Understanding the Current State of The Market and Its Prospects
- MARKET SIZE
- MARKET STRUCTURE
- TRADE BALANCE
- PER CAPITA CONSUMPTION
- MARKET FORECAST TO 2030
-
4. MOST PROMISING PRODUCT
Finding New Products to Diversify Your Business
This Chapter is Available Only for the Professional Edition PRO- TOP PRODUCTS TO DIVERSIFY YOUR BUSINESS
- BEST-SELLING PRODUCTS
- MOST CONSUMED PRODUCT
- MOST TRADED PRODUCT
- MOST PROFITABLE PRODUCT FOR EXPORT
-
5. MOST PROMISING SUPPLYING COUNTRIES
Choosing the Best Countries to Establish Your Sustainable Supply Chain
This Chapter is Available Only for the Professional Edition PRO- TOP COUNTRIES TO SOURCE YOUR PRODUCT
- TOP PRODUCING COUNTRIES
- TOP EXPORTING COUNTRIES
- LOW-COST EXPORTING COUNTRIES
-
6. MOST PROMISING OVERSEAS MARKETS
Choosing the Best Countries to Boost Your Exports
This Chapter is Available Only for the Professional Edition PRO- TOP OVERSEAS MARKETS FOR EXPORTING YOUR PRODUCT
- TOP CONSUMING MARKETS
- UNSATURATED MARKETS
- TOP IMPORTING MARKETS
- MOST PROFITABLE MARKETS
7. PRODUCTION
The Latest Trends and Insights into The Industry
- PRODUCTION VOLUME AND VALUE
8. IMPORTS
The Largest Import Supplying Countries
- IMPORTS FROM 2012–2023
- IMPORTS BY COUNTRY
- IMPORT PRICES BY COUNTRY
9. EXPORTS
The Largest Destinations for Exports
- EXPORTS FROM 2012–2023
- EXPORTS BY COUNTRY
- EXPORT PRICES BY COUNTRY
-
10. PROFILES OF MAJOR PRODUCERS
The Largest Producers on The Market and Their Profiles
This Chapter is Available Only for the Professional Edition PRO -
LIST OF TABLES
- Key Findings In 2023
- Market Volume, In Physical Terms, 2012–2023
- Market Value, 2012–2023
- Per Capita Consumption In 2012-2023
- Imports, In Physical Terms, By Country, 2012–2023
- Imports, In Value Terms, By Country, 2012–2023
- Import Prices, By Country Of Origin, 2012–2023
- Exports, In Physical Terms, By Country, 2012–2023
- Exports, In Value Terms, By Country, 2012–2023
- Export Prices, By Country Of Destination, 2012–2023
-
LIST OF FIGURES
- Market Volume, In Physical Terms, 2012–2023
- Market Value, 2012–2023
- Market Structure – Domestic Supply vs. Imports, In Physical Terms, 2012-2023
- Market Structure – Domestic Supply vs. Imports, In Value Terms, 2012-2023
- Trade Balance, In Physical Terms, 2012-2023
- Trade Balance, In Value Terms, 2012-2023
- Per Capita Consumption, 2012-2023
- Market Volume Forecast to 2030
- Market Value Forecast to 2030
- Products: Market Size And Growth, By Type
- Products: Average Per Capita Consumption, By Type
- Products: Exports And Growth, By Type
- Products: Export Prices And Growth, By Type
- Production Volume And Growth
- Exports And Growth
- Export Prices And Growth
- Market Size And Growth
- Per Capita Consumption
- Imports And Growth
- Import Prices
- Production, In Physical Terms, 2012–2023
- Production, In Value Terms, 2012–2023
- Imports, In Physical Terms, 2012–2023
- Imports, In Value Terms, 2012–2023
- Imports, In Physical Terms, By Country, 2023
- Imports, In Physical Terms, By Country, 2012–2023
- Imports, In Value Terms, By Country, 2012–2023
- Import Prices, By Country Of Origin, 2012–2023
- Exports, In Physical Terms, 2012–2023
- Exports, In Value Terms, 2012–2023
- Exports, In Physical Terms, By Country, 2023
- Exports, In Physical Terms, By Country, 2012–2023
- Exports, In Value Terms, By Country, 2012–2023
- Export Prices, By Country Of Destination, 2012–2023


