Italy - Pumps For Liquids And Liquid Elevators - Market Analysis, Forecast, Size, Trends and Insights
Get instant access to more than 2 million reports, dashboards, and datasets on the IndexBox Platform.
View PricingItaly's Pump for Liquid Export Totals $399M, Showing Modest Growth in July 2023
Italy Pump For Liquid Exports
In July 2023, approximately 19M units of pumps for liquids and liquid elevators were exported from Italy; standing approximately at June 2023. In general, exports, however, continue to indicate a relatively flat trend pattern. The pace of growth was the most pronounced in May 2023 with an increase of 35% m-o-m. Over the period under review, the exports hit record highs at 22M units in March 2023; however, from April 2023 to July 2023, the exports stood at a somewhat lower figure.
In value terms, pump for liquid exports stood at $399M (IndexBox estimates) in July 2023. The total export value increased at an average monthly rate of +1.3% over the period from July 2022 to July 2023; however, the trend pattern indicated some noticeable fluctuations being recorded in certain months. The most prominent rate of growth was recorded in September 2022 with an increase of 22% against the previous month. Over the period under review, the exports reached the maximum at 427M units in March 2023; however, from April 2023 to July 2023, the exports remained at a lower figure.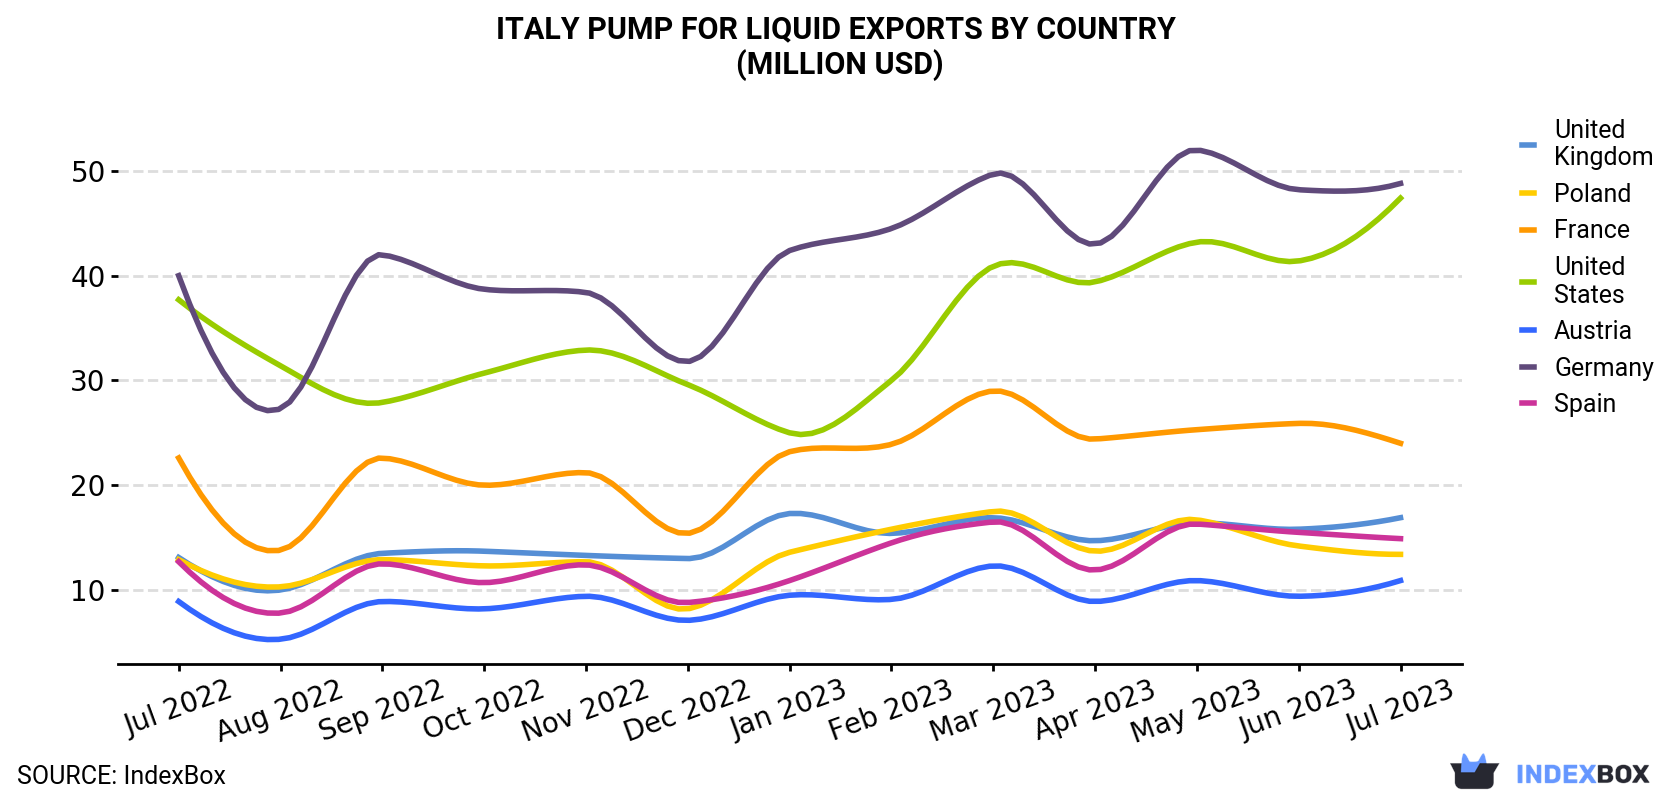
| COUNTRY | Export Value of Pump For Liquid in Italy (million USD) | ||||||||||||
|---|---|---|---|---|---|---|---|---|---|---|---|---|---|
| Jul 2022 | Aug 2022 | Sep 2022 | Oct 2022 | Nov 2022 | Dec 2022 | Jan 2023 | Feb 2023 | Mar 2023 | Apr 2023 | May 2023 | Jun 2023 | Jul 2023 | |
| Germany | 40.0 | 27.3 | 42.0 | 38.7 | 38.4 | 31.8 | 42.4 | 44.5 | 49.7 | 43.0 | 52.0 | 48.2 | 48.8 |
| United States | 37.7 | 31.4 | 27.9 | 30.7 | 32.9 | 29.6 | 25.0 | 30.0 | 40.9 | 39.4 | 43.2 | 41.4 | 47.4 |
| France | 22.6 | 13.8 | 22.6 | 20.0 | 21.2 | 15.4 | 23.2 | 23.9 | 29.0 | 24.4 | 25.3 | 25.9 | 24.0 |
| United Kingdom | 13.1 | 10.0 | 13.5 | 13.7 | 13.3 | 13.0 | 17.3 | 15.4 | 16.9 | 14.7 | 16.4 | 15.8 | 16.9 |
| Spain | 12.7 | 7.8 | 12.5 | 10.7 | 12.4 | 8.8 | 10.9 | 14.5 | 16.5 | 11.9 | 16.3 | 15.5 | 14.9 |
| Poland | 12.9 | 10.3 | 12.9 | 12.3 | 12.7 | 8.2 | 13.6 | 15.8 | 17.5 | 13.7 | 16.7 | 14.2 | 13.4 |
| Austria | 8.9 | 5.3 | 8.9 | 8.2 | 9.4 | 7.1 | 9.5 | 9.1 | 12.3 | 8.9 | 10.9 | 9.4 | 10.9 |
| Others | 193 | 144 | 164 | 172 | 197 | 203 | 167 | 201 | 244 | 189 | 224 | 214 | 222 |
| Total | 341 | 250 | 304 | 307 | 337 | 317 | 309 | 355 | 427 | 345 | 405 | 385 | 399 |
Exports by Country
Germany (2.5M units), Austria (1.9M units) and Poland (1.8M units) were the main destinations of pump for liquid exports from Italy, together comprising 33% of total exports.
From July 2022 to July 2023, the biggest increases were in Austria (with a CAGR of +6.1%), while shipments for the other leaders experienced more modest paces of growth.
In value terms, the largest markets for pump for liquid exported from Italy were Germany ($49M), the United States ($47M) and France ($24M), with a combined 30% share of total exports. These countries were followed by the UK, Spain, Poland and Austria, which together accounted for a further 14%.
Among the main countries of destination, the UK, with a CAGR of +2.1%, saw the highest rates of growth with regard to the value of exports, over the period under review, while shipments for the other leaders experienced more modest paces of growth.
Exports by Type
Fuel, lubricating or cooling-medium pumps for internal combustion engines (6.5M units), positive displacement pumps and hand pumps (5.1M units) and pumps and liquid elevators; n.e.s. in heading no. 8413 (3.6M units) were the main products of pump for liquid exports from Italy, with a combined 80% share of total exports. These products were followed by pumps for liquids, hydraulic pumps (axial and radial piston) and other reciprocating positive displacement pumps , hydraulic pumps (gear or vane) and other rotary positive displacement pumps , petrol and oil dispensing pumps, pumps for dispensing liquids, liquid elevators and concrete pumps, which together accounted for a further 20%.
From July 2022 to July 2023, the most notable rate of growth in terms of shipments, amongst the major product types, was attained by oil dispensing pump (with a CAGR of +16.0%), while the other products experienced more modest paces of growth.
In value terms, pumps for liquids ($129M), fuel, lubricating or cooling-medium pumps for internal combustion engines ($81M) and hydraulic pumps (axial and radial piston) and other reciprocating positive displacement pumps ($66M) appeared to be the most exported types of pumps for liquids and liquid elevators from Italy worldwide, with a combined 69% share of total exports. These products were followed by pumps and liquid elevators; n.e.s. in heading no. 8413, hydraulic pumps (gear or vane) and other rotary positive displacement pumps , pumps for dispensing liquids, petrol and oil dispensing pumps, concrete pumps, positive displacement pumps and hand pumps and liquid elevators, which together accounted for a further 31%.
Fuel or lubricating pump, with a CAGR of +3.8%, recorded the highest growth rate of the value of exports, in terms of the main product categories over the period under review, while shipments for the other products experienced more modest paces of growth.
Export Prices by Country
In July 2023, the pump for liquid price stood at $21.1 per unit (FOB, Italy), picking up by 2.9% against the previous month. Over the period from July 2022 to July 2023, it increased at an average monthly rate of +2.0%. The most prominent rate of growth was recorded in April 2023 when the average export price increased by 13% m-o-m. As a result, the export price attained the peak level of $21,622 per thousand units. From May 2023 to July 2023, the the average export prices remained at a lower figure.
There were significant differences in the average prices for the major overseas markets. In July 2023, the country with the highest price was China ($47.3 per unit), while the average price for exports to Austria ($5.7 per unit) was amongst the lowest.
From July 2022 to July 2023, the most notable rate of growth in terms of prices was recorded for supplies to the UK (+3.2%), while the prices for the other major destinations experienced more modest paces of growth.
This report provides an in-depth analysis of the pump for liquid market in Italy. Within it, you will discover the latest data on market trends and opportunities by country, consumption, production and price developments, as well as the global trade (imports and exports). The forecast exhibits the market prospects through 2030.
Product coverage:
- Prodcom 28121320 - Hydraulic pumps (radial piston)
- Prodcom 28121350 - Hydraulic pumps (gear)
- Prodcom 28121380 - Hydraulic pumps (vane)
- Prodcom 28121530 - Hydraulic pumps (axial piston)
- Prodcom 28121580 - Hydraulic pumps (excluding axial, radial, gear, vane)
- Prodcom 28131105 - Petrol and oil dispensing pumps, unit
- Prodcom 28131125 - Pumps for dispensing liquids, fitted or designed to be fitted with a measuring device (excluding for fuel or lubricants)
- Prodcom 28131145 - Positive displacement pumps, hand pumps
- Prodcom 28131165 - Fuel, lubricating or cooling-medium pumps for internal combustion engines
- Prodcom 28131185 - Concrete pumps
- Prodcom 28131220 - Positive displacement reciprocating pumps, dosing and proportioning
- Prodcom 28131250 - In-line reciprocating piston pumps
- Prodcom 28131280 - Positive displacement reciprocating pumps, diaphragm
- Prodcom 28131320 - Positive displacement pumps, rotary, gear
- Prodcom 28131340 - Positive displacement pumps, rotary, vane
- Prodcom 28131360 - Positive displacement pumps, rotary, screw
- Prodcom 28131380 - Positive displacement pumps, rotary (including peristaltic, r otary lobe and helical rotor pumps) (excluding hydraulic units, gear pumps, vane pumps, screw pumps)
- Prodcom 28131413 - Submersible motor, single-stage rotodynamic drainage and sewage pumps
- Prodcom 28131415 - Submersible motor, multi-stage rotodynamic pumps
- Prodcom 28131417 - Glandless impeller pumps for heating systems and warm water supply
- Prodcom 28131420 - Rotodynamic pumps . .15 mm discharge
- Prodcom 28131430 - Centrifugal pumps with a discharge outlet diameter > .15 mm, c hannel impeller pumps, side channel pumps, peripheral pumps and regenerative pumps
- Prodcom 28131451 - Centrifugal pumps with a discharge outlet diameter > .15 mm, s ingle-stage with a single entry impeller, close coupled
- Prodcom 28131453 - Centrifugal pumps with a discharge outlet diameter > .15 mm, s ingle stage with a single entry impeller, long coupled
- Prodcom 28131455 - Centrifugal pumps with a discharge outlet diameter > .15 mm, s ingle-stage with double entry impeller
- Prodcom 28131460 - Centrifugal pumps with a discharge outlet diameter > .15 mm, m ulti-stage (including self-priming)
- Prodcom 28131471 - Rotodynamic single-stage mixed flow or axial pumps
- Prodcom 28131475 - Rotodynamic multi-stage mixed flow or axial pumps
- Prodcom 28131480 - Other liquid pumps, liquid elevators
Country coverage:
- Italy
Data coverage:
- Market volume and value
- Per Capita consumption
- Forecast of the market dynamics in the medium term
- Trade (exports and imports) in Italy
- Export and import prices
- Market trends, drivers and restraints
- Key market players and their profiles
Reasons to buy this report:
- Take advantage of the latest data
- Find deeper insights into current market developments
- Discover vital success factors affecting the market
This report is designed for manufacturers, distributors, importers, and wholesalers, as well as for investors, consultants and advisors.
In this report, you can find information that helps you to make informed decisions on the following issues:
- How to diversify your business and benefit from new market opportunities
- How to load your idle production capacity
- How to boost your sales on overseas markets
- How to increase your profit margins
- How to make your supply chain more sustainable
- How to reduce your production and supply chain costs
- How to outsource production to other countries
- How to prepare your business for global expansion
While doing this research, we combine the accumulated expertise of our analysts and the capabilities of artificial intelligence. The AI-based platform, developed by our data scientists, constitutes the key working tool for business analysts, empowering them to discover deep insights and ideas from the marketing data.
-
1. INTRODUCTION
Making Data-Driven Decisions to Grow Your Business
- REPORT DESCRIPTION
- RESEARCH METHODOLOGY AND AI PLATFORM
- DATA-DRIVEN DECISIONS FOR YOUR BUSINESS
- GLOSSARY AND SPECIFIC TERMS
-
2. EXECUTIVE SUMMARY
A Quick Overview of Market Performance
- KEY FINDINGS
- MARKET TRENDS This Chapter is Available Only for the Professional Edition PRO
-
3. MARKET OVERVIEW
Understanding the Current State of The Market and Its Prospects
- MARKET SIZE
- MARKET STRUCTURE
- TRADE BALANCE
- PER CAPITA CONSUMPTION
- MARKET FORECAST TO 2030
-
4. MOST PROMISING PRODUCT
Finding New Products to Diversify Your Business
This Chapter is Available Only for the Professional Edition PRO- TOP PRODUCTS TO DIVERSIFY YOUR BUSINESS
- BEST-SELLING PRODUCTS
- MOST CONSUMED PRODUCT
- MOST TRADED PRODUCT
- MOST PROFITABLE PRODUCT FOR EXPORT
-
5. MOST PROMISING SUPPLYING COUNTRIES
Choosing the Best Countries to Establish Your Sustainable Supply Chain
This Chapter is Available Only for the Professional Edition PRO- TOP COUNTRIES TO SOURCE YOUR PRODUCT
- TOP PRODUCING COUNTRIES
- TOP EXPORTING COUNTRIES
- LOW-COST EXPORTING COUNTRIES
-
6. MOST PROMISING OVERSEAS MARKETS
Choosing the Best Countries to Boost Your Exports
This Chapter is Available Only for the Professional Edition PRO- TOP OVERSEAS MARKETS FOR EXPORTING YOUR PRODUCT
- TOP CONSUMING MARKETS
- UNSATURATED MARKETS
- TOP IMPORTING MARKETS
- MOST PROFITABLE MARKETS
7. PRODUCTION
The Latest Trends and Insights into The Industry
- PRODUCTION VOLUME AND VALUE
8. IMPORTS
The Largest Import Supplying Countries
- IMPORTS FROM 2012–2023
- IMPORTS BY COUNTRY
- IMPORT PRICES BY COUNTRY
9. EXPORTS
The Largest Destinations for Exports
- EXPORTS FROM 2012–2023
- EXPORTS BY COUNTRY
- EXPORT PRICES BY COUNTRY
-
10. PROFILES OF MAJOR PRODUCERS
The Largest Producers on The Market and Their Profiles
This Chapter is Available Only for the Professional Edition PRO -
LIST OF TABLES
- Key Findings In 2023
- Market Volume, In Physical Terms, 2012–2023
- Market Value, 2012–2023
- Per Capita Consumption In 2012-2023
- Imports, In Physical Terms, By Country, 2012–2023
- Imports, In Value Terms, By Country, 2012–2023
- Import Prices, By Country Of Origin, 2012–2023
- Exports, In Physical Terms, By Country, 2012–2023
- Exports, In Value Terms, By Country, 2012–2023
- Export Prices, By Country Of Destination, 2012–2023
-
LIST OF FIGURES
- Market Volume, In Physical Terms, 2012–2023
- Market Value, 2012–2023
- Market Structure – Domestic Supply vs. Imports, In Physical Terms, 2012-2023
- Market Structure – Domestic Supply vs. Imports, In Value Terms, 2012-2023
- Trade Balance, In Physical Terms, 2012-2023
- Trade Balance, In Value Terms, 2012-2023
- Per Capita Consumption, 2012-2023
- Market Volume Forecast to 2030
- Market Value Forecast to 2030
- Products: Market Size And Growth, By Type
- Products: Average Per Capita Consumption, By Type
- Products: Exports And Growth, By Type
- Products: Export Prices And Growth, By Type
- Production Volume And Growth
- Exports And Growth
- Export Prices And Growth
- Market Size And Growth
- Per Capita Consumption
- Imports And Growth
- Import Prices
- Production, In Physical Terms, 2012–2023
- Production, In Value Terms, 2012–2023
- Imports, In Physical Terms, 2012–2023
- Imports, In Value Terms, 2012–2023
- Imports, In Physical Terms, By Country, 2023
- Imports, In Physical Terms, By Country, 2012–2023
- Imports, In Value Terms, By Country, 2012–2023
- Import Prices, By Country Of Origin, 2012–2023
- Exports, In Physical Terms, 2012–2023
- Exports, In Value Terms, 2012–2023
- Exports, In Physical Terms, By Country, 2023
- Exports, In Physical Terms, By Country, 2012–2023
- Exports, In Value Terms, By Country, 2012–2023
- Export Prices, By Country Of Destination, 2012–2023


