
Italy - Particle Board - Market Analysis, Forecast, Size, Trends and Insights
Get instant access to more than 2 million reports, dashboards, and datasets on the IndexBox Platform.
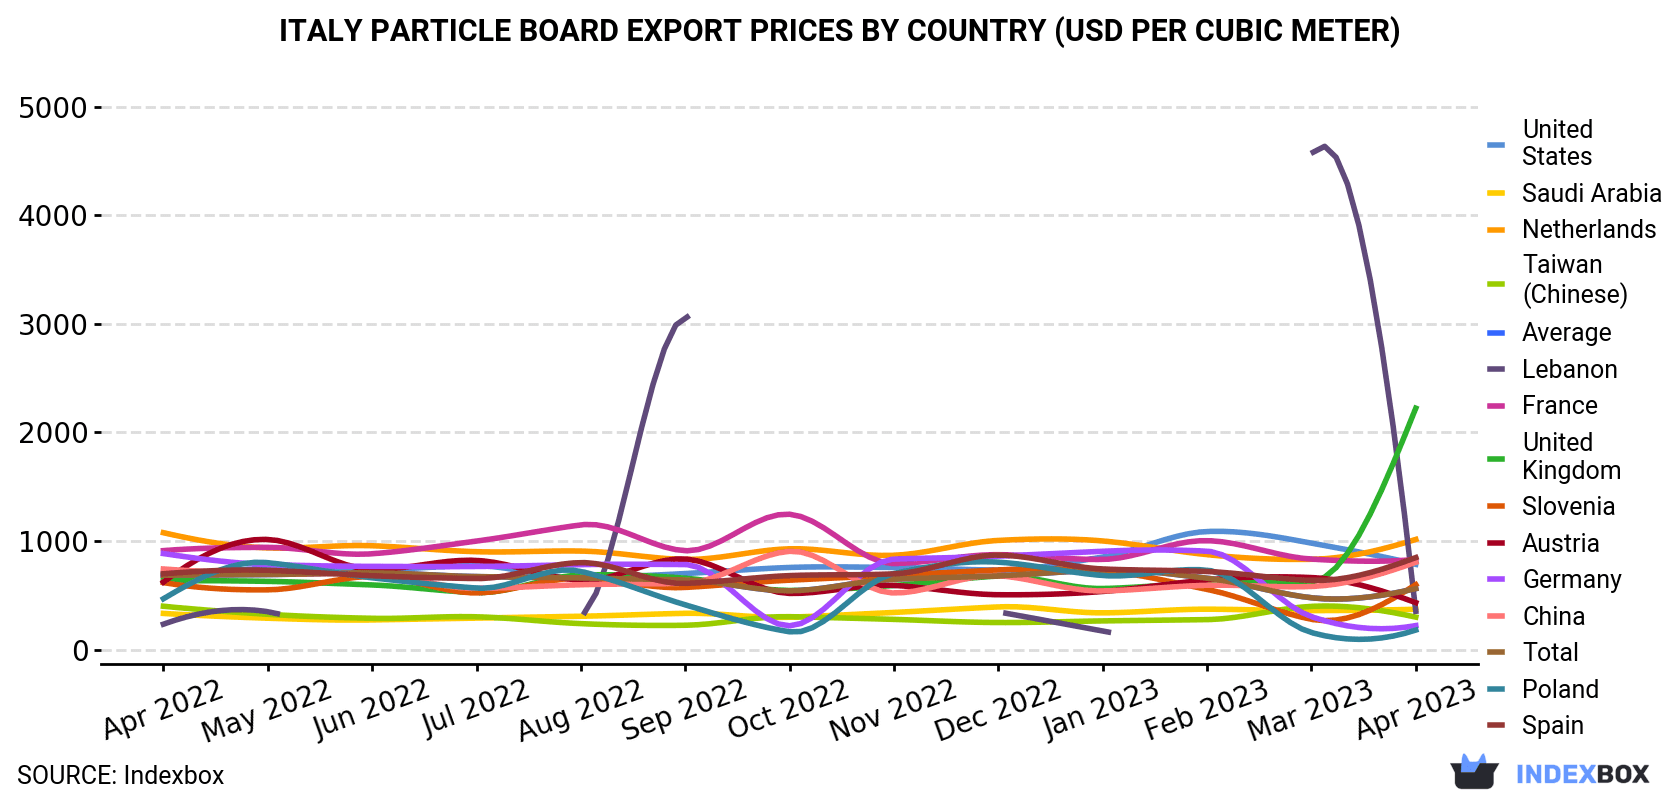
View PricingItalian Particle Board Prices Reach Average of $562 per Cubic Meter, Surging by 18%
Italy Particle Board Export Price in April 2023
In April 2023, the particle board price stood at $562 per cubic meter (FOB, Italy), picking up by 18% against the previous month. In general, the export price, however, recorded a slight slump. The pace of growth appeared the most rapid in November 2022 when the average export price increased by 20% m-o-m. Over the period under review, the average export prices hit record highs at $734 per cubic meter in January 2023; however, from February 2023 to April 2023, the export prices stood at a somewhat lower figure.
Prices varied noticeably by the country of destination: the country with the highest price was the UK ($2,223 per cubic meter), while the average price for exports to Poland ($181 per cubic meter) was amongst the lowest.
From April 2022 to April 2023, the most notable rate of growth in terms of prices was recorded for supplies to the UK (+11.0%), while the prices for the other major destinations experienced more modest paces of growth.
Italy Particle Board Export Prices by Type
Prices varied noticeably by the product type; the product with the highest price was wooden particle board ($2,834 per cubic meter), while the average price for exports of oriented strandboard (OSB) ($498 per cubic meter) was amongst the lowest.
From April 2022 to April 2023, the most notable rate of growth in terms of prices was recorded for the following types: wooden particle board (+3.8%), while the prices for the other products experienced mixed trend patterns.
Italy Particle Board Exports
In April 2023, overseas shipments of particle board decreased by -24.9% to 60K cubic meters for the first time since January 2023, thus ending a two-month rising trend. Over the period under review, exports, however, showed a relatively flat trend pattern. The growth pace was the most rapid in March 2023 with an increase of 68% against the previous month. As a result, the exports reached the peak of 80K cubic meters, and then plummeted in the following month.
In value terms, particle board exports declined to $34M (IndexBox estimates) in April 2023. Overall, exports saw a relatively flat trend pattern. The pace of growth appeared the most rapid in March 2023 when exports increased by 22% month-to-month. Over the period under review, the exports attained the peak figure at 45M cubic meters in May 2022; however, from June 2022 to April 2023, the exports failed to regain momentum.
Italy Particle Board Exports by Type
Waferboards (55K cubic meters) was the largest type of particle board exported from Italy, with a 91% share of total exports. Moreover, waferboards exceeded the volume of the second product type, oriented strandboard (OSB) (2.9K cubic meters), more than tenfold. Particle board and similar board of ligneous materials (excluding wood) (2.2K cubic meters) ranked third in terms of total exports with a 3.6% share.
From April 2022 to April 2023, the average monthly rate of growth in terms of the volume of export of waferboards amounted to +1.0%. With regard to the other exported products, the following average monthly rates of growth were recorded: oriented strandboard (OSB) (-1.2% per month) and particle board and similar board of ligneous materials (excluding wood) (-0.9% per month).
In value terms, waferboards ($29M) remains the largest type of particle board exported from Italy, comprising 87% of total exports. The second position in the ranking was held by particle board and similar board of ligneous materials (excluding wood) ($2.9M), with an 8.5% share of total exports. It was followed by oriented strandboard (OSB), with a 4.3% share.
From April 2022 to April 2023, the average monthly growth rate of the export volume of waferboards was relatively modest. With regard to the other exported products, the following average monthly rates of growth were recorded: particle board and similar board of ligneous materials (excluding wood) (+0.7% per month) and oriented strandboard (OSB) (-2.7% per month).
Italy Particle Board Exports by Country
Germany (12K cubic meters), France (12K cubic meters) and Poland (6.8K cubic meters) were the main destinations of particle board exports from Italy, together accounting for 52% of total exports.
From April 2022 to April 2023, the most notable rate of growth in terms of shipments, amongst the main countries of destination, was attained by Germany (with a CAGR of +13.2%), while the other leaders experienced more modest paces of growth.
In value terms, France ($9.9M) remains the key foreign market for particle board exports from Italy, comprising 29% of total exports. The second position in the ranking was taken by Germany ($2.8M), with an 8.2% share of total exports. It was followed by the UK, with a 7.2% share.
From April 2022 to April 2023, the average monthly rate of growth in terms of value to France was relatively modest. Exports to the other major destinations recorded the following average monthly rates of exports growth: Germany (+0.8% per month) and the UK (+10.4% per month).
This report provides an in-depth analysis of the particle board market in Italy. Within it, you will discover the latest data on market trends and opportunities by country, consumption, production and price developments, as well as the global trade (imports and exports). The forecast exhibits the market prospects through 2030.
Product coverage:
- FCL 1697 - Particle board
- FCL 1606 - OSB
Country coverage:
- Italy
Data coverage:
- Market volume and value
- Per Capita consumption
- Forecast of the market dynamics in the medium term
- Trade (exports and imports) in Italy
- Export and import prices
- Market trends, drivers and restraints
- Key market players and their profiles
Reasons to buy this report:
- Take advantage of the latest data
- Find deeper insights into current market developments
- Discover vital success factors affecting the market
This report is designed for manufacturers, distributors, importers, and wholesalers, as well as for investors, consultants and advisors.
In this report, you can find information that helps you to make informed decisions on the following issues:
- How to diversify your business and benefit from new market opportunities
- How to load your idle production capacity
- How to boost your sales on overseas markets
- How to increase your profit margins
- How to make your supply chain more sustainable
- How to reduce your production and supply chain costs
- How to outsource production to other countries
- How to prepare your business for global expansion
While doing this research, we combine the accumulated expertise of our analysts and the capabilities of artificial intelligence. The AI-based platform, developed by our data scientists, constitutes the key working tool for business analysts, empowering them to discover deep insights and ideas from the marketing data.
-
1. INTRODUCTION
Making Data-Driven Decisions to Grow Your Business
- REPORT DESCRIPTION
- RESEARCH METHODOLOGY AND AI PLATFORM
- DATA-DRIVEN DECISIONS FOR YOUR BUSINESS
- GLOSSARY AND SPECIFIC TERMS
-
2. EXECUTIVE SUMMARY
A Quick Overview of Market Performance
- KEY FINDINGS
- MARKET TRENDS This Chapter is Available Only for the Professional Edition PRO
-
3. MARKET OVERVIEW
Understanding the Current State of The Market and Its Prospects
- MARKET SIZE
- MARKET STRUCTURE
- TRADE BALANCE
- PER CAPITA CONSUMPTION
- MARKET FORECAST TO 2030
-
4. MOST PROMISING PRODUCT
Finding New Products to Diversify Your Business
This Chapter is Available Only for the Professional Edition PRO- TOP PRODUCTS TO DIVERSIFY YOUR BUSINESS
- BEST-SELLING PRODUCTS
- MOST CONSUMED PRODUCT
- MOST TRADED PRODUCT
- MOST PROFITABLE PRODUCT FOR EXPORT
-
5. MOST PROMISING SUPPLYING COUNTRIES
Choosing the Best Countries to Establish Your Sustainable Supply Chain
This Chapter is Available Only for the Professional Edition PRO- TOP COUNTRIES TO SOURCE YOUR PRODUCT
- TOP PRODUCING COUNTRIES
- TOP EXPORTING COUNTRIES
- LOW-COST EXPORTING COUNTRIES
-
6. MOST PROMISING OVERSEAS MARKETS
Choosing the Best Countries to Boost Your Exports
This Chapter is Available Only for the Professional Edition PRO- TOP OVERSEAS MARKETS FOR EXPORTING YOUR PRODUCT
- TOP CONSUMING MARKETS
- UNSATURATED MARKETS
- TOP IMPORTING MARKETS
- MOST PROFITABLE MARKETS
7. PRODUCTION
The Latest Trends and Insights into The Industry
- PRODUCTION VOLUME AND VALUE
8. IMPORTS
The Largest Import Supplying Countries
- IMPORTS FROM 2012–2023
- IMPORTS BY COUNTRY
- IMPORT PRICES BY COUNTRY
9. EXPORTS
The Largest Destinations for Exports
- EXPORTS FROM 2012–2023
- EXPORTS BY COUNTRY
- EXPORT PRICES BY COUNTRY
-
10. PROFILES OF MAJOR PRODUCERS
The Largest Producers on The Market and Their Profiles
This Chapter is Available Only for the Professional Edition PRO -
LIST OF TABLES
- Key Findings In 2023
- Market Volume, In Physical Terms, 2012–2023
- Market Value, 2012–2023
- Per Capita Consumption In 2012-2023
- Imports, In Physical Terms, By Country, 2012–2023
- Imports, In Value Terms, By Country, 2012–2023
- Import Prices, By Country Of Origin, 2012–2023
- Exports, In Physical Terms, By Country, 2012–2023
- Exports, In Value Terms, By Country, 2012–2023
- Export Prices, By Country Of Destination, 2012–2023
-
LIST OF FIGURES
- Market Volume, In Physical Terms, 2012–2023
- Market Value, 2012–2023
- Market Structure – Domestic Supply vs. Imports, In Physical Terms, 2012-2023
- Market Structure – Domestic Supply vs. Imports, In Value Terms, 2012-2023
- Trade Balance, In Physical Terms, 2012-2023
- Trade Balance, In Value Terms, 2012-2023
- Per Capita Consumption, 2012-2023
- Market Volume Forecast to 2030
- Market Value Forecast to 2030
- Products: Market Size And Growth, By Type
- Products: Average Per Capita Consumption, By Type
- Products: Exports And Growth, By Type
- Products: Export Prices And Growth, By Type
- Production Volume And Growth
- Exports And Growth
- Export Prices And Growth
- Market Size And Growth
- Per Capita Consumption
- Imports And Growth
- Import Prices
- Production, In Physical Terms, 2012–2023
- Production, In Value Terms, 2012–2023
- Imports, In Physical Terms, 2012–2023
- Imports, In Value Terms, 2012–2023
- Imports, In Physical Terms, By Country, 2023
- Imports, In Physical Terms, By Country, 2012–2023
- Imports, In Value Terms, By Country, 2012–2023
- Import Prices, By Country Of Origin, 2012–2023
- Exports, In Physical Terms, 2012–2023
- Exports, In Value Terms, 2012–2023
- Exports, In Physical Terms, By Country, 2023
- Exports, In Physical Terms, By Country, 2012–2023
- Exports, In Value Terms, By Country, 2012–2023
- Export Prices, By Country Of Destination, 2012–2023


