
Italy - Machinery For Packing Or Wrapping - Market Analysis, Forecast, Size, Trends And Insights
Get instant access to more than 2 million reports, dashboards, and datasets on the IndexBox Platform.
View PricingItaly Sees Remarkable Increase in Packing Export Machinery Reaching $3.3B in 2023
Italy Machinery For Packing Exports
In 2023, the amount of machinery for packing or wrapping exported from Italy reached 370K units, increasing by 6.3% against 2022. In general, exports posted a resilient increase. The pace of growth appeared the most rapid in 2018 with an increase of 27%. The exports peaked in 2023 and are expected to retain growth in the immediate term.
In value terms, machinery for packing exports surged to $3.3B (IndexBox estimates) in 2023. The total export value increased at an average annual rate of +2.0% from 2013 to 2023; however, the trend pattern remained relatively stable, with somewhat noticeable fluctuations being observed throughout the analyzed period. As a result, the exports reached the peak and are likely to continue growth in the immediate term.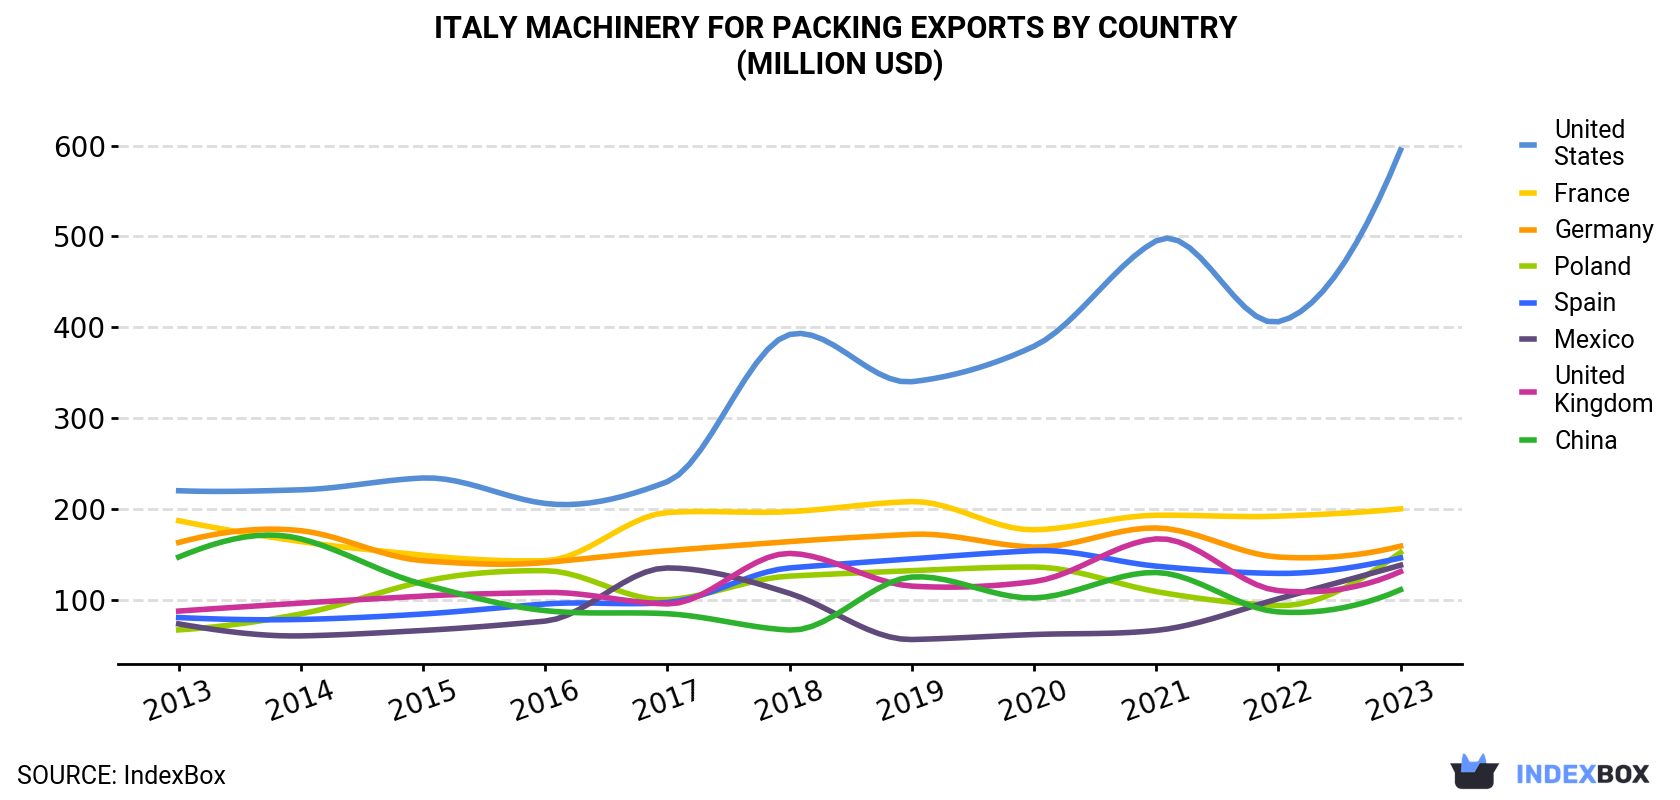
| COUNTRY | Export Value of Machinery For Packing in Italy (million USD) | ||||||||||
|---|---|---|---|---|---|---|---|---|---|---|---|
| 2013 | 2014 | 2015 | 2016 | 2017 | 2018 | 2019 | 2020 | 2021 | 2022 | 2023 | |
| United States | 220 | 221 | 234 | 206 | 230 | 392 | 340 | 379 | 495 | 406 | 595 |
| France | 187 | 164 | 149 | 143 | 196 | 197 | 208 | 177 | 193 | 192 | 200 |
| Germany | 163 | 176 | 143 | 141 | 154 | 164 | 172 | 158 | 179 | 147 | 159 |
| Poland | 66.8 | 84.4 | 120 | 132 | 100 | 126 | 132 | 136 | 109 | 93.7 | 152 |
| Spain | 80.4 | 78.3 | 84.3 | 95.3 | 97.0 | 135 | 145 | 154 | 137 | 129 | 146 |
| Mexico | 73.4 | 60.2 | 66.2 | 76.5 | 135 | 107 | 56.2 | 61.7 | 66.2 | 101 | 138 |
| United Kingdom | 87.5 | 96.3 | 104 | 108 | 95.4 | 151 | 115 | 120 | 167 | 110 | 131 |
| China | 147 | 167 | 117 | 88.0 | 84.6 | 66.6 | 125 | 102 | 130 | 86.6 | 111 |
| Others | 1,700 | 1,813 | 1,463 | 1,430 | 1,514 | 1,692 | 1,487 | 1,428 | 1,462 | 1,259 | 1,679 |
| Total | 2,725 | 2,860 | 2,480 | 2,421 | 2,606 | 3,029 | 2,779 | 2,717 | 2,937 | 2,524 | 3,310 |
Exports by Country
the United States (57K units) was the main destination for machinery for packing exports from Italy, accounting for a 15% share of total exports. Moreover, machinery for packing exports to the United States exceeded the volume sent to the second major destination, France (23K units), twofold. Spain (21K units) ranked third in terms of total exports with a 5.7% share.
From 2013 to 2023, the average annual rate of growth in terms of volume to the United States totaled +14.9%. Exports to the other major destinations recorded the following average annual rates of exports growth: France (+6.2% per year) and Spain (+14.2% per year).
In value terms, the United States ($595M) remains the key foreign market for machinery for packing or wrapping exports from Italy, comprising 18% of total exports. The second position in the ranking was taken by France ($200M), with a 6% share of total exports. It was followed by Germany, with a 4.8% share.
From 2013 to 2023, the average annual growth rate of value to the United States amounted to +10.4%. Exports to the other major destinations recorded the following average annual rates of exports growth: France (+0.7% per year) and Germany (-0.2% per year).
Export Prices by Country
In 2023, the machinery for packing price stood at $8,938 per unit (FOB, Italy), growing by 23% against the previous year. Over the period under review, the export price, however, saw a abrupt descent. The export price peaked at $15,294 per unit in 2013; however, from 2014 to 2023, the export prices remained at a lower figure.
There were significant differences in the average prices for the major export markets. In 2023, amid the top suppliers, the country with the highest price was China ($14,446 per unit), while the average price for exports to Spain ($6,936 per unit) was amongst the lowest.
From 2013 to 2023, the most notable rate of growth in terms of prices was recorded for supplies to China (-0.8%), while the prices for the other major destinations experienced a decline.
This report provides an in-depth analysis of the machinery for packing market in Italy. Within it, you will discover the latest data on market trends and opportunities by country, consumption, production and price developments, as well as the global trade (imports and exports). The forecast exhibits the market prospects through 2030.
Product coverage:
- Prodcom 28292180 - Machinery for packing or wrapping (excluding for filling, c losing, sealing, capsuling or labelling bottles, cans, boxes, b ags or other containers)
Country coverage:
- Italy
Data coverage:
- Market volume and value
- Per Capita consumption
- Forecast of the market dynamics in the medium term
- Trade (exports and imports) in Italy
- Export and import prices
- Market trends, drivers and restraints
- Key market players and their profiles
Reasons to buy this report:
- Take advantage of the latest data
- Find deeper insights into current market developments
- Discover vital success factors affecting the market
This report is designed for manufacturers, distributors, importers, and wholesalers, as well as for investors, consultants and advisors.
In this report, you can find information that helps you to make informed decisions on the following issues:
- How to diversify your business and benefit from new market opportunities
- How to load your idle production capacity
- How to boost your sales on overseas markets
- How to increase your profit margins
- How to make your supply chain more sustainable
- How to reduce your production and supply chain costs
- How to outsource production to other countries
- How to prepare your business for global expansion
While doing this research, we combine the accumulated expertise of our analysts and the capabilities of artificial intelligence. The AI-based platform, developed by our data scientists, constitutes the key working tool for business analysts, empowering them to discover deep insights and ideas from the marketing data.
-
1. INTRODUCTION
Making Data-Driven Decisions to Grow Your Business
- REPORT DESCRIPTION
- RESEARCH METHODOLOGY AND AI PLATFORM
- DATA-DRIVEN DECISIONS FOR YOUR BUSINESS
- GLOSSARY AND SPECIFIC TERMS
-
2. EXECUTIVE SUMMARY
A Quick Overview of Market Performance
- KEY FINDINGS
- MARKET TRENDS This Chapter is Available Only for the Professional Edition PRO
-
3. MARKET OVERVIEW
Understanding the Current State of The Market and Its Prospects
- MARKET SIZE
- MARKET STRUCTURE
- TRADE BALANCE
- PER CAPITA CONSUMPTION
- MARKET FORECAST TO 2030
-
4. MOST PROMISING PRODUCT
Finding New Products to Diversify Your Business
This Chapter is Available Only for the Professional Edition PRO- TOP PRODUCTS TO DIVERSIFY YOUR BUSINESS
- BEST-SELLING PRODUCTS
- MOST CONSUMED PRODUCT
- MOST TRADED PRODUCT
- MOST PROFITABLE PRODUCT FOR EXPORT
-
5. MOST PROMISING SUPPLYING COUNTRIES
Choosing the Best Countries to Establish Your Sustainable Supply Chain
This Chapter is Available Only for the Professional Edition PRO- TOP COUNTRIES TO SOURCE YOUR PRODUCT
- TOP PRODUCING COUNTRIES
- TOP EXPORTING COUNTRIES
- LOW-COST EXPORTING COUNTRIES
-
6. MOST PROMISING OVERSEAS MARKETS
Choosing the Best Countries to Boost Your Exports
This Chapter is Available Only for the Professional Edition PRO- TOP OVERSEAS MARKETS FOR EXPORTING YOUR PRODUCT
- TOP CONSUMING MARKETS
- UNSATURATED MARKETS
- TOP IMPORTING MARKETS
- MOST PROFITABLE MARKETS
7. PRODUCTION
The Latest Trends and Insights into The Industry
- PRODUCTION VOLUME AND VALUE
8. IMPORTS
The Largest Import Supplying Countries
- IMPORTS FROM 2012–2023
- IMPORTS BY COUNTRY
- IMPORT PRICES BY COUNTRY
9. EXPORTS
The Largest Destinations for Exports
- EXPORTS FROM 2012–2023
- EXPORTS BY COUNTRY
- EXPORT PRICES BY COUNTRY
-
10. PROFILES OF MAJOR PRODUCERS
The Largest Producers on The Market and Their Profiles
This Chapter is Available Only for the Professional Edition PRO -
LIST OF TABLES
- Key Findings In 2023
- Market Volume, In Physical Terms, 2012–2023
- Market Value, 2012–2023
- Per Capita Consumption In 2012-2023
- Imports, In Physical Terms, By Country, 2012–2023
- Imports, In Value Terms, By Country, 2012–2023
- Import Prices, By Country Of Origin, 2012–2023
- Exports, In Physical Terms, By Country, 2012–2023
- Exports, In Value Terms, By Country, 2012–2023
- Export Prices, By Country Of Destination, 2012–2023
-
LIST OF FIGURES
- Market Volume, In Physical Terms, 2012–2023
- Market Value, 2012–2023
- Market Structure – Domestic Supply vs. Imports, In Physical Terms, 2012-2023
- Market Structure – Domestic Supply vs. Imports, In Value Terms, 2012-2023
- Trade Balance, In Physical Terms, 2012-2023
- Trade Balance, In Value Terms, 2012-2023
- Per Capita Consumption, 2012-2023
- Market Volume Forecast to 2030
- Market Value Forecast to 2030
- Products: Market Size And Growth, By Type
- Products: Average Per Capita Consumption, By Type
- Products: Exports And Growth, By Type
- Products: Export Prices And Growth, By Type
- Production Volume And Growth
- Exports And Growth
- Export Prices And Growth
- Market Size And Growth
- Per Capita Consumption
- Imports And Growth
- Import Prices
- Production, In Physical Terms, 2012–2023
- Production, In Value Terms, 2012–2023
- Imports, In Physical Terms, 2012–2023
- Imports, In Value Terms, 2012–2023
- Imports, In Physical Terms, By Country, 2023
- Imports, In Physical Terms, By Country, 2012–2023
- Imports, In Value Terms, By Country, 2012–2023
- Import Prices, By Country Of Origin, 2012–2023
- Exports, In Physical Terms, 2012–2023
- Exports, In Value Terms, 2012–2023
- Exports, In Physical Terms, By Country, 2023
- Exports, In Physical Terms, By Country, 2012–2023
- Exports, In Value Terms, By Country, 2012–2023
- Export Prices, By Country Of Destination, 2012–2023


