Italy - Refrigerating And Freezing Equipment And Heat Pumps (Except Household Type Equipment) - Market Analysis, Forecast, Size, Trends and Insights
Get instant access to more than 2 million reports, dashboards, and datasets on the IndexBox Platform.
View PricingItaly's Commercial Refrigeration Equipment Exports Drop to $109M in October 2023
Italy Commercial Refrigeration Equipment Exports
In October 2023, exports of refrigerating and freezing equipment and heat pumps (except household type equipment) from Italy fell significantly to 252K units, dropping by -46.2% against September 2023 figures. Over the period under review, exports saw a deep slump. The pace of growth was the most pronounced in January 2023 with an increase of 27% against the previous month. Over the period under review, the exports reached the maximum at 739K units in November 2022; however, from December 2022 to October 2023, the exports stood at a somewhat lower figure.
In value terms, commercial refrigeration equipment exports fell notably to $109M (IndexBox estimates) in October 2023. In general, exports saw a abrupt decline. The most prominent rate of growth was recorded in March 2023 with an increase of 41% month-to-month. As a result, the exports attained the peak of $299M. From April 2023 to October 2023, the growth of the exports remained at a somewhat lower figure.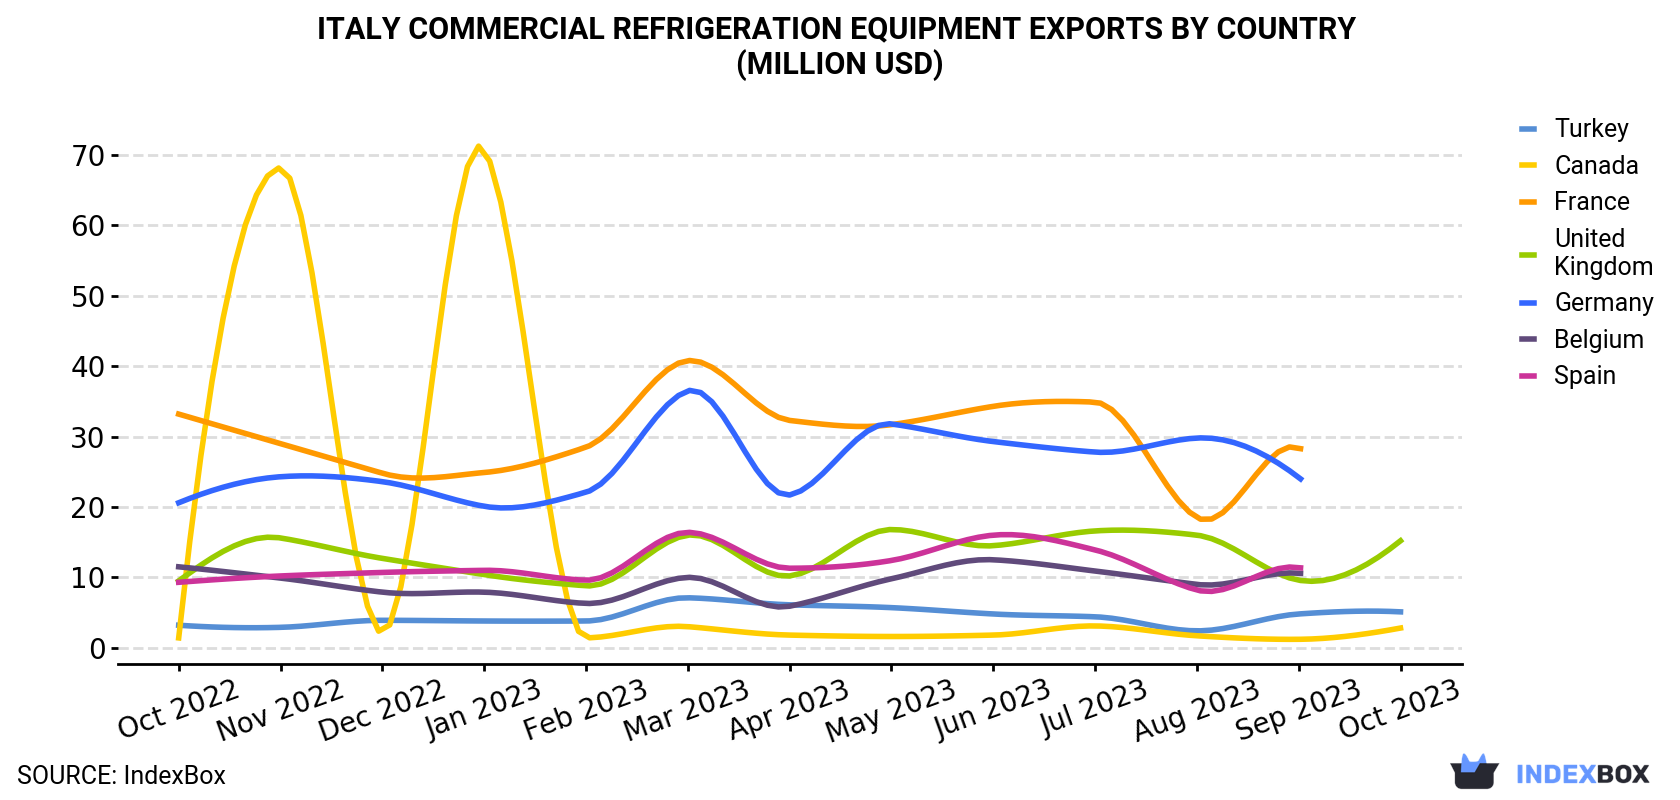
| COUNTRY | Export Value of Commercial Refrigeration Equipment in Italy (million USD) | ||||||||||||
|---|---|---|---|---|---|---|---|---|---|---|---|---|---|
| Oct 2022 | Nov 2022 | Dec 2022 | Jan 2023 | Feb 2023 | Mar 2023 | Apr 2023 | May 2023 | Jun 2023 | Jul 2023 | Aug 2023 | Sep 2023 | Oct 2023 | |
| United Kingdom | 9.5 | 15.6 | 12.7 | 10.4 | 8.8 | 16.0 | 10.2 | 16.8 | 14.5 | 16.6 | 16.0 | 9.6 | 15.2 |
| Turkey | 3.2 | 2.9 | 3.9 | 3.8 | 3.8 | 7.1 | 6.1 | 5.7 | 4.8 | 4.4 | 2.4 | 4.8 | 5.1 |
| Canada | 1.4 | 68.2 | 2.1 | 70.8 | 1.4 | 3.0 | 1.8 | 1.6 | 1.8 | 3.1 | 1.7 | 1.2 | 2.8 |
| France | 33.2 | 29.0 | 24.8 | 24.9 | 28.5 | 40.8 | 32.3 | 31.7 | 34.3 | 34.9 | 18.5 | 28.4 | N/A |
| Germany | 20.6 | 24.3 | 23.6 | 20.1 | 22.1 | 36.5 | 21.7 | 31.8 | 29.3 | 27.8 | 29.8 | 24.2 | N/A |
| Belgium | 11.5 | 9.9 | 7.9 | 7.9 | 6.3 | 10.0 | 5.9 | 9.8 | 12.5 | 10.9 | 9.0 | 10.6 | N/A |
| Spain | 9.3 | 10.2 | 10.7 | 11.0 | 9.6 | 16.4 | 11.3 | 12.4 | 16.0 | 13.9 | 8.2 | 11.4 | N/A |
| Others | 123 | 138 | 123 | 87.9 | 131 | 169 | 129 | 142 | 148 | 132 | 105 | 142 | 85.9 |
| Total | 211 | 298 | 208 | 237 | 212 | 299 | 218 | 252 | 262 | 243 | 190 | 233 | 109 |
Exports by Country
The UK (33K units), Turkey (23K units) and Canada (6.5K units) were the main destinations of commercial refrigeration equipment exports from Italy, with a combined 25% share of total exports.
From October 2022 to October 2023, the most notable rate of growth in terms of shipments, amongst the main countries of destination, was attained by Canada (with a CAGR of +5.2%), while the other leaders experienced more modest paces of growth.
In value terms, the UK ($15M) emerged as the key foreign market for commercial refrigeration equipment exports from Italy, comprising 14% of total exports. The second position in the ranking was taken by Turkey ($5.1M), with a 4.7% share of total exports.
From October 2022 to October 2023, the average monthly growth rate of value to the UK amounted to +4.0%. Exports to the other major destinations recorded the following average monthly rates of exports growth: Turkey (+4.2% per month) and Canada (+6.0% per month).
Exports by Type
Non-furniture refrigerating or freezing equipment (226K units) was the largest type of commercial refrigeration equipment exported from Italy, accounting for a 90% share of total exports. Moreover, non-furniture refrigerating or freezing equipment exceeded the volume of the second product type, refrigerating or freezing display counters, cabinets, show-cases (24K units), ninefold.
From October 2022 to October 2023, the average monthly growth rate of the volume of export of non-furniture refrigerating or freezing equipment amounted to -5.3%. With regard to the other exported products, the following average monthly rates of growth were recorded: refrigerating or freezing display counters, cabinets, show-cases (-15.1% per month) and heat pumps other than air conditioning machines (-12.5% per month).
In value terms, non-furniture refrigerating or freezing equipment ($63M), refrigerating or freezing display counters, cabinets, show-cases ($35M) and heat pumps other than air conditioning machines ($11M) were the most exported types of refrigerating and freezing equipment and heat pumps (except household type equipment) from Italy worldwide.
Non-furniture refrigerating or freezing equipment, with a CAGR of -2.5%, recorded the highest rates of growth with regard to the value of exports, among the main product categories over the period under review, while shipments for the other products experienced a decline.
Export Prices by Country
In October 2023, the commercial refrigeration equipment price stood at $432 per unit (FOB, Italy), dropping by -12.9% against the previous month. Over the last twelve-month period, it increased at an average monthly rate of +2.0%. The most prominent rate of growth was recorded in November 2022 when the average export price increased by 18% m-o-m. Over the period under review, the average export prices attained the maximum at $591 per unit in July 2023; however, from August 2023 to October 2023, the export prices remained at a lower figure.
Prices varied noticeably by the country of destination: the country with the highest price was Switzerland ($1,138 per unit), while the average price for exports to Egypt ($124 per unit) was amongst the lowest.
From October 2022 to October 2023, the most notable rate of growth in terms of prices was recorded for supplies to Brazil (+3.4%), while the prices for the other major destinations experienced more modest paces of growth.
This report provides an in-depth analysis of the commercial refrigeration equipment market in Italy. Within it, you will discover the latest data on market trends and opportunities by country, consumption, production and price developments, as well as the global trade (imports and exports). The forecast exhibits the market prospects through 2030.
Product coverage:
- Prodcom 28251333 - Refrigerated show-cases and counters incorporating a refrigerating unit or evaporator for frozen food storage
- Prodcom 28251335 - Refrigerated show-cases and counters incorporating a refrigerating unit or evaporator (excluding for frozen food storage)
- Prodcom 28251340 -
- Prodcom 28251350 -
- Prodcom 28251380 - Heat pumps other than air conditioning machines of HS
- Prodcom 28251390 - Other refrigerating or freezing equipment
Country coverage:
- Italy
Data coverage:
- Market volume and value
- Per Capita consumption
- Forecast of the market dynamics in the medium term
- Trade (exports and imports) in Italy
- Export and import prices
- Market trends, drivers and restraints
- Key market players and their profiles
Reasons to buy this report:
- Take advantage of the latest data
- Find deeper insights into current market developments
- Discover vital success factors affecting the market
This report is designed for manufacturers, distributors, importers, and wholesalers, as well as for investors, consultants and advisors.
In this report, you can find information that helps you to make informed decisions on the following issues:
- How to diversify your business and benefit from new market opportunities
- How to load your idle production capacity
- How to boost your sales on overseas markets
- How to increase your profit margins
- How to make your supply chain more sustainable
- How to reduce your production and supply chain costs
- How to outsource production to other countries
- How to prepare your business for global expansion
While doing this research, we combine the accumulated expertise of our analysts and the capabilities of artificial intelligence. The AI-based platform, developed by our data scientists, constitutes the key working tool for business analysts, empowering them to discover deep insights and ideas from the marketing data.
-
1. INTRODUCTION
Making Data-Driven Decisions to Grow Your Business
- REPORT DESCRIPTION
- RESEARCH METHODOLOGY AND AI PLATFORM
- DATA-DRIVEN DECISIONS FOR YOUR BUSINESS
- GLOSSARY AND SPECIFIC TERMS
-
2. EXECUTIVE SUMMARY
A Quick Overview of Market Performance
- KEY FINDINGS
- MARKET TRENDS This Chapter is Available Only for the Professional Edition PRO
-
3. MARKET OVERVIEW
Understanding the Current State of The Market and Its Prospects
- MARKET SIZE
- MARKET STRUCTURE
- TRADE BALANCE
- PER CAPITA CONSUMPTION
- MARKET FORECAST TO 2030
-
4. MOST PROMISING PRODUCT
Finding New Products to Diversify Your Business
This Chapter is Available Only for the Professional Edition PRO- TOP PRODUCTS TO DIVERSIFY YOUR BUSINESS
- BEST-SELLING PRODUCTS
- MOST CONSUMED PRODUCT
- MOST TRADED PRODUCT
- MOST PROFITABLE PRODUCT FOR EXPORT
-
5. MOST PROMISING SUPPLYING COUNTRIES
Choosing the Best Countries to Establish Your Sustainable Supply Chain
This Chapter is Available Only for the Professional Edition PRO- TOP COUNTRIES TO SOURCE YOUR PRODUCT
- TOP PRODUCING COUNTRIES
- TOP EXPORTING COUNTRIES
- LOW-COST EXPORTING COUNTRIES
-
6. MOST PROMISING OVERSEAS MARKETS
Choosing the Best Countries to Boost Your Exports
This Chapter is Available Only for the Professional Edition PRO- TOP OVERSEAS MARKETS FOR EXPORTING YOUR PRODUCT
- TOP CONSUMING MARKETS
- UNSATURATED MARKETS
- TOP IMPORTING MARKETS
- MOST PROFITABLE MARKETS
7. PRODUCTION
The Latest Trends and Insights into The Industry
- PRODUCTION VOLUME AND VALUE
8. IMPORTS
The Largest Import Supplying Countries
- IMPORTS FROM 2012–2023
- IMPORTS BY COUNTRY
- IMPORT PRICES BY COUNTRY
9. EXPORTS
The Largest Destinations for Exports
- EXPORTS FROM 2012–2023
- EXPORTS BY COUNTRY
- EXPORT PRICES BY COUNTRY
-
10. PROFILES OF MAJOR PRODUCERS
The Largest Producers on The Market and Their Profiles
This Chapter is Available Only for the Professional Edition PRO -
LIST OF TABLES
- Key Findings In 2023
- Market Volume, In Physical Terms, 2012–2023
- Market Value, 2012–2023
- Per Capita Consumption In 2012-2023
- Imports, In Physical Terms, By Country, 2012–2023
- Imports, In Value Terms, By Country, 2012–2023
- Import Prices, By Country Of Origin, 2012–2023
- Exports, In Physical Terms, By Country, 2012–2023
- Exports, In Value Terms, By Country, 2012–2023
- Export Prices, By Country Of Destination, 2012–2023
-
LIST OF FIGURES
- Market Volume, In Physical Terms, 2012–2023
- Market Value, 2012–2023
- Market Structure – Domestic Supply vs. Imports, In Physical Terms, 2012-2023
- Market Structure – Domestic Supply vs. Imports, In Value Terms, 2012-2023
- Trade Balance, In Physical Terms, 2012-2023
- Trade Balance, In Value Terms, 2012-2023
- Per Capita Consumption, 2012-2023
- Market Volume Forecast to 2030
- Market Value Forecast to 2030
- Products: Market Size And Growth, By Type
- Products: Average Per Capita Consumption, By Type
- Products: Exports And Growth, By Type
- Products: Export Prices And Growth, By Type
- Production Volume And Growth
- Exports And Growth
- Export Prices And Growth
- Market Size And Growth
- Per Capita Consumption
- Imports And Growth
- Import Prices
- Production, In Physical Terms, 2012–2023
- Production, In Value Terms, 2012–2023
- Imports, In Physical Terms, 2012–2023
- Imports, In Value Terms, 2012–2023
- Imports, In Physical Terms, By Country, 2023
- Imports, In Physical Terms, By Country, 2012–2023
- Imports, In Value Terms, By Country, 2012–2023
- Import Prices, By Country Of Origin, 2012–2023
- Exports, In Physical Terms, 2012–2023
- Exports, In Value Terms, 2012–2023
- Exports, In Physical Terms, By Country, 2023
- Exports, In Physical Terms, By Country, 2012–2023
- Exports, In Value Terms, By Country, 2012–2023
- Export Prices, By Country Of Destination, 2012–2023


