
India - Crude Petroleum Oil - Market Analysis, Forecast, Size, Trends And Insights
Get instant access to more than 2 million reports, dashboards, and datasets on the IndexBox Platform.
View PricingIndia's July 2023 Import of Crude Oil Sees Significant Drop to $9B
India Crude Oil Imports
In July 2023, approximately 17M tons of crude petroleum oil were imported into India; waning by -11.8% on the previous month's figure. In general, imports continue to indicate a slight slump. The pace of growth was the most pronounced in December 2022 with an increase of 33% m-o-m. As a result, imports attained the peak of 26M tons. From January 2023 to July 2023, the growth of imports remained at a lower figure.
In value terms, crude oil imports fell to $9B (IndexBox estimates) in July 2023. Over the period under review, imports recorded a pronounced downturn. The growth pace was the most rapid in December 2022 when imports increased by 13% m-o-m.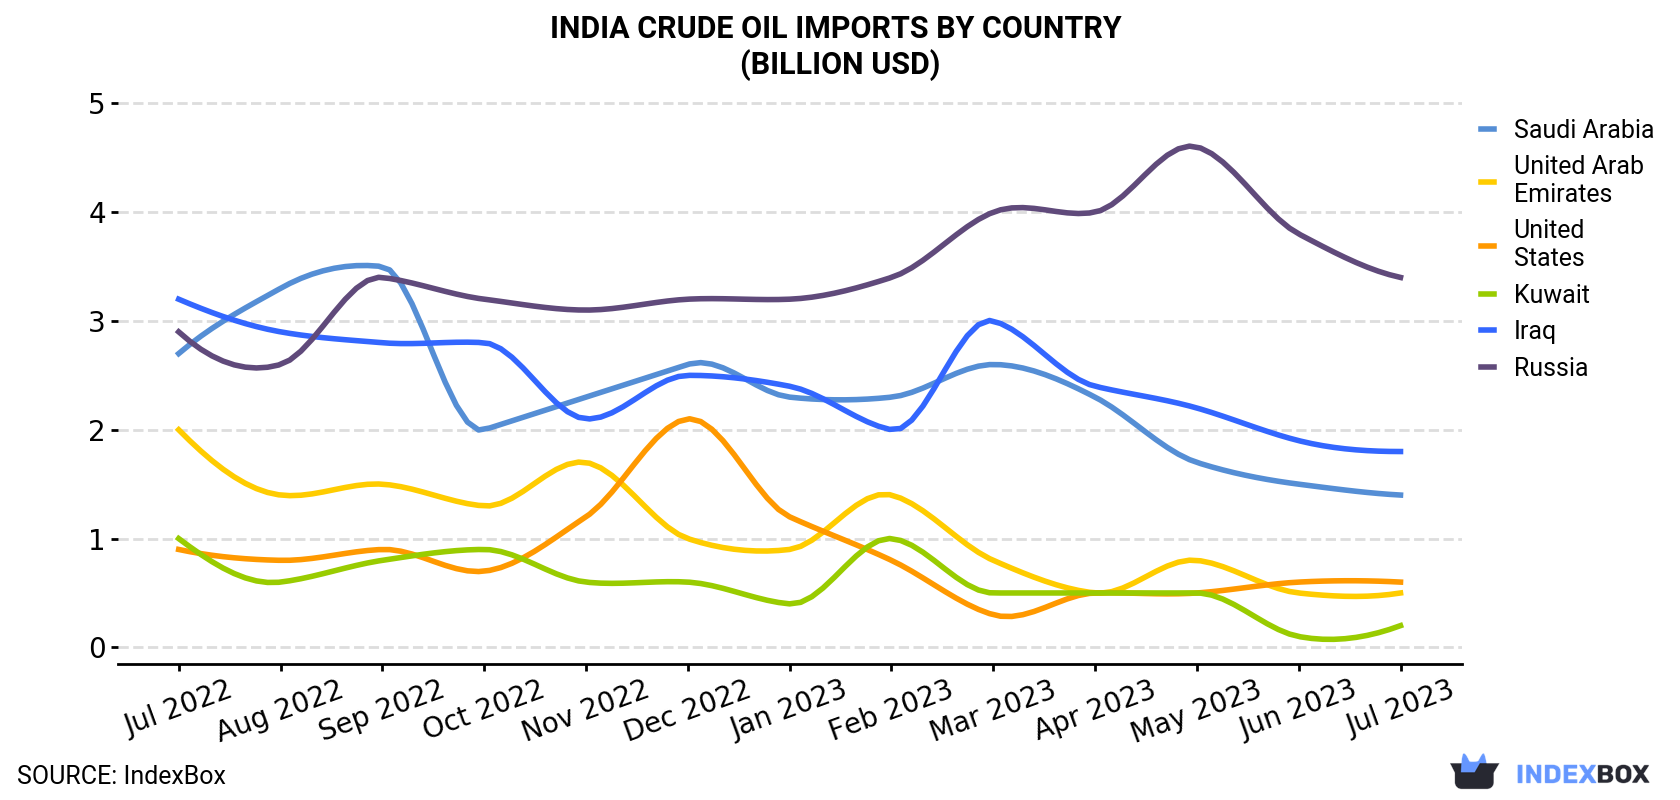
| COUNTRY | Import Value of Crude Oil in India (billion USD) | ||||||||||||
|---|---|---|---|---|---|---|---|---|---|---|---|---|---|
| Jul 2022 | Aug 2022 | Sep 2022 | Oct 2022 | Nov 2022 | Dec 2022 | Jan 2023 | Feb 2023 | Mar 2023 | Apr 2023 | May 2023 | Jun 2023 | Jul 2023 | |
| Russia | 2.9 | 2.6 | 3.4 | 3.2 | 3.1 | 3.2 | 3.2 | 3.4 | 4.0 | 4.0 | 4.6 | 3.8 | 3.4 |
| Iraq | 3.2 | 2.9 | 2.8 | 2.8 | 2.1 | 2.5 | 2.4 | 2.0 | 3.0 | 2.4 | 2.2 | 1.9 | 1.8 |
| Saudi Arabia | 2.7 | 3.3 | 3.5 | 2.0 | 2.3 | 2.6 | 2.3 | 2.3 | 2.6 | 2.3 | 1.7 | 1.5 | 1.4 |
| United States | 0.9 | 0.8 | 0.9 | 0.7 | 1.2 | 2.1 | 1.2 | 0.8 | 0.3 | 0.5 | 0.5 | 0.6 | 0.6 |
| United Arab Emirates | 2.0 | 1.4 | 1.5 | 1.3 | 1.7 | 1.0 | 0.9 | 1.4 | 0.8 | 0.5 | 0.8 | 0.5 | 0.5 |
| Kuwait | 1.0 | 0.6 | 0.8 | 0.9 | 0.6 | 0.6 | 0.4 | 1.0 | 0.5 | 0.5 | 0.5 | 0.1 | 0.2 |
| Others | 3.5 | 3.1 | 2.1 | 3.0 | 2.5 | 3.3 | 1.7 | 2.4 | 2.4 | 1.8 | 1.9 | 1.7 | 1.2 |
| Total | 16.1 | 14.8 | 14.9 | 13.9 | 13.6 | 15.3 | 12.1 | 13.3 | 13.6 | 12.1 | 12.1 | 10.0 | 9.0 |
Imports by Country
In July 2023, Russia (6.8M tons) constituted the largest crude oil supplier to India, with a 41% share of total imports. Moreover, crude oil imports from Russia exceeded the figures recorded by the second-largest supplier, Iraq (3.3M tons), twofold. The third position in this ranking was held by Saudi Arabia (2.4M tons), with a 14% share.
From July 2022 to July 2023, the average monthly rate of growth in terms of volume from Russia stood at +4.7%. The remaining supplying countries recorded the following average monthly rates of imports growth: Iraq (-1.9% per month) and Saudi Arabia (-2.5% per month).
In value terms, Russia ($3.4B), Iraq ($1.8B) and Saudi Arabia ($1.4B) appeared to be the largest crude oil suppliers to India, with a combined 73% share of total imports.
Russia, with a CAGR of +1.3%, recorded the highest rates of growth with regard to the value of imports, in terms of the main suppliers over the period under review, while purchases for the other leaders experienced a decline.
Import Prices by Country
In July 2023, the crude oil price amounted to $537 per ton (CIF, India), approximately reflecting the previous month. In general, the import price, however, recorded a perceptible decline. The most prominent rate of growth was recorded in November 2022 when the average import price increased by 2.6% m-o-m. The import price peaked at $808 per ton in July 2022; however, from August 2022 to July 2023, import prices failed to regain momentum.
Average prices varied somewhat amongst the major supplying countries. In July 2023, the highest price was recorded for prices from the United Arab Emirates ($644 per ton) and the United States ($636 per ton), while the price for Colombia ($482 per ton) and South Korea ($496 per ton) were amongst the lowest.
From July 2022 to July 2023, the most notable rate of growth in terms of prices was attained by the United Arab Emirates (-2.2%), while the prices for the other major suppliers experienced a decline.
This report provides an in-depth analysis of the crude oil market in India. Within it, you will discover the latest data on market trends and opportunities by country, consumption, production and price developments, as well as the global trade (imports and exports). The forecast exhibits the market prospects through 2030.
Product coverage:
Country coverage:
- India
Data coverage:
- Market volume and value
- Per Capita consumption
- Forecast of the market dynamics in the medium term
- Trade (exports and imports) in India
- Export and import prices
- Market trends, drivers and restraints
- Key market players and their profiles
Reasons to buy this report:
- Take advantage of the latest data
- Find deeper insights into current market developments
- Discover vital success factors affecting the market
This report is designed for manufacturers, distributors, importers, and wholesalers, as well as for investors, consultants and advisors.
In this report, you can find information that helps you to make informed decisions on the following issues:
- How to diversify your business and benefit from new market opportunities
- How to load your idle production capacity
- How to boost your sales on overseas markets
- How to increase your profit margins
- How to make your supply chain more sustainable
- How to reduce your production and supply chain costs
- How to outsource production to other countries
- How to prepare your business for global expansion
While doing this research, we combine the accumulated expertise of our analysts and the capabilities of artificial intelligence. The AI-based platform, developed by our data scientists, constitutes the key working tool for business analysts, empowering them to discover deep insights and ideas from the marketing data.
-
1. INTRODUCTION
Making Data-Driven Decisions to Grow Your Business
- REPORT DESCRIPTION
- RESEARCH METHODOLOGY AND AI PLATFORM
- DATA-DRIVEN DECISIONS FOR YOUR BUSINESS
- GLOSSARY AND SPECIFIC TERMS
-
2. EXECUTIVE SUMMARY
A Quick Overview of Market Performance
- KEY FINDINGS
- MARKET TRENDS This Chapter is Available Only for the Professional Edition PRO
-
3. MARKET OVERVIEW
Understanding the Current State of The Market and Its Prospects
- MARKET SIZE
- MARKET STRUCTURE
- TRADE BALANCE
- PER CAPITA CONSUMPTION
- MARKET FORECAST TO 2030
-
4. MOST PROMISING PRODUCT
Finding New Products to Diversify Your Business
This Chapter is Available Only for the Professional Edition PRO- TOP PRODUCTS TO DIVERSIFY YOUR BUSINESS
- BEST-SELLING PRODUCTS
- MOST CONSUMED PRODUCT
- MOST TRADED PRODUCT
- MOST PROFITABLE PRODUCT FOR EXPORT
-
5. MOST PROMISING SUPPLYING COUNTRIES
Choosing the Best Countries to Establish Your Sustainable Supply Chain
This Chapter is Available Only for the Professional Edition PRO- TOP COUNTRIES TO SOURCE YOUR PRODUCT
- TOP PRODUCING COUNTRIES
- TOP EXPORTING COUNTRIES
- LOW-COST EXPORTING COUNTRIES
-
6. MOST PROMISING OVERSEAS MARKETS
Choosing the Best Countries to Boost Your Exports
This Chapter is Available Only for the Professional Edition PRO- TOP OVERSEAS MARKETS FOR EXPORTING YOUR PRODUCT
- TOP CONSUMING MARKETS
- UNSATURATED MARKETS
- TOP IMPORTING MARKETS
- MOST PROFITABLE MARKETS
7. PRODUCTION
The Latest Trends and Insights into The Industry
- PRODUCTION VOLUME AND VALUE
8. IMPORTS
The Largest Import Supplying Countries
- IMPORTS FROM 2012–2023
- IMPORTS BY COUNTRY
- IMPORT PRICES BY COUNTRY
9. EXPORTS
The Largest Destinations for Exports
- EXPORTS FROM 2012–2023
- EXPORTS BY COUNTRY
- EXPORT PRICES BY COUNTRY
-
10. PROFILES OF MAJOR PRODUCERS
The Largest Producers on The Market and Their Profiles
This Chapter is Available Only for the Professional Edition PRO -
LIST OF TABLES
- Key Findings In 2023
- Market Volume, In Physical Terms, 2012–2023
- Market Value, 2012–2023
- Per Capita Consumption In 2012-2023
- Imports, In Physical Terms, By Country, 2012–2023
- Imports, In Value Terms, By Country, 2012–2023
- Import Prices, By Country Of Origin, 2012–2023
- Exports, In Physical Terms, By Country, 2012–2023
- Exports, In Value Terms, By Country, 2012–2023
- Export Prices, By Country Of Destination, 2012–2023
-
LIST OF FIGURES
- Market Volume, In Physical Terms, 2012–2023
- Market Value, 2012–2023
- Market Structure – Domestic Supply vs. Imports, In Physical Terms, 2012-2023
- Market Structure – Domestic Supply vs. Imports, In Value Terms, 2012-2023
- Trade Balance, In Physical Terms, 2012-2023
- Trade Balance, In Value Terms, 2012-2023
- Per Capita Consumption, 2012-2023
- Market Volume Forecast to 2030
- Market Value Forecast to 2030
- Products: Market Size And Growth, By Type
- Products: Average Per Capita Consumption, By Type
- Products: Exports And Growth, By Type
- Products: Export Prices And Growth, By Type
- Production Volume And Growth
- Exports And Growth
- Export Prices And Growth
- Market Size And Growth
- Per Capita Consumption
- Imports And Growth
- Import Prices
- Production, In Physical Terms, 2012–2023
- Production, In Value Terms, 2012–2023
- Imports, In Physical Terms, 2012–2023
- Imports, In Value Terms, 2012–2023
- Imports, In Physical Terms, By Country, 2023
- Imports, In Physical Terms, By Country, 2012–2023
- Imports, In Value Terms, By Country, 2012–2023
- Import Prices, By Country Of Origin, 2012–2023
- Exports, In Physical Terms, 2012–2023
- Exports, In Value Terms, 2012–2023
- Exports, In Physical Terms, By Country, 2023
- Exports, In Physical Terms, By Country, 2012–2023
- Exports, In Value Terms, By Country, 2012–2023
- Export Prices, By Country Of Destination, 2012–2023


