
Hong Kong SAR, China - Padlocks, Locks And Keys Of Base Metal - Market Analysis, Forecast, Size, Trends and Insights
Get instant access to more than 2 million reports, dashboards, and datasets on the IndexBox Platform.
View PricingImport of Locks and Keys Soars to $18M in June 2023 in Hong Kong
Hong Kong Lock And Key Imports
In June 2023, the amount of padlocks, locks and keys of base metal imported into Hong Kong rose remarkably to 3.7K tons, surging by 14% on May 2023. Over the period under review, imports, however, showed a relatively flat trend pattern. The most prominent rate of growth was recorded in December 2022 with an increase of 43% against the previous month. As a result, imports attained the peak of 5.2K tons. From January 2023 to June 2023, the growth of imports remained at a lower figure.
In value terms, lock and key imports expanded markedly to $18M (IndexBox estimates) in June 2023. In general, imports, however, continue to indicate a pronounced reduction. The pace of growth appeared the most rapid in March 2023 with an increase of 23% month-to-month.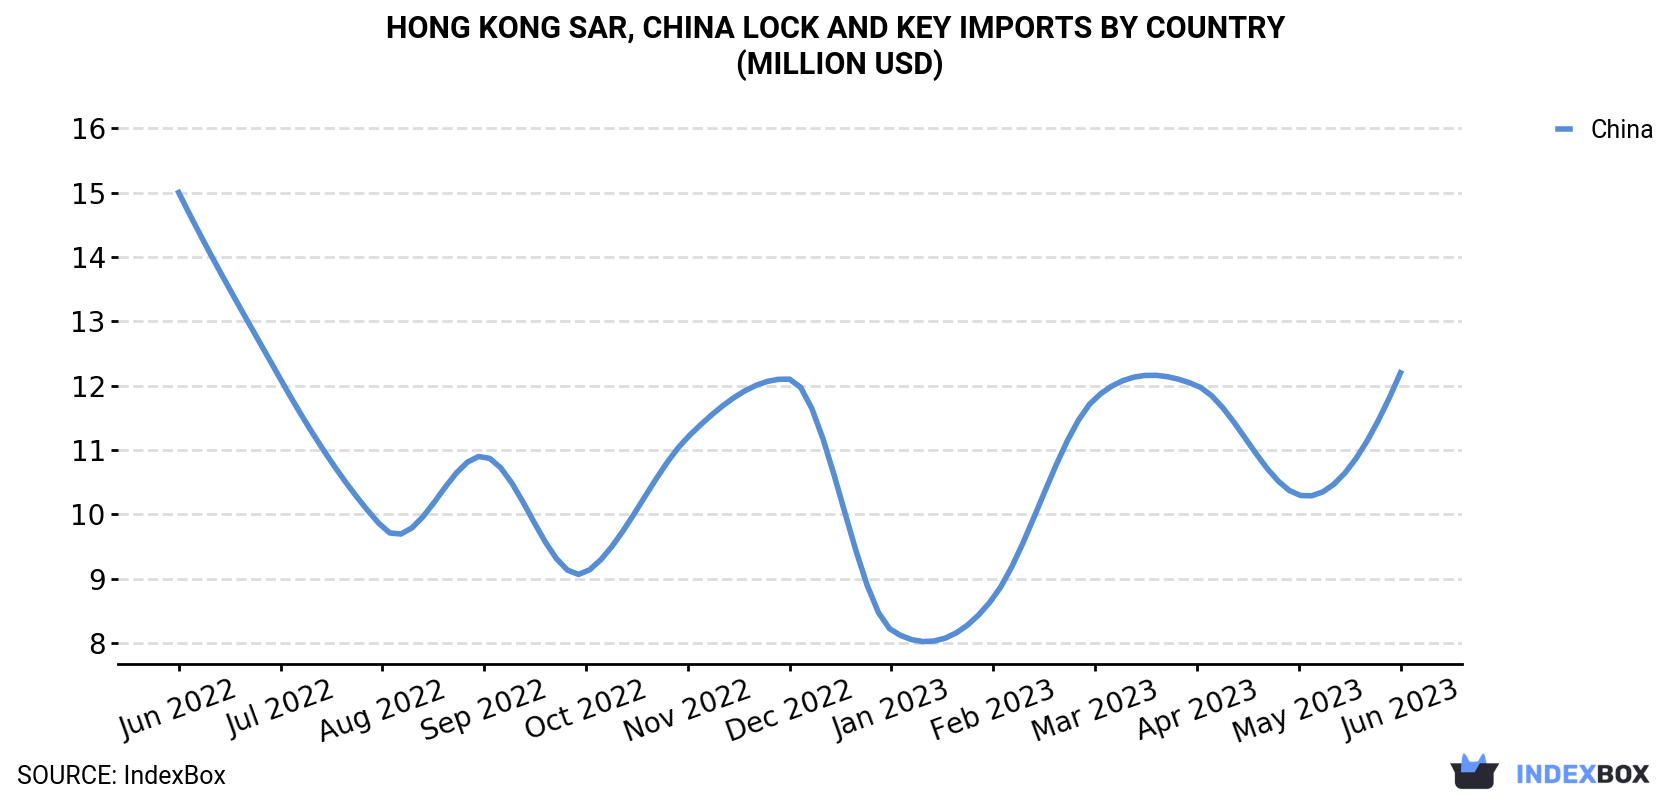
| COUNTRY | Import Value of Lock And Key in Hong Kong (million USD) | ||||||||||||
|---|---|---|---|---|---|---|---|---|---|---|---|---|---|
| Jun 2022 | Jul 2022 | Aug 2022 | Sep 2022 | Oct 2022 | Nov 2022 | Dec 2022 | Jan 2023 | Feb 2023 | Mar 2023 | Apr 2023 | May 2023 | Jun 2023 | |
| China | 15.0 | 12.1 | 9.8 | 10.9 | 9.1 | 11.2 | 12.1 | 8.2 | 8.7 | 11.8 | 12.0 | 10.3 | 12.2 |
| Others | 7.4 | 6.7 | 4.8 | 4.6 | 5.1 | 6.1 | 4.1 | 5.8 | 5.7 | 6.0 | 6.1 | 6.2 | 5.4 |
| Total | 22.5 | 18.8 | 14.6 | 15.5 | 14.2 | 17.4 | 16.2 | 14.0 | 14.4 | 17.7 | 18.1 | 16.6 | 17.6 |
Imports by Country
In June 2023, China (3.5K tons) was the main lock and key supplier to Hong Kong, accounting for a approximately 94% share of total imports.
From June 2022 to June 2023, the average monthly growth rate of volume from China was relatively modest.
In value terms, China ($12M) constituted the largest supplier of lock and key to Hong Kong.
From June 2022 to June 2023, the average monthly rate of growth in terms of value from China amounted to -1.7%.
Imports by Type
In June 2023, base metal mountings, fittings and similar articles for furniture, doors, staircases, windows, trunks, chests etc, castors with mountings of base metal, automatic door closers of base metal (3.2K tons) constituted the largest type of lock and key supplied to Hong Kong, accounting for a 88% share of total imports. Moreover, base metal mountings, fittings and similar articles for furniture, doors, staircases, windows, trunks, chests etc, castors with mountings of base metal, automatic door closers of base metal exceeded the figures recorded for the second-largest type, base metal padlocks (175 tons), more than tenfold. Locks; (other than those for motor vehicles or furniture), (key, combination or electrically operated), of base metal (168 tons) ranked third in terms of total imports with a 4.6% share.
From June 2022 to June 2023, the average monthly growth rate of the volume of import of base metal mountings, fittings and similar articles for furniture, doors, staircases, windows, trunks, chests etc, castors with mountings of base metal, automatic door closers of base metal stood at -1.0%. With regard to the other supplied products, the following average monthly rates of growth were recorded: base metal padlocks (+0.9% per month) and locks; (other than those for motor vehicles or furniture), (key, combination or electrically operated), of base metal (-2.5% per month).
In value terms, base metal mountings, fittings and similar articles for furniture, doors, staircases, windows, trunks, chests etc, castors with mountings of base metal, automatic door closers of base metal ($11M) constituted the largest type of lock and key supplied to Hong Kong, comprising 61% of total imports. The second position in the ranking was held by locks; (other than those for motor vehicles or furniture), (key, combination or electrically operated), of base metal ($3.6M), with a 21% share of total imports. It was followed by base metal padlocks, with a 13% share.
Import Prices by Country
In June 2023, the lock and key price amounted to $4,763 per ton (CIF, Hong Kong), shrinking by -7.2% against the previous month. Overall, the import price continues to indicate a slight shrinkage. The most prominent rate of growth was recorded in January 2023 when the average import price increased by 81% month-to-month. The import price peaked at $6,036 per ton in April 2023; however, from May 2023 to June 2023, import prices failed to regain momentum.
There were significant differences in the average prices amongst the major supplying countries. In June 2023, the country with the highest price was Taiwan (Chinese) ($8,376 per ton), while the price for China totaled $3,533 per ton.
From June 2022 to June 2023, the most notable rate of growth in terms of prices was attained by Taiwan (Chinese) (-1.0%).
This report provides an in-depth analysis of the lock and key market in Hong Kong SAR, China. Within it, you will discover the latest data on market trends and opportunities by country, consumption, production and price developments, as well as the global trade (imports and exports). The forecast exhibits the market prospects through 2030.
Product coverage:
- Prodcom 25721130 - Base metal padlocks
- Prodcom 25721150 - Base metal motor vehicle locks
- Prodcom 25721170 - Base metal furniture locks
- Prodcom 25721230 - Base metal cylinder locks used for doors of buildings
- Prodcom 25721250 - Base metal locks used for doors of buildings (excluding cylinder locks)
- Prodcom 25721270 - Base metal locks (excluding padlocks, motor vehicle locks, f urniture locks and locks used for doors of buildings)
- Prodcom 25721330 - Base metal clasps and frames with clasps, with locks (excluding fasteners and clasps for handbags, brief-cases and executive-cases)
- Prodcom 25721350 - Base metal keys presented separately (including roughly cast, forged or stamped blanks, skeleton keys)
- Prodcom 25721410 - Base metal hinges
- Prodcom 25721420 - Castors with mountings of base metal
- Prodcom 25721430 - Base metal mountings, fittings and similar articles suitable for motor vehicles (excluding hinges, castors, locks and keys)
- Prodcom 25721440 - Base metal mountings, fittings and similar articles suitable for buildings (excluding hinges, castors, locks, keys, spy holes fitted with optical elements and key operated door bolts)
- Prodcom 25721450 - Base metal mountings, fittings and similar articles suitable for furniture (excluding hinges, castors, locks and keys)
- Prodcom 25721460 - Other base metal mountings, fittings and similar articles (excluding for motor vehicles, buildings or furniture)
- Prodcom 25721470 - Base metal automatic door closers
- Prodcom 25721480 - Base metal hat-racks, hat-pegs, brackets, coat racks, towel racks, dish-cloth racks, brush racks and key racks (excluding coat-racks having the character of furniture)
Country coverage:
- Hong Kong SAR
Data coverage:
- Market volume and value
- Per Capita consumption
- Forecast of the market dynamics in the medium term
- Trade (exports and imports) in Hong Kong SAR, China
- Export and import prices
- Market trends, drivers and restraints
- Key market players and their profiles
Reasons to buy this report:
- Take advantage of the latest data
- Find deeper insights into current market developments
- Discover vital success factors affecting the market
This report is designed for manufacturers, distributors, importers, and wholesalers, as well as for investors, consultants and advisors.
In this report, you can find information that helps you to make informed decisions on the following issues:
- How to diversify your business and benefit from new market opportunities
- How to load your idle production capacity
- How to boost your sales on overseas markets
- How to increase your profit margins
- How to make your supply chain more sustainable
- How to reduce your production and supply chain costs
- How to outsource production to other countries
- How to prepare your business for global expansion
While doing this research, we combine the accumulated expertise of our analysts and the capabilities of artificial intelligence. The AI-based platform, developed by our data scientists, constitutes the key working tool for business analysts, empowering them to discover deep insights and ideas from the marketing data.
-
1. INTRODUCTION
Making Data-Driven Decisions to Grow Your Business
- REPORT DESCRIPTION
- RESEARCH METHODOLOGY AND AI PLATFORM
- DATA-DRIVEN DECISIONS FOR YOUR BUSINESS
- GLOSSARY AND SPECIFIC TERMS
-
2. EXECUTIVE SUMMARY
A Quick Overview of Market Performance
- KEY FINDINGS
- MARKET TRENDS This Chapter is Available Only for the Professional Edition PRO
-
3. MARKET OVERVIEW
Understanding the Current State of The Market and Its Prospects
- MARKET SIZE
- MARKET STRUCTURE
- TRADE BALANCE
- PER CAPITA CONSUMPTION
- MARKET FORECAST TO 2030
-
4. MOST PROMISING PRODUCT
Finding New Products to Diversify Your Business
This Chapter is Available Only for the Professional Edition PRO- TOP PRODUCTS TO DIVERSIFY YOUR BUSINESS
- BEST-SELLING PRODUCTS
- MOST CONSUMED PRODUCT
- MOST TRADED PRODUCT
- MOST PROFITABLE PRODUCT FOR EXPORT
-
5. MOST PROMISING SUPPLYING COUNTRIES
Choosing the Best Countries to Establish Your Sustainable Supply Chain
This Chapter is Available Only for the Professional Edition PRO- TOP COUNTRIES TO SOURCE YOUR PRODUCT
- TOP PRODUCING COUNTRIES
- TOP EXPORTING COUNTRIES
- LOW-COST EXPORTING COUNTRIES
-
6. MOST PROMISING OVERSEAS MARKETS
Choosing the Best Countries to Boost Your Exports
This Chapter is Available Only for the Professional Edition PRO- TOP OVERSEAS MARKETS FOR EXPORTING YOUR PRODUCT
- TOP CONSUMING MARKETS
- UNSATURATED MARKETS
- TOP IMPORTING MARKETS
- MOST PROFITABLE MARKETS
7. PRODUCTION
The Latest Trends and Insights into The Industry
- PRODUCTION VOLUME AND VALUE
8. IMPORTS
The Largest Import Supplying Countries
- IMPORTS FROM 2012–2023
- IMPORTS BY COUNTRY
- IMPORT PRICES BY COUNTRY
9. EXPORTS
The Largest Destinations for Exports
- EXPORTS FROM 2012–2023
- EXPORTS BY COUNTRY
- EXPORT PRICES BY COUNTRY
-
10. PROFILES OF MAJOR PRODUCERS
The Largest Producers on The Market and Their Profiles
This Chapter is Available Only for the Professional Edition PRO -
LIST OF TABLES
- Key Findings In 2023
- Market Volume, In Physical Terms, 2012–2023
- Market Value, 2012–2023
- Per Capita Consumption In 2012-2023
- Imports, In Physical Terms, By Country, 2012–2023
- Imports, In Value Terms, By Country, 2012–2023
- Import Prices, By Country Of Origin, 2012–2023
- Exports, In Physical Terms, By Country, 2012–2023
- Exports, In Value Terms, By Country, 2012–2023
- Export Prices, By Country Of Destination, 2012–2023
-
LIST OF FIGURES
- Market Volume, In Physical Terms, 2012–2023
- Market Value, 2012–2023
- Market Structure – Domestic Supply vs. Imports, In Physical Terms, 2012-2023
- Market Structure – Domestic Supply vs. Imports, In Value Terms, 2012-2023
- Trade Balance, In Physical Terms, 2012-2023
- Trade Balance, In Value Terms, 2012-2023
- Per Capita Consumption, 2012-2023
- Market Volume Forecast to 2030
- Market Value Forecast to 2030
- Products: Market Size And Growth, By Type
- Products: Average Per Capita Consumption, By Type
- Products: Exports And Growth, By Type
- Products: Export Prices And Growth, By Type
- Production Volume And Growth
- Exports And Growth
- Export Prices And Growth
- Market Size And Growth
- Per Capita Consumption
- Imports And Growth
- Import Prices
- Production, In Physical Terms, 2012–2023
- Production, In Value Terms, 2012–2023
- Imports, In Physical Terms, 2012–2023
- Imports, In Value Terms, 2012–2023
- Imports, In Physical Terms, By Country, 2023
- Imports, In Physical Terms, By Country, 2012–2023
- Imports, In Value Terms, By Country, 2012–2023
- Import Prices, By Country Of Origin, 2012–2023
- Exports, In Physical Terms, 2012–2023
- Exports, In Value Terms, 2012–2023
- Exports, In Physical Terms, By Country, 2023
- Exports, In Physical Terms, By Country, 2012–2023
- Exports, In Value Terms, By Country, 2012–2023
- Export Prices, By Country Of Destination, 2012–2023


