Hong Kong SAR, China - Electrical Transformers - Market Analysis, Forecast, Size, Trends and Insights
Get instant access to more than 2 million reports, dashboards, and datasets on the IndexBox Platform.
View PricingHong Kongs Exports of Electrical Transformers Plummet to $55M in June 2023
Hong Kong Electrical Transformer Exports
In June 2023, approximately 88M units of electrical transformers were exported from Hong Kong; surging by 2.6% on the month before. In general, exports, however, continue to indicate a relatively flat trend pattern. The most prominent rate of growth was recorded in March 2023 with an increase of 30% m-o-m. Over the period under review, the exports hit record highs at 121M units in July 2022; however, from August 2022 to June 2023, the exports stood at a somewhat lower figure.
In value terms, electrical transformer exports contracted modestly to $55M (IndexBox estimates) in June 2023. Over the period under review, exports, however, recorded a mild descent. The growth pace was the most rapid in March 2023 when exports increased by 23% m-o-m. The exports peaked at 74M units in July 2022; however, from August 2022 to June 2023, the exports stood at a somewhat lower figure. 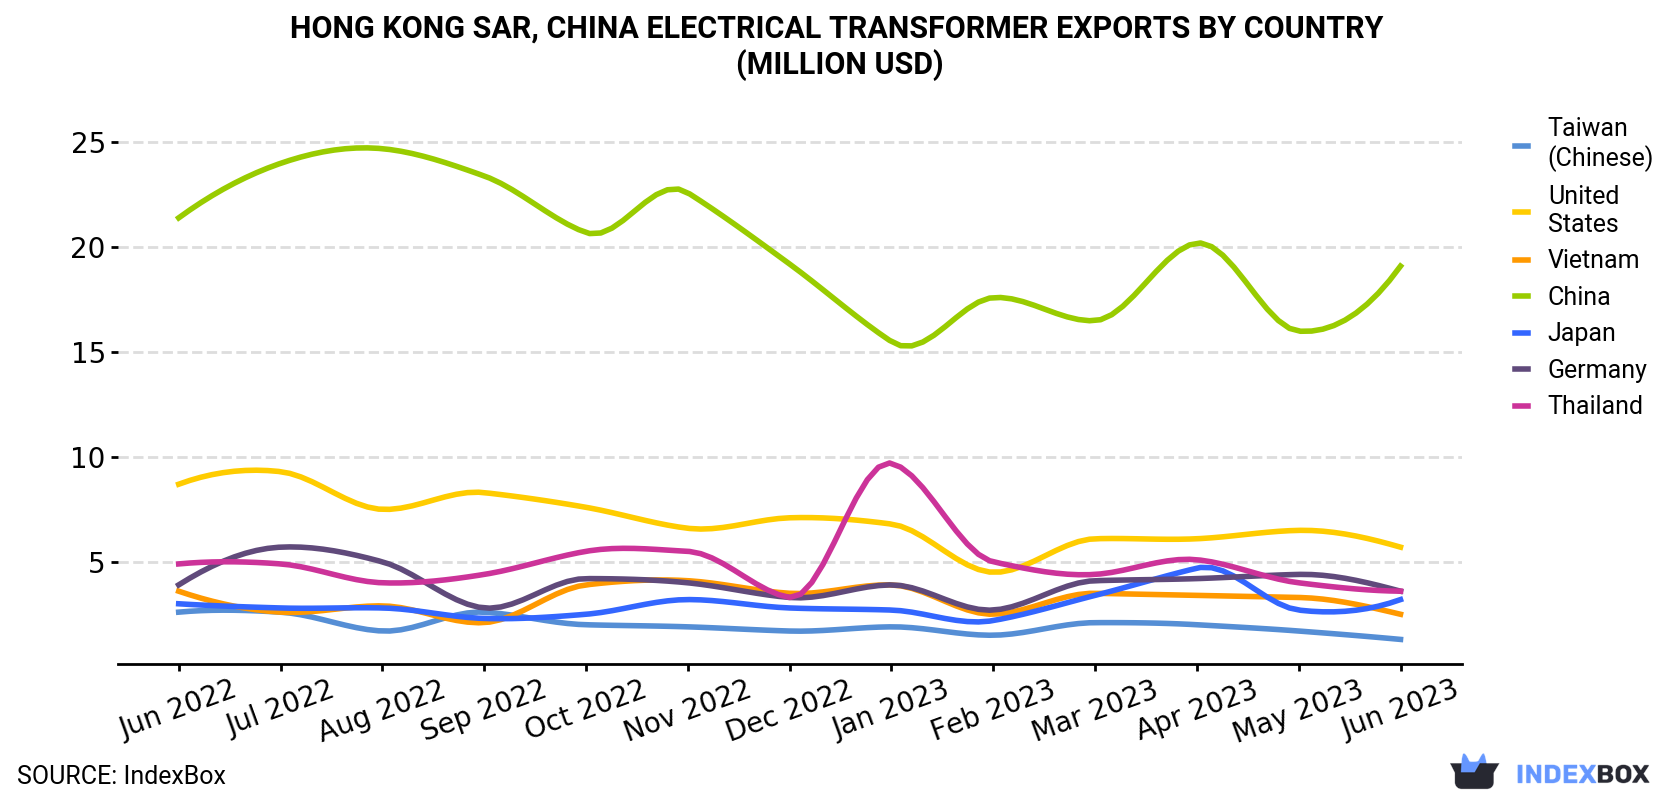
| COUNTRY | Export Value of Electrical Transformer in Hong Kong (million USD) | ||||||||||||
|---|---|---|---|---|---|---|---|---|---|---|---|---|---|
| Jun 2022 | Jul 2022 | Aug 2022 | Sep 2022 | Oct 2022 | Nov 2022 | Dec 2022 | Jan 2023 | Feb 2023 | Mar 2023 | Apr 2023 | May 2023 | Jun 2023 | |
| China | 21.4 | 24.0 | 24.7 | 23.4 | 20.7 | 22.6 | 19.2 | 15.5 | 17.6 | 16.5 | 20.2 | 16.0 | 19.1 |
| United States | 8.7 | 9.3 | 7.5 | 8.3 | 7.6 | 6.6 | 7.1 | 6.8 | 4.5 | 6.1 | 6.1 | 6.5 | 5.7 |
| Germany | 3.9 | 5.7 | 5.0 | 2.8 | 4.2 | 4.0 | 3.3 | 3.9 | 2.7 | 4.1 | 4.2 | 4.4 | 3.6 |
| Thailand | 4.9 | 4.9 | 4.0 | 4.4 | 5.5 | 5.5 | 3.3 | 9.7 | 5.0 | 4.4 | 5.1 | 4.0 | 3.6 |
| Japan | 3.0 | 2.8 | 2.8 | 2.3 | 2.5 | 3.2 | 2.8 | 2.7 | 2.2 | 3.4 | 4.7 | 2.7 | 3.2 |
| Vietnam | 3.6 | 2.6 | 2.9 | 2.1 | 3.9 | 4.1 | 3.5 | 3.9 | 2.5 | 3.5 | 3.4 | 3.3 | 2.5 |
| Taiwan (Chinese) | 2.6 | 2.6 | 1.7 | 2.6 | 2.0 | 1.9 | 1.7 | 1.9 | 1.5 | 2.1 | 2.0 | 1.7 | 1.3 |
| Others | 20.4 | 21.7 | 17.5 | 20.1 | 14.6 | 16.2 | 13.6 | 18.7 | 11.3 | 17.9 | 22.1 | 18.0 | 15.9 |
| Total | 68.5 | 73.6 | 66.2 | 65.9 | 61.0 | 64.3 | 54.4 | 63.0 | 47.1 | 58.0 | 67.8 | 56.7 | 55.0 |
Exports by Country
China (35M units) was the main destination for electrical transformer exports from Hong Kong, with a 39% share of total exports. Moreover, electrical transformer exports to China exceeded the volume sent to the second major destination, the United States (8.9M units), fourfold. Vietnam (8.1M units) ranked third in terms of total exports with a 9.2% share.
From June 2022 to June 2023, the average monthly rate of growth in terms of volume to China was relatively modest. Exports to the other major destinations recorded the following average monthly rates of exports growth: the United States (+1.4% per month) and Vietnam (-0.8% per month).
In value terms, China ($19M) remains the key foreign market for electrical transformer exports from Hong Kong, comprising 35% of total exports. The second position in the ranking was taken by the United States ($5.7M), with a 10% share of total exports. It was followed by Germany, with a 6.5% share.
From June 2022 to June 2023, the average monthly rate of growth in terms of value to China was relatively modest. Exports to the other major destinations recorded the following average monthly rates of exports growth: the United States (-3.4% per month) and Germany (-0.6% per month).
Exports by Type
Electrical transformers with liquid dielectric, of power handling capacity under 1 kVA (87M units) was the largest type of electrical transformer exported from Hong Kong, accounting for a 99% share of total exports. It was followed by electrical transformers with non-liquid dielectric, of power handling capacity from 1 kVA to 16 kVA (543K units), with a 0.6% share of total exports. The third position in this ranking was held by electrical transformers with non-liquid dielectric, of power handling capacity from 16 kVA to 500 kVA (375 units), with less than 0.1% share.
From June 2022 to June 2023, the average monthly rate of growth in terms of the volume of export of electrical transformers with liquid dielectric, of power handling capacity under 1 kVA was relatively modest. With regard to the other exported products, the following average monthly rates of growth were recorded: electrical transformers with non-liquid dielectric, of power handling capacity from 1 kVA to 16 kVA (-0.1% per month) and electrical transformers with non-liquid dielectric, of power handling capacity from 16 kVA to 500 kVA (-10.3% per month).
In value terms, electrical transformers with liquid dielectric, of power handling capacity under 1 kVA ($52M) remains the largest type of electrical transformer exported from Hong Kong, comprising 95% of total exports. The second position in the ranking was taken by electrical transformers with non-liquid dielectric, of power handling capacity from 1 kVA to 16 kVA ($2.2M), with a 4% share of total exports. It was followed by electrical transformers with non-liquid dielectric, of power handling capacity from 16 kVA to 500 kVA, with a 0.6% share.
From June 2022 to June 2023, the average monthly rate of growth in terms of the export volume of electrical transformers with liquid dielectric, of power handling capacity under 1 kVA totaled -2.0%. With regard to the other exported products, the following average monthly rates of growth were recorded: electrical transformers with non-liquid dielectric, of power handling capacity from 1 kVA to 16 kVA (+4.4% per month) and electrical transformers with non-liquid dielectric, of power handling capacity from 16 kVA to 500 kVA (-5.1% per month).
Export Prices by Country
In June 2023, the electrical transformer price stood at $627 per thousand units (FOB, Hong Kong), declining by -5.5% against the previous month. In general, the export price showed a slight reduction. The most prominent rate of growth was recorded in November 2022 an increase of 20% against the previous month. Over the period under review, the average export prices attained the peak figure at $725 per thousand units in June 2022; however, from July 2022 to June 2023, the export prices failed to regain momentum.
There were significant differences in the average prices for the major overseas markets. In June 2023, the country with the highest price was Thailand ($1.2 per unit), while the average price for exports to Vietnam ($304 per thousand units) was amongst the lowest.
From June 2022 to June 2023, the most notable rate of growth in terms of prices was recorded for supplies to Thailand (+1.9%), while the prices for the other major destinations experienced more modest paces of growth.
This report provides an in-depth analysis of the electrical transformer market in Hong Kong SAR, China. Within it, you will discover the latest data on market trends and opportunities by country, consumption, production and price developments, as well as the global trade (imports and exports). The forecast exhibits the market prospects through 2030.
Product coverage:
- Prodcom 27114120 - Liquid dielectric transformers having a power handling capacity . .650 kVA
- Prodcom 27114150 - Liquid dielectric transformers having a power handling capacity > .650 kVA but . .10 .000 kVA
- Prodcom 27114180 - Liquid dielectric transformers having a power handling capacity > .10 .000 kVA
- Prodcom 27114220 - Measuring transformers having a power handling capacity . 1 kVA (including for voltage measurement)
- Prodcom 27114240 - Other transformers, n.e.c., having a power handling capacity. 1 kVA
- Prodcom 27114260 - Other transformers, having a power handling capacity > 1 kVA but . .16 kVA
- Prodcom 27114330 - Transformers, n.e.c., having a power handling capacity > .16 kVA but . .500 kVA
- Prodcom 27114380 - Transformers, n.e.c., having a power handling capacity > .500 kVA
Country coverage:
- Hong Kong SAR
Data coverage:
- Market volume and value
- Per Capita consumption
- Forecast of the market dynamics in the medium term
- Trade (exports and imports) in Hong Kong SAR, China
- Export and import prices
- Market trends, drivers and restraints
- Key market players and their profiles
Reasons to buy this report:
- Take advantage of the latest data
- Find deeper insights into current market developments
- Discover vital success factors affecting the market
This report is designed for manufacturers, distributors, importers, and wholesalers, as well as for investors, consultants and advisors.
In this report, you can find information that helps you to make informed decisions on the following issues:
- How to diversify your business and benefit from new market opportunities
- How to load your idle production capacity
- How to boost your sales on overseas markets
- How to increase your profit margins
- How to make your supply chain more sustainable
- How to reduce your production and supply chain costs
- How to outsource production to other countries
- How to prepare your business for global expansion
While doing this research, we combine the accumulated expertise of our analysts and the capabilities of artificial intelligence. The AI-based platform, developed by our data scientists, constitutes the key working tool for business analysts, empowering them to discover deep insights and ideas from the marketing data.
-
1. INTRODUCTION
Making Data-Driven Decisions to Grow Your Business
- REPORT DESCRIPTION
- RESEARCH METHODOLOGY AND AI PLATFORM
- DATA-DRIVEN DECISIONS FOR YOUR BUSINESS
- GLOSSARY AND SPECIFIC TERMS
-
2. EXECUTIVE SUMMARY
A Quick Overview of Market Performance
- KEY FINDINGS
- MARKET TRENDS This Chapter is Available Only for the Professional Edition PRO
-
3. MARKET OVERVIEW
Understanding the Current State of The Market and Its Prospects
- MARKET SIZE
- MARKET STRUCTURE
- TRADE BALANCE
- PER CAPITA CONSUMPTION
- MARKET FORECAST TO 2030
-
4. MOST PROMISING PRODUCT
Finding New Products to Diversify Your Business
This Chapter is Available Only for the Professional Edition PRO- TOP PRODUCTS TO DIVERSIFY YOUR BUSINESS
- BEST-SELLING PRODUCTS
- MOST CONSUMED PRODUCT
- MOST TRADED PRODUCT
- MOST PROFITABLE PRODUCT FOR EXPORT
-
5. MOST PROMISING SUPPLYING COUNTRIES
Choosing the Best Countries to Establish Your Sustainable Supply Chain
This Chapter is Available Only for the Professional Edition PRO- TOP COUNTRIES TO SOURCE YOUR PRODUCT
- TOP PRODUCING COUNTRIES
- TOP EXPORTING COUNTRIES
- LOW-COST EXPORTING COUNTRIES
-
6. MOST PROMISING OVERSEAS MARKETS
Choosing the Best Countries to Boost Your Exports
This Chapter is Available Only for the Professional Edition PRO- TOP OVERSEAS MARKETS FOR EXPORTING YOUR PRODUCT
- TOP CONSUMING MARKETS
- UNSATURATED MARKETS
- TOP IMPORTING MARKETS
- MOST PROFITABLE MARKETS
7. PRODUCTION
The Latest Trends and Insights into The Industry
- PRODUCTION VOLUME AND VALUE
8. IMPORTS
The Largest Import Supplying Countries
- IMPORTS FROM 2012–2023
- IMPORTS BY COUNTRY
- IMPORT PRICES BY COUNTRY
9. EXPORTS
The Largest Destinations for Exports
- EXPORTS FROM 2012–2023
- EXPORTS BY COUNTRY
- EXPORT PRICES BY COUNTRY
-
10. PROFILES OF MAJOR PRODUCERS
The Largest Producers on The Market and Their Profiles
This Chapter is Available Only for the Professional Edition PRO -
LIST OF TABLES
- Key Findings In 2023
- Market Volume, In Physical Terms, 2012–2023
- Market Value, 2012–2023
- Per Capita Consumption In 2012-2023
- Imports, In Physical Terms, By Country, 2012–2023
- Imports, In Value Terms, By Country, 2012–2023
- Import Prices, By Country Of Origin, 2012–2023
- Exports, In Physical Terms, By Country, 2012–2023
- Exports, In Value Terms, By Country, 2012–2023
- Export Prices, By Country Of Destination, 2012–2023
-
LIST OF FIGURES
- Market Volume, In Physical Terms, 2012–2023
- Market Value, 2012–2023
- Market Structure – Domestic Supply vs. Imports, In Physical Terms, 2012-2023
- Market Structure – Domestic Supply vs. Imports, In Value Terms, 2012-2023
- Trade Balance, In Physical Terms, 2012-2023
- Trade Balance, In Value Terms, 2012-2023
- Per Capita Consumption, 2012-2023
- Market Volume Forecast to 2030
- Market Value Forecast to 2030
- Products: Market Size And Growth, By Type
- Products: Average Per Capita Consumption, By Type
- Products: Exports And Growth, By Type
- Products: Export Prices And Growth, By Type
- Production Volume And Growth
- Exports And Growth
- Export Prices And Growth
- Market Size And Growth
- Per Capita Consumption
- Imports And Growth
- Import Prices
- Production, In Physical Terms, 2012–2023
- Production, In Value Terms, 2012–2023
- Imports, In Physical Terms, 2012–2023
- Imports, In Value Terms, 2012–2023
- Imports, In Physical Terms, By Country, 2023
- Imports, In Physical Terms, By Country, 2012–2023
- Imports, In Value Terms, By Country, 2012–2023
- Import Prices, By Country Of Origin, 2012–2023
- Exports, In Physical Terms, 2012–2023
- Exports, In Value Terms, 2012–2023
- Exports, In Physical Terms, By Country, 2023
- Exports, In Physical Terms, By Country, 2012–2023
- Exports, In Value Terms, By Country, 2012–2023
- Export Prices, By Country Of Destination, 2012–2023


