
France - Articles Of Stationery - Market Analysis, Forecast, Size, Trends and Insights
Get instant access to more than 2 million reports, dashboards, and datasets on the IndexBox Platform.
View PricingFrance's August 2023 Import of Stationery Surges to $19M
France Stationery Imports
In August 2023, purchases abroad of articles of stationery was finally on the rise to reach 3.6K tons for the first time since May 2023, thus ending a two-month declining trend. Overall, imports, however, continue to indicate a slight contraction. The most prominent rate of growth was recorded in May 2023 with an increase of 50% month-to-month. As a result, imports attained the peak of 5.3K tons. From June 2023 to August 2023, the growth of imports remained at a somewhat lower figure.
In value terms, stationery imports expanded significantly to $19M (IndexBox estimates) in August 2023. In general, imports showed a relatively flat trend pattern. The pace of growth was the most pronounced in May 2023 with an increase of 43% month-to-month. As a result, imports attained the peak of $26M. From June 2023 to August 2023, the growth of imports remained at a somewhat lower figure.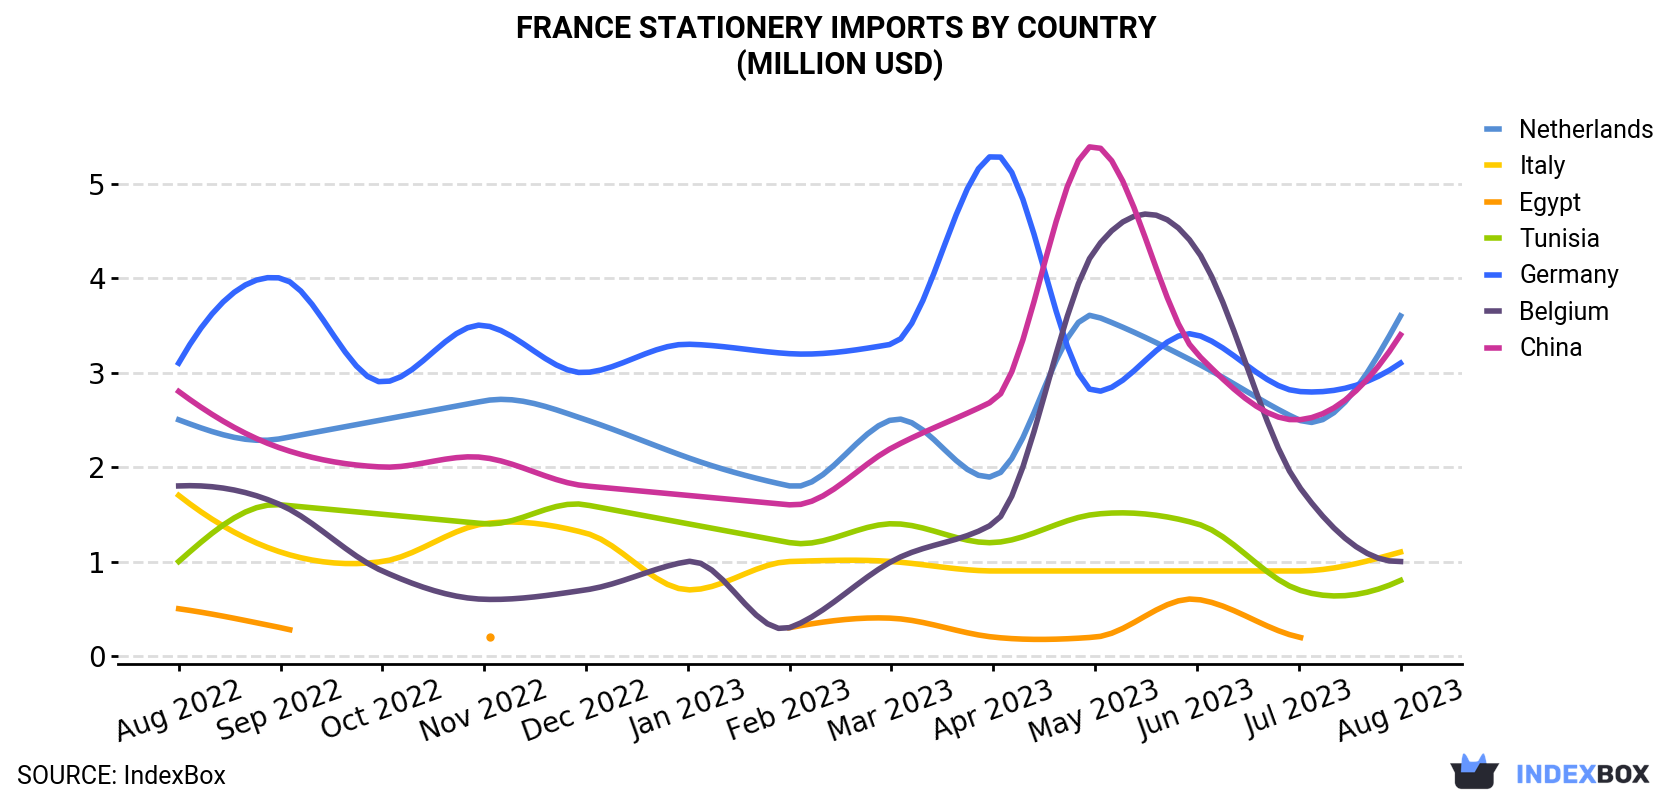
| COUNTRY | Import Value of Stationery in France (million USD) | ||||||||||||
|---|---|---|---|---|---|---|---|---|---|---|---|---|---|
| Aug 2022 | Sep 2022 | Oct 2022 | Nov 2022 | Dec 2022 | Jan 2023 | Feb 2023 | Mar 2023 | Apr 2023 | May 2023 | Jun 2023 | Jul 2023 | Aug 2023 | |
| Netherlands | 2.5 | 2.3 | 2.5 | 2.7 | 2.5 | 2.1 | 1.8 | 2.5 | 1.9 | 3.6 | 3.1 | 2.5 | 3.6 |
| China | 2.8 | 2.2 | 2.0 | 2.1 | 1.8 | 1.7 | 1.6 | 2.2 | 2.7 | 5.4 | 3.2 | 2.5 | 3.4 |
| Germany | 3.1 | 4.0 | 2.9 | 3.5 | 3.0 | 3.3 | 3.2 | 3.3 | 5.3 | 2.8 | 3.4 | 2.8 | 3.1 |
| Italy | 1.7 | 1.1 | 1.0 | 1.4 | 1.3 | 0.7 | 1.0 | 1.0 | 0.9 | 0.9 | 0.9 | 0.9 | 1.1 |
| Belgium | 1.8 | 1.6 | 0.9 | 0.6 | 0.7 | 1.0 | 0.3 | 1.0 | 1.4 | 4.3 | 4.3 | 1.8 | 1.0 |
| Tunisia | 1.0 | 1.6 | 1.5 | 1.4 | 1.6 | 1.4 | 1.2 | 1.4 | 1.2 | 1.5 | 1.4 | 0.7 | 0.8 |
| Egypt | 0.5 | 0.3 | < 0.1 | 0.2 | < 0.1 | < 0.1 | 0.3 | 0.4 | 0.2 | 0.2 | 0.6 | 0.2 | < 0.1 |
| Others | 5.0 | 6.4 | 6.4 | 5.7 | 6.0 | 4.6 | 3.8 | 5.2 | 4.6 | 7.4 | 6.4 | 5.7 | 6.2 |
| Total | 18.3 | 19.4 | 17.2 | 17.7 | 16.9 | 15.0 | 13.3 | 17.0 | 18.3 | 26.1 | 23.3 | 17.1 | 19.2 |
Imports by Country
The Netherlands (985 tons), China (668 tons) and Germany (617 tons) were the main suppliers of stationery imports to France, with a combined 63% share of total imports.
From August 2022 to August 2023, the most notable rate of growth in terms of purchases, amongst the main suppliers, was attained by the Netherlands (with a CAGR of +1.9%), while imports for the other leaders experienced mixed trend patterns.
In value terms, the Netherlands ($3.6M), China ($3.4M) and Germany ($3.1M) constituted the largest stationery suppliers to France, with a combined 52% share of total imports.
Among the main suppliers, the Netherlands, with a CAGR of +3.2%, saw the highest growth rate of the value of imports, over the period under review, while purchases for the other leaders experienced more modest paces of growth.
Imports by Type
In August 2023, registers, account books, order books and receipt books (1.9K tons) constituted the largest type of stationery supplied to France, accounting for a 52% share of total imports. Moreover, registers, account books, order books and receipt books exceeded the figures recorded for the second-largest type, paper binders, folders and file covers (666 tons), threefold. The third position in this ranking was held by exercise books (527 tons), with a 15% share.
From August 2022 to August 2023, the average monthly rate of growth in terms of the volume of import of registers, account books, order books and receipt books was relatively modest. With regard to the other supplied products, the following average monthly rates of growth were recorded: paper binders, folders and file covers (+0.5% per month) and exercise books (-5.1% per month).
In value terms, registers, account books, order books and receipt books ($11M) constituted the largest type of stationery supplied to France, comprising 58% of total imports. The second position in the ranking was taken by paper binders, folders and file covers ($2.9M), with a 15% share of total imports. It was followed by exercise books, with an 11% share.
Import Prices by Country
In August 2023, the stationery price amounted to $5,341 per ton (CIF, France), rising by 9% against the previous month. Over the last twelve months, it increased at an average monthly rate of +1.9%. The growth pace was the most rapid in November 2022 an increase of 15% against the previous month. Over the period under review, average import prices hit record highs in August 2023.
There were significant differences in the average prices amongst the major supplying countries. In August 2023, the country with the highest price was the UK ($9,611 per ton), while the price for Portugal ($2,488 per ton) was amongst the lowest.
From August 2022 to August 2023, the most notable rate of growth in terms of prices was attained by Italy (+8.7%), while the prices for the other major suppliers experienced more modest paces of growth.
This report provides an in-depth analysis of the stationery market in France. Within it, you will discover the latest data on market trends and opportunities by country, consumption, production and price developments, as well as the global trade (imports and exports). The forecast exhibits the market prospects through 2030.
Product coverage:
- Prodcom 17231313 - Registers, account books, order books and receipt books, of paper or paperboard
- Prodcom 17231315 - Notebooks, letter pads, memorandum pads, of paper or paperboard
- Prodcom 17231317 - Diaries, of paper or paperboard
- Prodcom 17231319 - Engagement books, address books, telephone number books and copy books, of paper or paperboard (excluding diaries)
- Prodcom 17231330 - Exercise books, of paper or paperboard
- Prodcom 17231350 - Binders, folders and file covers, of paper or paperboard (excluding book covers)
- Prodcom 17231370 - Manifold business forms and interleaved carbon sets, of paper or paperboard
- Prodcom 17231375 -
- Prodcom 17231379 -
- Prodcom 17231380 - Albums for samples, collections, stamps or photographs, of paper or paperboard
- Prodcom 17231390 - Blotting pads and book covers, of paper or paperboard
Country coverage:
- France
Data coverage:
- Market volume and value
- Per Capita consumption
- Forecast of the market dynamics in the medium term
- Trade (exports and imports) in France
- Export and import prices
- Market trends, drivers and restraints
- Key market players and their profiles
Reasons to buy this report:
- Take advantage of the latest data
- Find deeper insights into current market developments
- Discover vital success factors affecting the market
This report is designed for manufacturers, distributors, importers, and wholesalers, as well as for investors, consultants and advisors.
In this report, you can find information that helps you to make informed decisions on the following issues:
- How to diversify your business and benefit from new market opportunities
- How to load your idle production capacity
- How to boost your sales on overseas markets
- How to increase your profit margins
- How to make your supply chain more sustainable
- How to reduce your production and supply chain costs
- How to outsource production to other countries
- How to prepare your business for global expansion
While doing this research, we combine the accumulated expertise of our analysts and the capabilities of artificial intelligence. The AI-based platform, developed by our data scientists, constitutes the key working tool for business analysts, empowering them to discover deep insights and ideas from the marketing data.
-
1. INTRODUCTION
Making Data-Driven Decisions to Grow Your Business
- REPORT DESCRIPTION
- RESEARCH METHODOLOGY AND AI PLATFORM
- DATA-DRIVEN DECISIONS FOR YOUR BUSINESS
- GLOSSARY AND SPECIFIC TERMS
-
2. EXECUTIVE SUMMARY
A Quick Overview of Market Performance
- KEY FINDINGS
- MARKET TRENDS This Chapter is Available Only for the Professional Edition PRO
-
3. MARKET OVERVIEW
Understanding the Current State of The Market and Its Prospects
- MARKET SIZE
- MARKET STRUCTURE
- TRADE BALANCE
- PER CAPITA CONSUMPTION
- MARKET FORECAST TO 2030
-
4. MOST PROMISING PRODUCT
Finding New Products to Diversify Your Business
This Chapter is Available Only for the Professional Edition PRO- TOP PRODUCTS TO DIVERSIFY YOUR BUSINESS
- BEST-SELLING PRODUCTS
- MOST CONSUMED PRODUCT
- MOST TRADED PRODUCT
- MOST PROFITABLE PRODUCT FOR EXPORT
-
5. MOST PROMISING SUPPLYING COUNTRIES
Choosing the Best Countries to Establish Your Sustainable Supply Chain
This Chapter is Available Only for the Professional Edition PRO- TOP COUNTRIES TO SOURCE YOUR PRODUCT
- TOP PRODUCING COUNTRIES
- TOP EXPORTING COUNTRIES
- LOW-COST EXPORTING COUNTRIES
-
6. MOST PROMISING OVERSEAS MARKETS
Choosing the Best Countries to Boost Your Exports
This Chapter is Available Only for the Professional Edition PRO- TOP OVERSEAS MARKETS FOR EXPORTING YOUR PRODUCT
- TOP CONSUMING MARKETS
- UNSATURATED MARKETS
- TOP IMPORTING MARKETS
- MOST PROFITABLE MARKETS
7. PRODUCTION
The Latest Trends and Insights into The Industry
- PRODUCTION VOLUME AND VALUE
8. IMPORTS
The Largest Import Supplying Countries
- IMPORTS FROM 2012–2023
- IMPORTS BY COUNTRY
- IMPORT PRICES BY COUNTRY
9. EXPORTS
The Largest Destinations for Exports
- EXPORTS FROM 2012–2023
- EXPORTS BY COUNTRY
- EXPORT PRICES BY COUNTRY
-
10. PROFILES OF MAJOR PRODUCERS
The Largest Producers on The Market and Their Profiles
This Chapter is Available Only for the Professional Edition PRO -
LIST OF TABLES
- Key Findings In 2023
- Market Volume, In Physical Terms, 2012–2023
- Market Value, 2012–2023
- Per Capita Consumption In 2012-2023
- Imports, In Physical Terms, By Country, 2012–2023
- Imports, In Value Terms, By Country, 2012–2023
- Import Prices, By Country Of Origin, 2012–2023
- Exports, In Physical Terms, By Country, 2012–2023
- Exports, In Value Terms, By Country, 2012–2023
- Export Prices, By Country Of Destination, 2012–2023
-
LIST OF FIGURES
- Market Volume, In Physical Terms, 2012–2023
- Market Value, 2012–2023
- Market Structure – Domestic Supply vs. Imports, In Physical Terms, 2012-2023
- Market Structure – Domestic Supply vs. Imports, In Value Terms, 2012-2023
- Trade Balance, In Physical Terms, 2012-2023
- Trade Balance, In Value Terms, 2012-2023
- Per Capita Consumption, 2012-2023
- Market Volume Forecast to 2030
- Market Value Forecast to 2030
- Products: Market Size And Growth, By Type
- Products: Average Per Capita Consumption, By Type
- Products: Exports And Growth, By Type
- Products: Export Prices And Growth, By Type
- Production Volume And Growth
- Exports And Growth
- Export Prices And Growth
- Market Size And Growth
- Per Capita Consumption
- Imports And Growth
- Import Prices
- Production, In Physical Terms, 2012–2023
- Production, In Value Terms, 2012–2023
- Imports, In Physical Terms, 2012–2023
- Imports, In Value Terms, 2012–2023
- Imports, In Physical Terms, By Country, 2023
- Imports, In Physical Terms, By Country, 2012–2023
- Imports, In Value Terms, By Country, 2012–2023
- Import Prices, By Country Of Origin, 2012–2023
- Exports, In Physical Terms, 2012–2023
- Exports, In Value Terms, 2012–2023
- Exports, In Physical Terms, By Country, 2023
- Exports, In Physical Terms, By Country, 2012–2023
- Exports, In Value Terms, By Country, 2012–2023
- Export Prices, By Country Of Destination, 2012–2023


