
France - Power Tools - Market Analysis, Forecast, Size, Trends and Insights
Get instant access to more than 2 million reports, dashboards, and datasets on the IndexBox Platform.
View PricingFrances Tools Experience Significant Price Increase, Now $70.4 per Unit
France Power Tool Import Price in June 2023
In June 2023, the power tool price amounted to $70.4 per unit (CIF, France), rising by 6.8% against the previous month. Over the period from June 2022 to June 2023, it increased at an average monthly rate of +2.0%. The most prominent rate of growth was recorded in January 2023 an increase of 23% month-to-month. Over the period under review, average import prices reached the maximum in June 2023.
Prices varied noticeably by the country of origin: the country with the highest price was Austria ($176 per unit), while the price for China ($36.1 per unit) was amongst the lowest.
From June 2022 to June 2023, the most notable rate of growth in terms of prices was attained by Austria (+4.8%), while the prices for the other major suppliers experienced more modest paces of growth.
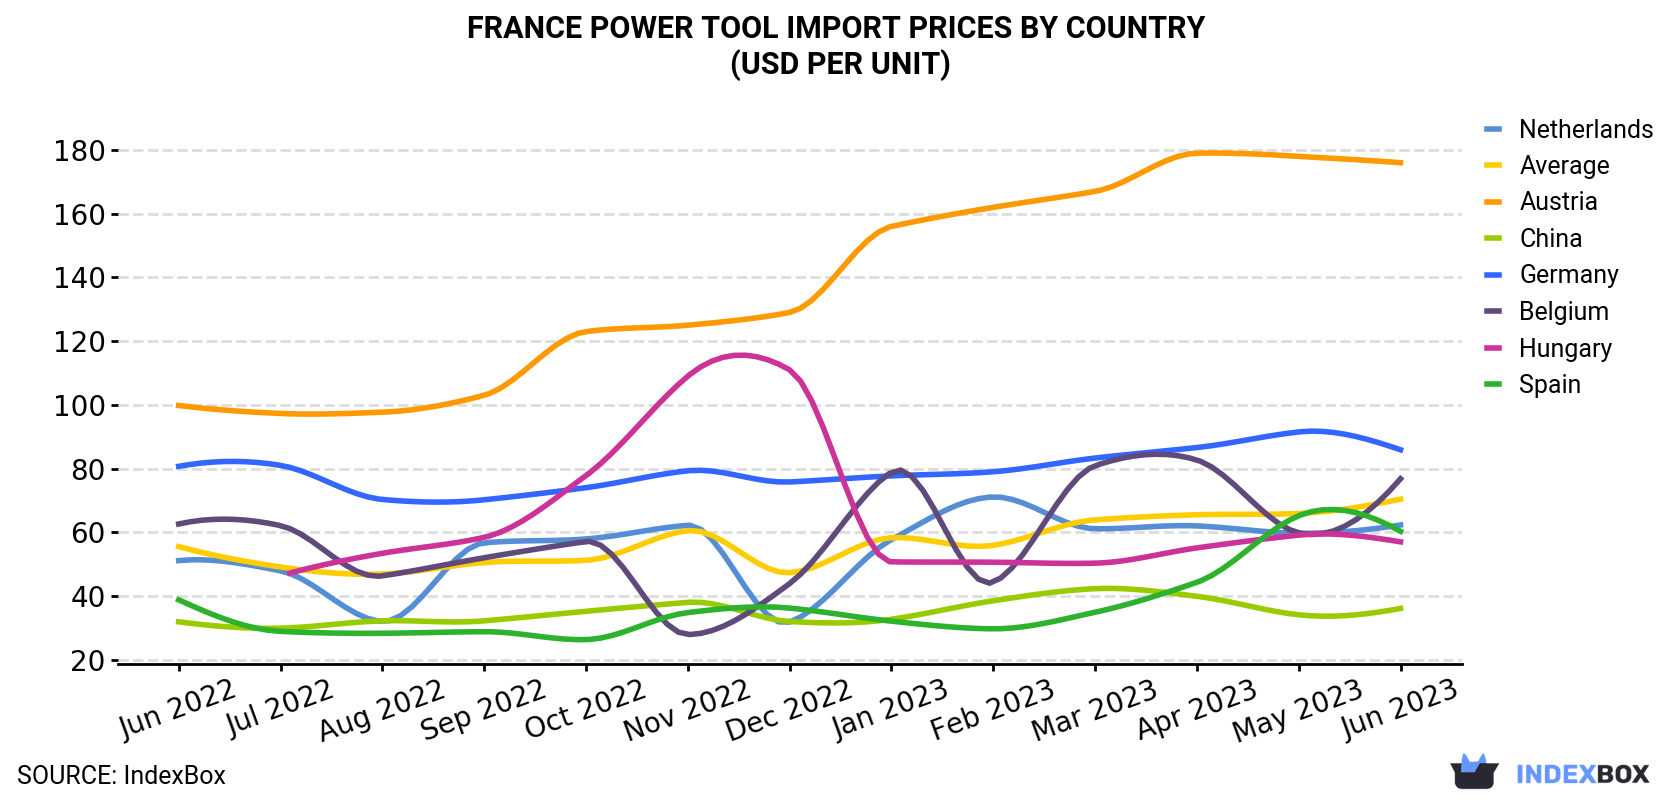
| COUNTRY | Import Price of Power Tool in France (USD per unit) | ||||||||||||
|---|---|---|---|---|---|---|---|---|---|---|---|---|---|
| Jun 2022 | Jul 2022 | Aug 2022 | Sep 2022 | Oct 2022 | Nov 2022 | Dec 2022 | Jan 2023 | Feb 2023 | Mar 2023 | Apr 2023 | May 2023 | Jun 2023 | |
| Austria | 99.8 | 97.3 | 97.7 | 103 | 123 | 125 | 129 | 156 | 162 | 167 | 179 | 178 | 176 |
| Germany | 80.7 | 81.0 | 70.3 | 70.2 | 74.0 | 79.3 | 75.8 | 77.7 | 79.0 | 83.3 | 86.6 | 91.5 | 85.9 |
| Belgium | 62.6 | 62.1 | 46.3 | 52.0 | 57.1 | 27.9 | 43.9 | 78.9 | 44.3 | 80.9 | 82.7 | 59.8 | 76.8 |
| Netherlands | 51.1 | 47.9 | 32.0 | 56.7 | 57.9 | 62.2 | 31.8 | 57.7 | 71.1 | 61.1 | 62.0 | 59.7 | 62.3 |
| Spain | 38.8 | 28.9 | 28.3 | 28.8 | 26.3 | 34.8 | 36.2 | 32.1 | 29.7 | 34.9 | 44.3 | 65.2 | 60.3 |
| Hungary | N/A | 46.4 | 53.4 | 58.4 | 77.8 | 109 | 111 | 50.7 | 50.6 | 50.3 | 55.1 | 59.1 | 57.0 |
| China | 31.9 | 29.9 | 32.2 | 32.2 | 35.2 | 38.0 | 32.0 | 32.7 | 38.5 | 42.3 | 39.9 | 34.1 | 36.1 |
| Average | 55.5 | 49.1 | 46.9 | 50.5 | 51.2 | 60.5 | 47.3 | 58.3 | 55.9 | 63.9 | 65.5 | 65.9 | 70.4 |
France Power Tool Import Prices by Type
Average prices varied noticeably amongst the major supplied products. In June 2023, the product with the highest price was saws for working in the hand, with self-contained electric motor ($72.4 per unit), while the price for in-hand motor grinders, sanders and planers ($69.4 per unit) was amongst the lowest.
From June 2022 to June 2023, the most notable rate of growth in terms of prices was attained by electromechanical tools for working in the hand, with self-contained electric motor (+2.5%), while the prices for the other products experienced more modest paces of growth.
France Power Tool Imports
In June 2023, approximately 1.2M units of power tools were imported into France; remaining relatively unchanged against May 2023. In general, imports continue to indicate a perceptible contraction. The most prominent rate of growth was recorded in December 2022 when imports increased by 34% against the previous month. Imports peaked at 2M units in July 2022; however, from August 2022 to June 2023, imports stood at a somewhat lower figure.
In value terms, power tool imports rose markedly to $85M (IndexBox estimates) in June 2023. Over the period under review, imports showed a perceptible setback. The pace of growth appeared the most rapid in February 2023 when imports increased by 12% month-to-month. Over the period under review, imports hit record highs at 112M units in June 2022; however, from July 2022 to June 2023, imports remained at a lower figure.
France Power Tool Imports by Type
In June 2023, in-hand motor grinders, sanders and planers (777K units) constituted the largest type of power tool supplied to France, with a 65% share of total imports. Moreover, in-hand motor grinders, sanders and planers exceeded the figures recorded for the second-largest type, drills of all kinds for working in the hand, with self-contained electric motor (257K units), threefold.
From June 2022 to June 2023, the average monthly rate of growth in terms of the volume of import of in-hand motor grinders, sanders and planers stood at -4.2%. With regard to the other supplied products, the following average monthly rates of growth were recorded: drills of all kinds for working in the hand, with self-contained electric motor (-4.0% per month) and saws for working in the hand, with self-contained electric motor (-4.8% per month).
In value terms, in-hand motor grinders, sanders and planers ($54M) constituted the largest type of power tool supplied to France, comprising 64% of total imports. The second position in the ranking was taken by drills of all kinds for working in the hand, with self-contained electric motor ($19M), with a 22% share of total imports.
France Power Tool Imports by Country
Germany (356K units), China (350K units) and the Netherlands (142K units) were the main suppliers of power tool imports to France, with a combined 71% share of total imports.
From June 2022 to June 2023, the biggest increases were in the Netherlands (with a CAGR of +3.0%), while purchases for the other leaders experienced a decline.
In value terms, Germany ($31M) constituted the largest supplier of power tool to France, comprising 36% of total imports. The second position in the ranking was held by China ($13M), with a 15% share of total imports. It was followed by the Netherlands, with a 10% share.
From June 2022 to June 2023, the average monthly rate of growth in terms of value from Germany stood at -1.9%. The remaining supplying countries recorded the following average monthly rates of imports growth: China (-2.8% per month) and the Netherlands (+4.7% per month).
This report provides an in-depth analysis of the power tool market in France. Within it, you will discover the latest data on market trends and opportunities by country, consumption, production and price developments, as well as the global trade (imports and exports). The forecast exhibits the market prospects through 2030.
Product coverage:
- Prodcom 28241113 - Electromechanical hand drills operated without an external source of power
- Prodcom 28241115 - Electropneumatic drills of all kinds for working in the hand
- Prodcom 28241117 - Electromechanical hand drills of all kinds (excluding those operated without an external source of power, e lectropneumatic)
- Prodcom 28241120 - Electromechanical hand tools operated without an external source of power (excluding drills, saws )
- Prodcom 28241123 - Electromechanical chainsaws
- Prodcom 28241125 - Electromechanical circular saws
- Prodcom 28241127 - Electromechanical handsaws (excluding chainsaws, circular saws)
- Prodcom 28241133 -
- Prodcom 28241135 -
- Prodcom 28241150 - Grinders, sanders and planers, for working in the hand, with self-contained electric motor, operating with an external source of power
- Prodcom 28241180 - Electromechanical hedge trimmers and lawn edge cutters
- Prodcom 28241185 - Electromechanical hand tools, with self-contained electric motor operating with an external source of power (excluding saws, drills, grinders, sanders, planers, hedge trimmers and lawn edge cutters)
- Prodcom 28241190 -
Country coverage:
- France
Data coverage:
- Market volume and value
- Per Capita consumption
- Forecast of the market dynamics in the medium term
- Trade (exports and imports) in France
- Export and import prices
- Market trends, drivers and restraints
- Key market players and their profiles
Reasons to buy this report:
- Take advantage of the latest data
- Find deeper insights into current market developments
- Discover vital success factors affecting the market
This report is designed for manufacturers, distributors, importers, and wholesalers, as well as for investors, consultants and advisors.
In this report, you can find information that helps you to make informed decisions on the following issues:
- How to diversify your business and benefit from new market opportunities
- How to load your idle production capacity
- How to boost your sales on overseas markets
- How to increase your profit margins
- How to make your supply chain more sustainable
- How to reduce your production and supply chain costs
- How to outsource production to other countries
- How to prepare your business for global expansion
While doing this research, we combine the accumulated expertise of our analysts and the capabilities of artificial intelligence. The AI-based platform, developed by our data scientists, constitutes the key working tool for business analysts, empowering them to discover deep insights and ideas from the marketing data.
-
1. INTRODUCTION
Making Data-Driven Decisions to Grow Your Business
- REPORT DESCRIPTION
- RESEARCH METHODOLOGY AND AI PLATFORM
- DATA-DRIVEN DECISIONS FOR YOUR BUSINESS
- GLOSSARY AND SPECIFIC TERMS
-
2. EXECUTIVE SUMMARY
A Quick Overview of Market Performance
- KEY FINDINGS
- MARKET TRENDS This Chapter is Available Only for the Professional Edition PRO
-
3. MARKET OVERVIEW
Understanding the Current State of The Market and Its Prospects
- MARKET SIZE
- MARKET STRUCTURE
- TRADE BALANCE
- PER CAPITA CONSUMPTION
- MARKET FORECAST TO 2030
-
4. MOST PROMISING PRODUCT
Finding New Products to Diversify Your Business
This Chapter is Available Only for the Professional Edition PRO- TOP PRODUCTS TO DIVERSIFY YOUR BUSINESS
- BEST-SELLING PRODUCTS
- MOST CONSUMED PRODUCT
- MOST TRADED PRODUCT
- MOST PROFITABLE PRODUCT FOR EXPORT
-
5. MOST PROMISING SUPPLYING COUNTRIES
Choosing the Best Countries to Establish Your Sustainable Supply Chain
This Chapter is Available Only for the Professional Edition PRO- TOP COUNTRIES TO SOURCE YOUR PRODUCT
- TOP PRODUCING COUNTRIES
- TOP EXPORTING COUNTRIES
- LOW-COST EXPORTING COUNTRIES
-
6. MOST PROMISING OVERSEAS MARKETS
Choosing the Best Countries to Boost Your Exports
This Chapter is Available Only for the Professional Edition PRO- TOP OVERSEAS MARKETS FOR EXPORTING YOUR PRODUCT
- TOP CONSUMING MARKETS
- UNSATURATED MARKETS
- TOP IMPORTING MARKETS
- MOST PROFITABLE MARKETS
7. PRODUCTION
The Latest Trends and Insights into The Industry
- PRODUCTION VOLUME AND VALUE
8. IMPORTS
The Largest Import Supplying Countries
- IMPORTS FROM 2012–2023
- IMPORTS BY COUNTRY
- IMPORT PRICES BY COUNTRY
9. EXPORTS
The Largest Destinations for Exports
- EXPORTS FROM 2012–2023
- EXPORTS BY COUNTRY
- EXPORT PRICES BY COUNTRY
-
10. PROFILES OF MAJOR PRODUCERS
The Largest Producers on The Market and Their Profiles
This Chapter is Available Only for the Professional Edition PRO -
LIST OF TABLES
- Key Findings In 2023
- Market Volume, In Physical Terms, 2012–2023
- Market Value, 2012–2023
- Per Capita Consumption In 2012-2023
- Imports, In Physical Terms, By Country, 2012–2023
- Imports, In Value Terms, By Country, 2012–2023
- Import Prices, By Country Of Origin, 2012–2023
- Exports, In Physical Terms, By Country, 2012–2023
- Exports, In Value Terms, By Country, 2012–2023
- Export Prices, By Country Of Destination, 2012–2023
-
LIST OF FIGURES
- Market Volume, In Physical Terms, 2012–2023
- Market Value, 2012–2023
- Market Structure – Domestic Supply vs. Imports, In Physical Terms, 2012-2023
- Market Structure – Domestic Supply vs. Imports, In Value Terms, 2012-2023
- Trade Balance, In Physical Terms, 2012-2023
- Trade Balance, In Value Terms, 2012-2023
- Per Capita Consumption, 2012-2023
- Market Volume Forecast to 2030
- Market Value Forecast to 2030
- Products: Market Size And Growth, By Type
- Products: Average Per Capita Consumption, By Type
- Products: Exports And Growth, By Type
- Products: Export Prices And Growth, By Type
- Production Volume And Growth
- Exports And Growth
- Export Prices And Growth
- Market Size And Growth
- Per Capita Consumption
- Imports And Growth
- Import Prices
- Production, In Physical Terms, 2012–2023
- Production, In Value Terms, 2012–2023
- Imports, In Physical Terms, 2012–2023
- Imports, In Value Terms, 2012–2023
- Imports, In Physical Terms, By Country, 2023
- Imports, In Physical Terms, By Country, 2012–2023
- Imports, In Value Terms, By Country, 2012–2023
- Import Prices, By Country Of Origin, 2012–2023
- Exports, In Physical Terms, 2012–2023
- Exports, In Value Terms, 2012–2023
- Exports, In Physical Terms, By Country, 2023
- Exports, In Physical Terms, By Country, 2012–2023
- Exports, In Value Terms, By Country, 2012–2023
- Export Prices, By Country Of Destination, 2012–2023


