
France - Watch Straps, Bands And Bracelets - Market Analysis, Forecast, Size, Trends And Insights
Get instant access to more than 2 million reports, dashboards, and datasets on the IndexBox Platform.
View PricingFrance's September 2023 Exports of Bracelets Plummet to $13M
France Bracelet Exports
Bracelet exports from France dropped significantly to 533K units in September 2023, with a decrease of -36.2% on August 2023 figures. Overall, exports, however, showed a relatively flat trend pattern. The pace of growth appeared the most rapid in August 2023 when exports increased by 78% against the previous month. As a result, the exports attained the peak of 835K units, and then shrank notably in the following month.
In value terms, bracelet exports dropped remarkably to $13M (IndexBox estimates) in September 2023. Over the period under review, exports saw a mild reduction. The growth pace was the most rapid in June 2023 with an increase of 35% against the previous month. Over the period under review, the exports attained the maximum at 17M units in August 2023, and then shrank rapidly in the following month.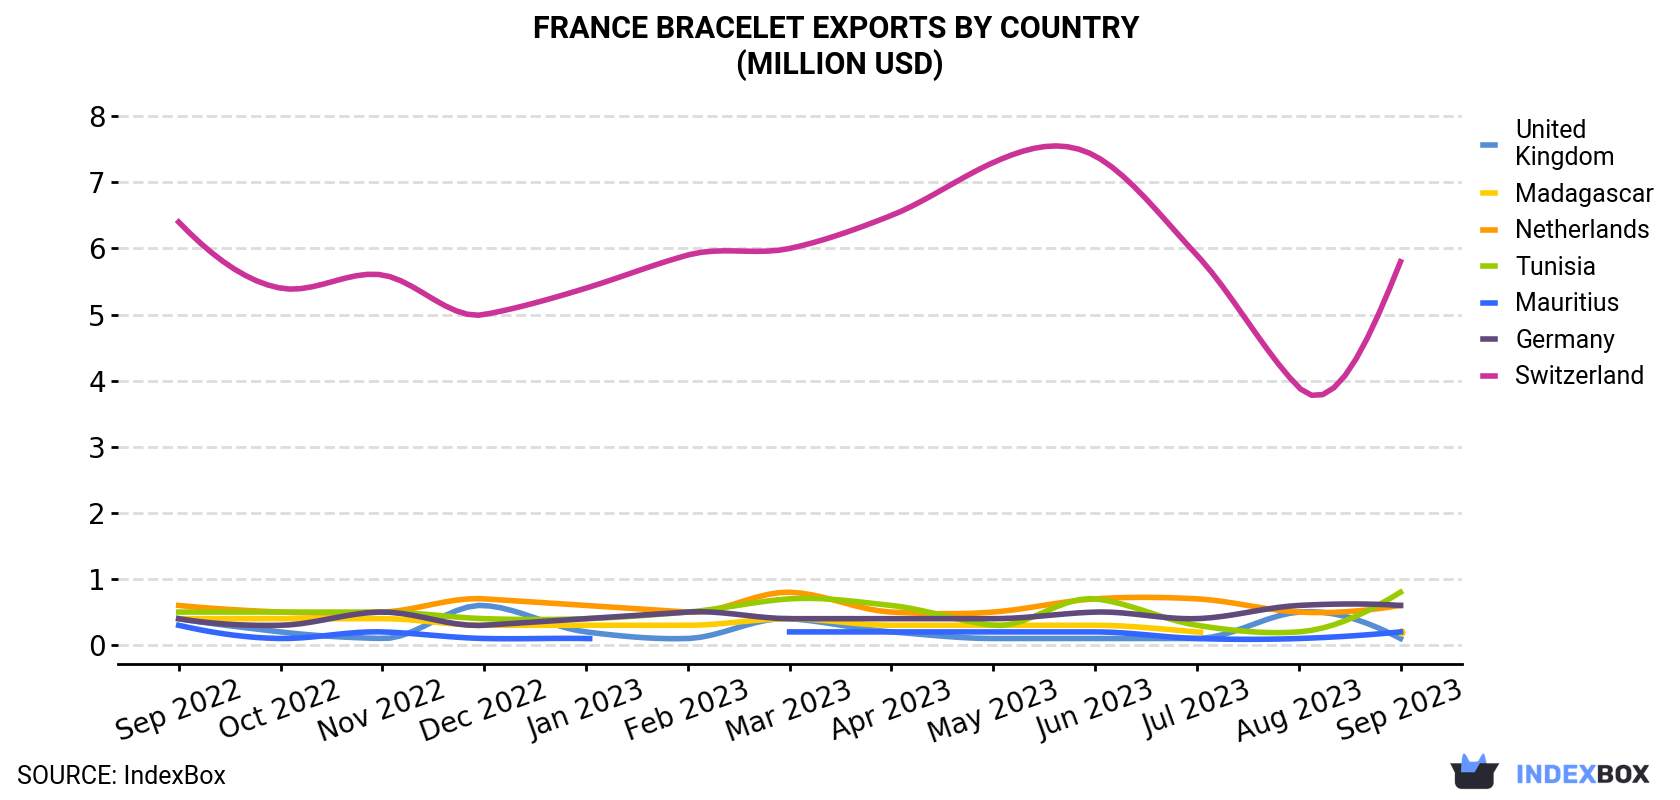
| COUNTRY | Export Value of Bracelet in France (million USD) | ||||||||||||
|---|---|---|---|---|---|---|---|---|---|---|---|---|---|
| Sep 2022 | Oct 2022 | Nov 2022 | Dec 2022 | Jan 2023 | Feb 2023 | Mar 2023 | Apr 2023 | May 2023 | Jun 2023 | Jul 2023 | Aug 2023 | Sep 2023 | |
| Switzerland | 6.4 | 5.4 | 5.6 | 5.0 | 5.4 | 5.9 | 6.0 | 6.5 | 7.3 | 7.4 | 5.9 | 3.9 | 5.8 |
| Tunisia | 0.5 | 0.5 | 0.5 | 0.4 | 0.4 | 0.5 | 0.7 | 0.6 | 0.3 | 0.7 | 0.3 | 0.2 | 0.8 |
| Netherlands | 0.6 | 0.5 | 0.5 | 0.7 | 0.6 | 0.5 | 0.8 | 0.5 | 0.5 | 0.7 | 0.7 | 0.5 | 0.6 |
| Germany | 0.4 | 0.3 | 0.5 | 0.3 | 0.4 | 0.5 | 0.4 | 0.4 | 0.4 | 0.5 | 0.4 | 0.6 | 0.6 |
| Madagascar | 0.4 | 0.4 | 0.4 | 0.3 | 0.3 | 0.3 | 0.4 | 0.3 | 0.3 | 0.3 | 0.2 | < 0.1 | 0.2 |
| Mauritius | 0.3 | 0.1 | 0.2 | 0.1 | 0.1 | < 0.1 | 0.2 | 0.2 | 0.2 | 0.2 | 0.1 | 0.1 | 0.2 |
| United Kingdom | 0.4 | 0.2 | 0.1 | 0.6 | 0.2 | 0.1 | 0.4 | 0.2 | 0.1 | 0.1 | 0.1 | 0.5 | 0.1 |
| Others | 5.7 | 7.3 | 4.3 | 4.7 | 6.5 | 5.4 | 4.0 | 2.4 | 3.1 | 6.6 | 5.0 | 10.8 | 4.8 |
| Total | 14.7 | 14.7 | 12.1 | 12.2 | 14.0 | 13.3 | 13.0 | 11.1 | 12.3 | 16.5 | 12.7 | 16.7 | 13.1 |
Exports by Country
Switzerland (92K units), Tunisia (79K units) and the Netherlands (71K units) were the main destinations of bracelet exports from France, with a combined 45% share of total exports.
From September 2022 to September 2023, the biggest increases were in Tunisia (with a CAGR of +2.1%), while shipments for the other leaders experienced more modest paces of growth.
In value terms, Switzerland ($5.8M) remains the key foreign market for bracelet exports from France, comprising 45% of total exports. The second position in the ranking was taken by Tunisia ($783K), with a 6% share of total exports. It was followed by the Netherlands, with a 4.3% share.
From September 2022 to September 2023, the average monthly growth rate of value to Switzerland was relatively modest. Exports to the other major destinations recorded the following average monthly rates of exports growth: Tunisia (+3.8% per month) and the Netherlands (-0.7% per month).
Export Prices by Country
In September 2023, the bracelet price amounted to $24.5 per unit (FOB, France), surging by 23% against the previous month. In general, the export price, however, recorded a slight descent. The growth pace was the most rapid in May 2023 when the average export price increased by 33% m-o-m. The export price peaked at $28.7 per unit in September 2022; however, from October 2022 to September 2023, the export prices failed to regain momentum.
There were significant differences in the average prices for the major foreign markets. In September 2023, the country with the highest price was China ($92.5 per unit), while the average price for exports to Sweden ($3.1 per unit) was amongst the lowest.
From September 2022 to September 2023, the most notable rate of growth in terms of prices was recorded for supplies to Portugal (+3.5%), while the prices for the other major destinations experienced more modest paces of growth.
This report provides an in-depth analysis of the bracelet market in France. Within it, you will discover the latest data on market trends and opportunities by country, consumption, production and price developments, as well as the global trade (imports and exports). The forecast exhibits the market prospects through 2030.
Product coverage:
- Prodcom 15121300 - Watch straps, bands, bracelets and parts thereof (including of leather, composition leather or plastic, excluding of precious metal, metal or base metal clad/plated with precious metal)
Country coverage:
- France
Data coverage:
- Market volume and value
- Per Capita consumption
- Forecast of the market dynamics in the medium term
- Trade (exports and imports) in France
- Export and import prices
- Market trends, drivers and restraints
- Key market players and their profiles
Reasons to buy this report:
- Take advantage of the latest data
- Find deeper insights into current market developments
- Discover vital success factors affecting the market
This report is designed for manufacturers, distributors, importers, and wholesalers, as well as for investors, consultants and advisors.
In this report, you can find information that helps you to make informed decisions on the following issues:
- How to diversify your business and benefit from new market opportunities
- How to load your idle production capacity
- How to boost your sales on overseas markets
- How to increase your profit margins
- How to make your supply chain more sustainable
- How to reduce your production and supply chain costs
- How to outsource production to other countries
- How to prepare your business for global expansion
While doing this research, we combine the accumulated expertise of our analysts and the capabilities of artificial intelligence. The AI-based platform, developed by our data scientists, constitutes the key working tool for business analysts, empowering them to discover deep insights and ideas from the marketing data.
-
1. INTRODUCTION
Making Data-Driven Decisions to Grow Your Business
- REPORT DESCRIPTION
- RESEARCH METHODOLOGY AND AI PLATFORM
- DATA-DRIVEN DECISIONS FOR YOUR BUSINESS
- GLOSSARY AND SPECIFIC TERMS
-
2. EXECUTIVE SUMMARY
A Quick Overview of Market Performance
- KEY FINDINGS
- MARKET TRENDS This Chapter is Available Only for the Professional Edition PRO
-
3. MARKET OVERVIEW
Understanding the Current State of The Market and Its Prospects
- MARKET SIZE
- MARKET STRUCTURE
- TRADE BALANCE
- PER CAPITA CONSUMPTION
- MARKET FORECAST TO 2030
-
4. MOST PROMISING PRODUCT
Finding New Products to Diversify Your Business
This Chapter is Available Only for the Professional Edition PRO- TOP PRODUCTS TO DIVERSIFY YOUR BUSINESS
- BEST-SELLING PRODUCTS
- MOST CONSUMED PRODUCT
- MOST TRADED PRODUCT
- MOST PROFITABLE PRODUCT FOR EXPORT
-
5. MOST PROMISING SUPPLYING COUNTRIES
Choosing the Best Countries to Establish Your Sustainable Supply Chain
This Chapter is Available Only for the Professional Edition PRO- TOP COUNTRIES TO SOURCE YOUR PRODUCT
- TOP PRODUCING COUNTRIES
- TOP EXPORTING COUNTRIES
- LOW-COST EXPORTING COUNTRIES
-
6. MOST PROMISING OVERSEAS MARKETS
Choosing the Best Countries to Boost Your Exports
This Chapter is Available Only for the Professional Edition PRO- TOP OVERSEAS MARKETS FOR EXPORTING YOUR PRODUCT
- TOP CONSUMING MARKETS
- UNSATURATED MARKETS
- TOP IMPORTING MARKETS
- MOST PROFITABLE MARKETS
7. PRODUCTION
The Latest Trends and Insights into The Industry
- PRODUCTION VOLUME AND VALUE
8. IMPORTS
The Largest Import Supplying Countries
- IMPORTS FROM 2012–2023
- IMPORTS BY COUNTRY
- IMPORT PRICES BY COUNTRY
9. EXPORTS
The Largest Destinations for Exports
- EXPORTS FROM 2012–2023
- EXPORTS BY COUNTRY
- EXPORT PRICES BY COUNTRY
-
10. PROFILES OF MAJOR PRODUCERS
The Largest Producers on The Market and Their Profiles
This Chapter is Available Only for the Professional Edition PRO -
LIST OF TABLES
- Key Findings In 2023
- Market Volume, In Physical Terms, 2012–2023
- Market Value, 2012–2023
- Per Capita Consumption In 2012-2023
- Imports, In Physical Terms, By Country, 2012–2023
- Imports, In Value Terms, By Country, 2012–2023
- Import Prices, By Country Of Origin, 2012–2023
- Exports, In Physical Terms, By Country, 2012–2023
- Exports, In Value Terms, By Country, 2012–2023
- Export Prices, By Country Of Destination, 2012–2023
-
LIST OF FIGURES
- Market Volume, In Physical Terms, 2012–2023
- Market Value, 2012–2023
- Market Structure – Domestic Supply vs. Imports, In Physical Terms, 2012-2023
- Market Structure – Domestic Supply vs. Imports, In Value Terms, 2012-2023
- Trade Balance, In Physical Terms, 2012-2023
- Trade Balance, In Value Terms, 2012-2023
- Per Capita Consumption, 2012-2023
- Market Volume Forecast to 2030
- Market Value Forecast to 2030
- Products: Market Size And Growth, By Type
- Products: Average Per Capita Consumption, By Type
- Products: Exports And Growth, By Type
- Products: Export Prices And Growth, By Type
- Production Volume And Growth
- Exports And Growth
- Export Prices And Growth
- Market Size And Growth
- Per Capita Consumption
- Imports And Growth
- Import Prices
- Production, In Physical Terms, 2012–2023
- Production, In Value Terms, 2012–2023
- Imports, In Physical Terms, 2012–2023
- Imports, In Value Terms, 2012–2023
- Imports, In Physical Terms, By Country, 2023
- Imports, In Physical Terms, By Country, 2012–2023
- Imports, In Value Terms, By Country, 2012–2023
- Import Prices, By Country Of Origin, 2012–2023
- Exports, In Physical Terms, 2012–2023
- Exports, In Value Terms, 2012–2023
- Exports, In Physical Terms, By Country, 2023
- Exports, In Physical Terms, By Country, 2012–2023
- Exports, In Value Terms, By Country, 2012–2023
- Export Prices, By Country Of Destination, 2012–2023


