
Asia - Footwear - Market Analysis, Forecast, Size, Trends And Insights
Get instant access to more than 2 million reports, dashboards, and datasets on the IndexBox Platform.
View PricingAsia's Footwear Market Poised for Steady Growth with 2.4% CAGR in Value Through 2035
IndexBox has just published a new report: Asia - Footwear - Market Analysis, Forecast, Size, Trends And Insights.
This comprehensive report analyzes the Asian footwear market from 2013 to 2024, with projections extending to 2035. In 2024, the market consumed 7.8 billion pairs valued at $105.5 billion, with China leading consumption at 2.1 billion pairs. Production reached 16 billion pairs, dominated by China which accounted for 66% of total output. The market is forecast to grow at a CAGR of +1.0% in volume and +2.4% in value through 2035, reaching 8.6 billion pairs worth $137.6 billion. Key trends include China's production dominance despite a slight decline, Vietnam's emergence as a major exporter, and varying growth rates across different footwear types and countries.
Key Findings
- Asia's footwear market is forecast to grow to 8.6B pairs valued at $137.6B by 2035, with a CAGR of +1.0% in volume and +2.4% in value
- China is the dominant producer (66% share, 11B pairs) and consumer (28% share, 2.1B pairs)
- Footwear with uppers of textile materials shows the strongest consumption growth (+3.4% CAGR 2013-2024)
- Vietnam is the fastest-growing exporter by value (+8.5% CAGR), challenging China's export dominance
- Japan is the largest importer (569M pairs), while China pays the highest average import price ($29 per pair)
Market Forecast
Driven by increasing demand for footwear in Asia, the market is expected to continue an upward consumption trend over the next decade. Market performance is forecast to retain its current trend pattern, expanding with an anticipated CAGR of +1.0% for the period from 2024 to 2035, which is projected to bring the market volume to 8.6B pairs by the end of 2035.
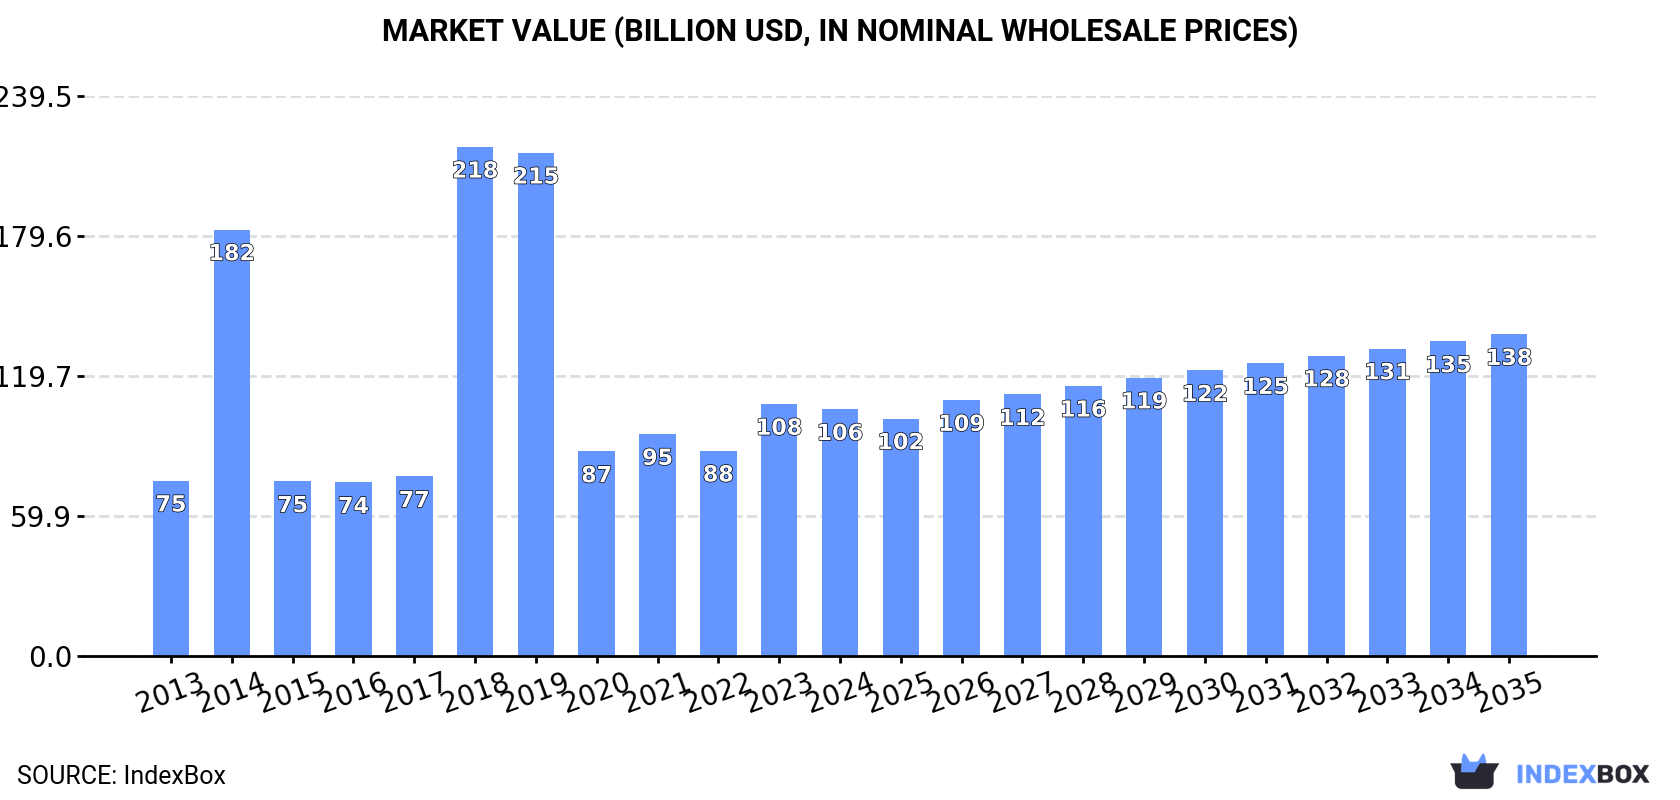
In value terms, the market is forecast to increase with an anticipated CAGR of +2.4% for the period from 2024 to 2035, which is projected to bring the market value to $137.6B (in nominal wholesale prices) by the end of 2035.
Consumption
Asia's Consumption of Footwear
In 2024, footwear consumption in Asia contracted to 7.8B pairs, dropping by -3.4% on 2023. In general, consumption, however, recorded a relatively flat trend pattern. Over the period under review, consumption attained the peak volume at 14B pairs in 2018; however, from 2019 to 2024, consumption remained at a lower figure.
The value of the footwear market in Asia dropped slightly to $105.5B in 2024, falling by -2.1% against the previous year. This figure reflects the total revenues of producers and importers (excluding logistics costs, retail marketing costs, and retailers' margins, which will be included in the final consumer price). Over the period under review, consumption, however, saw moderate growth. As a result, consumption reached the peak level of $217.7B. From 2019 to 2024, the growth of the market remained at a lower figure.
Consumption By Country
The country with the largest volume of footwear consumption was China (2.1B pairs), accounting for 28% of total volume. Moreover, footwear consumption in China exceeded the figures recorded by the second-largest consumer, India (876M pairs), twofold. The third position in this ranking was taken by Indonesia (672M pairs), with an 8.7% share.
In China, footwear consumption decreased by an average annual rate of -2.2% over the period from 2013-2024. The remaining consuming countries recorded the following average annual rates of consumption growth: India (+4.7% per year) and Indonesia (+1.6% per year).
In value terms, China ($37.4B) led the market, alone. The second position in the ranking was held by Indonesia ($10.6B). It was followed by India.
In China, the footwear market increased at an average annual rate of +2.3% over the period from 2013-2024. The remaining consuming countries recorded the following average annual rates of market growth: Indonesia (+3.6% per year) and India (+13.1% per year).
The countries with the highest levels of footwear per capita consumption in 2024 were Japan (4.9 pairs per person), Turkey (4.6 pairs per person) and Thailand (3.3 pairs per person).
From 2013 to 2024, the most notable rate of growth in terms of consumption, amongst the main consuming countries, was attained by Turkey (with a CAGR of +5.6%), while consumption for the other leaders experienced more modest paces of growth.
Consumption By Type
The products with the highest volumes of consumption in 2024 were footwear of rubber or plastics, not waterproof, not sports, without a metal toe-cap (3.1B pairs), footwear with uppers of textile materials (2.4B pairs) and leather footwear (2B pairs), with a combined 96% share of the total volume.
From 2013 to 2024, the biggest increases were recorded for footwear with uppers of textile materials (with a CAGR of +3.4%), while consumption for the other products experienced mixed trends in the consumption figures.
In value terms, leather footwear ($64.6B) led the market, alone. The second position in the ranking was taken by footwear with uppers of textile materials ($19.1B). It was followed by footwear of rubber or plastics, not waterproof, not sports, without a metal toe-cap.
From 2013 to 2024, the average annual rate of growth in terms of the value of leather footwear market amounted to +2.5%. With regard to the other consumed products, the following average annual rates of growth were recorded: footwear with uppers of textile materials (+7.4% per year) and footwear of rubber or plastics, not waterproof, not sports, without a metal toe-cap (+3.0% per year).
Production
Asia's Production of Footwear
In 2024, approx. 16B pairs of footwear were produced in Asia; flattening at 2023. Over the period under review, production recorded a relatively flat trend pattern. The pace of growth was the most pronounced in 2021 with an increase of 7.1% against the previous year. The volume of production peaked at 17B pairs in 2014; however, from 2015 to 2024, production failed to regain momentum.
In value terms, footwear production shrank slightly to $134B in 2024 estimated in export price. The total output value increased at an average annual rate of +1.1% from 2013 to 2024; the trend pattern indicated some noticeable fluctuations being recorded throughout the analyzed period. The pace of growth was the most pronounced in 2018 with an increase of 36%. The level of production peaked at $167.1B in 2019; however, from 2020 to 2024, production failed to regain momentum.
Production By Country
The country with the largest volume of footwear production was China (11B pairs), accounting for 66% of total volume. Moreover, footwear production in China exceeded the figures recorded by the second-largest producer, Vietnam (1.1B pairs), tenfold. The third position in this ranking was held by India (988M pairs), with a 6.1% share.
In China, footwear production decreased by an average annual rate of -1.4% over the period from 2013-2024. In the other countries, the average annual rates were as follows: Vietnam (+5.1% per year) and India (+5.5% per year).
Production By Type
The products with the highest volumes of production in 2024 were footwear of rubber or plastics, not waterproof, not sports, without a metal toe-cap (8.2B pairs), footwear with uppers of textile materials (4.9B pairs) and leather footwear (2.7B pairs), with a combined 97% share of the total output.
From 2013 to 2024, the most notable rate of growth in terms of production, amongst the leading produced products, was attained by footwear with uppers of textile materials (with a CAGR of +2.1%), while production for the other products experienced a decline in the production figures.
In value terms, leather footwear ($58.2B), footwear of rubber or plastics, not waterproof, not sports, without a metal toe-cap ($45B) and footwear with uppers of textile materials ($33.9B) were the products with the highest levels of production in 2024, with a combined 98% share of the total output.
Footwear with uppers of textile materials, with a CAGR of +5.1%, recorded the highest rates of growth with regard to market size among the main produced products over the period under review, while production for the other products experienced more modest paces of growth.
Imports
Asia's Imports of Footwear
In 2024, after three years of growth, there was decline in overseas purchases of footwear, when their volume decreased by -0.4% to 2.1B pairs. In general, imports, however, continue to indicate a relatively flat trend pattern. The pace of growth appeared the most rapid in 2021 with an increase of 26%. The volume of import peaked at 2.2B pairs in 2017; however, from 2018 to 2024, imports stood at a somewhat lower figure.
In value terms, footwear imports fell modestly to $24.4B in 2024. The total import value increased at an average annual rate of +2.2% over the period from 2013 to 2024; the trend pattern indicated some noticeable fluctuations being recorded throughout the analyzed period. The most prominent rate of growth was recorded in 2022 when imports increased by 16% against the previous year. The level of import peaked at $25.3B in 2023, and then declined slightly in the following year.
Imports By Country
In 2024, Japan (569M pairs) represented the largest importer of footwear, constituting 27% of total imports. China (193M pairs) took the second position in the ranking, followed by South Korea (135M pairs), the United Arab Emirates (131M pairs), Thailand (123M pairs) and Iraq (102M pairs). All these countries together took near 32% share of total imports. The following importers - Malaysia (85M pairs), India (81M pairs), Hong Kong SAR (80M pairs) and Taiwan (Chinese) (79M pairs) - each recorded a 15% share of total imports.
From 2013 to 2024, average annual rates of growth with regard to footwear imports into Japan stood at +4.6%. At the same time, China (+12.6%), Thailand (+7.0%), Malaysia (+5.7%), Iraq (+3.9%), South Korea (+3.2%) and Taiwan (Chinese) (+2.4%) displayed positive paces of growth. Moreover, China emerged as the fastest-growing importer imported in Asia, with a CAGR of +12.6% from 2013-2024. By contrast, India (-3.0%), the United Arab Emirates (-8.1%) and Hong Kong SAR (-12.0%) illustrated a downward trend over the same period. Japan (+9.5 p.p.), China (+6.4 p.p.), Thailand (+2.9 p.p.), Malaysia (+1.7 p.p.) and South Korea (+1.6 p.p.) significantly strengthened its position in terms of the total imports, while India, the United Arab Emirates and Hong Kong SAR saw its share reduced by -1.8%, -10.1% and -12.3% from 2013 to 2024, respectively. The shares of the other countries remained relatively stable throughout the analyzed period.
In value terms, China ($5.6B), Japan ($3.9B) and South Korea ($2.8B) constituted the countries with the highest levels of imports in 2024, together comprising 50% of total imports.
Among the main importing countries, China, with a CAGR of +11.9%, recorded the highest rates of growth with regard to the value of imports, over the period under review, while purchases for the other leaders experienced more modest paces of growth.
Imports By Type
Footwear of rubber or plastics, not waterproof, not sports, without a metal toe-cap (940M pairs) and footwear with uppers of textile materials (886M pairs) represented the key types of footwear in 2024, amounting to near 44% and 41% of total imports, respectively. It was distantly followed by leather footwear (280M pairs), comprising a 13% share of total imports. Waterproof footwear (38M pairs) held a relatively small share of total imports.
From 2013 to 2024, the most notable rate of growth in terms of purchases, amongst the main imported products, was attained by footwear with uppers of textile materials (with a CAGR of +5.4%), while imports for the other products experienced a decline in the imports figures.
In value terms, leather footwear ($9.9B), footwear of rubber or plastics, not waterproof, not sports, without a metal toe-cap ($7.4B) and footwear with uppers of textile materials ($6.9B) appeared to be the products with the highest levels of imports in 2024, together accounting for 99% of total imports.
Among the main imported products, footwear with uppers of textile materials, with a CAGR of +6.2%, saw the highest rates of growth with regard to the value of imports, over the period under review, while purchases for the other products experienced more modest paces of growth.
Import Prices By Type
In 2024, the import price in Asia amounted to $11 per pair, which is down by -3.3% against the previous year. Over the last eleven-year period, it increased at an average annual rate of +1.7%. The most prominent rate of growth was recorded in 2018 when the import price increased by 20% against the previous year. Over the period under review, import prices reached the peak figure at $13 per pair in 2022; however, from 2023 to 2024, import prices remained at a lower figure.
Prices varied noticeably by the product type; the product with the highest price was leather footwear ($36 per pair), while the price for waterproof footwear ($6 per pair) was amongst the lowest.
From 2013 to 2024, the most notable rate of growth in terms of prices was attained by leather footwear (+4.1%), while the other products experienced more modest paces of growth.
Import Prices By Country
In 2024, the import price in Asia amounted to $11 per pair, shrinking by -3.3% against the previous year. Over the period from 2013 to 2024, it increased at an average annual rate of +1.7%. The most prominent rate of growth was recorded in 2018 when the import price increased by 20% against the previous year. The level of import peaked at $13 per pair in 2022; however, from 2023 to 2024, import prices stood at a somewhat lower figure.
There were significant differences in the average prices amongst the major importing countries. In 2024, amid the top importers, the country with the highest price was China ($29 per pair), while Thailand ($4.2 per pair) was amongst the lowest.
From 2013 to 2024, the most notable rate of growth in terms of prices was attained by the United Arab Emirates (+10.9%), while the other leaders experienced more modest paces of growth.
Exports
Asia's Exports of Footwear
In 2024, the amount of footwear exported in Asia totaled 11B pairs, surging by 2.1% compared with the previous year's figure. Over the period under review, exports, however, showed a relatively flat trend pattern. The pace of growth was the most pronounced in 2015 with an increase of 98%. The volume of export peaked at 11B pairs in 2013; however, from 2014 to 2024, the exports remained at a lower figure.
In value terms, footwear exports dropped modestly to $72.6B in 2024. The total export value increased at an average annual rate of +1.8% over the period from 2013 to 2024; however, the trend pattern indicated some noticeable fluctuations being recorded throughout the analyzed period. The growth pace was the most rapid in 2021 when exports increased by 22%. The level of export peaked at $84.7B in 2022; however, from 2023 to 2024, the exports failed to regain momentum.
Exports By Country
China dominates exports structure, resulting at 8.8B pairs, which was approx. 83% of total exports in 2024. It was distantly followed by Vietnam (878M pairs), creating an 8.2% share of total exports. The following exporters - Turkey (228M pairs) and India (193M pairs) - each accounted for a 4% share of total exports.
Exports from China decreased at an average annual rate of -1.0% from 2013 to 2024. At the same time, Vietnam (+5.9%), India (+3.6%) and Turkey (+3.5%) displayed positive paces of growth. Moreover, Vietnam emerged as the fastest-growing exporter exported in Asia, with a CAGR of +5.9% from 2013-2024. From 2013 to 2024, the share of Vietnam increased by +4.1 percentage points. The shares of the other countries remained relatively stable throughout the analyzed period.
In value terms, China ($43.4B) remains the largest footwear supplier in Asia, comprising 60% of total exports. The second position in the ranking was taken by Vietnam ($18.4B), with a 25% share of total exports. It was followed by India, with a 2.3% share.
In China, footwear exports remained relatively stable over the period from 2013-2024. In the other countries, the average annual rates were as follows: Vietnam (+8.5% per year) and India (-1.1% per year).
Exports By Type
Footwear of rubber or plastics, not waterproof, not sports, without a metal toe-cap was the key type of footwear in Asia, with the volume of exports amounting to 6B pairs, which was near 56% of total exports in 2024. Footwear with uppers of textile materials (3.4B pairs) ranks second in terms of the total exports with a 32% share, followed by leather footwear (10%).
From 2013 to 2024, the most notable rate of growth in terms of shipments, amongst the key exported products, was attained by footwear with uppers of textile materials (with a CAGR of +2.0%), while the other products experienced mixed trends in the exports figures.
In value terms, footwear of rubber or plastics, not waterproof, not sports, without a metal toe-cap ($29.4B), leather footwear ($22.7B) and footwear with uppers of textile materials ($19.7B) constituted the products with the highest levels of exports in 2024, together accounting for 99% of total exports.
Footwear with uppers of textile materials, with a CAGR of +4.4%, recorded the highest growth rate of the value of exports, in terms of the main exported products over the period under review, while shipments for the other products experienced mixed trends in the exports figures.
Export Prices By Type
In 2024, the export price in Asia amounted to $6.8 per pair, reducing by -6.1% against the previous year. Overall, the export price, however, enjoyed notable growth. The pace of growth was the most pronounced in 2018 when the export price increased by 161% against the previous year. As a result, the export price reached the peak level of $15 per pair. From 2019 to 2024, the export prices remained at a lower figure.
There were significant differences in the average prices amongst the major exported products. In 2024, the product with the highest price was leather footwear ($21 per pair), while the average price for exports of footwear of rubber or plastics, not waterproof, not sports, without a metal toe-cap ($4.9 per pair) was amongst the lowest.
From 2013 to 2024, the most notable rate of growth in terms of prices was attained by footwear of rubber or plastics, not waterproof, not sports, without a metal toe-cap (+3.2%), while the other products experienced more modest paces of growth.
Export Prices By Country
In 2024, the export price in Asia amounted to $6.8 per pair, which is down by -6.1% against the previous year. Over the period under review, the export price, however, posted a tangible expansion. The pace of growth was the most pronounced in 2018 an increase of 161% against the previous year. As a result, the export price reached the peak level of $15 per pair. From 2019 to 2024, the export prices failed to regain momentum.
There were significant differences in the average prices amongst the major exporting countries. In 2024, amid the top suppliers, the country with the highest price was Vietnam ($21 per pair), while Turkey ($4.1 per pair) was amongst the lowest.
From 2013 to 2024, the most notable rate of growth in terms of prices was attained by Vietnam (+2.4%), while the other leaders experienced more modest paces of growth.
This report provides a comprehensive view of the footwear industry in Asia, tracking demand, supply, and trade flows across the regional value chain. It explains how demand across key channels and end-use segments shapes consumption patterns, while also mapping the role of input availability, production efficiency, and regulatory standards on supply.
Beyond headline metrics, the study benchmarks prices, margins, and trade routes so you can see where value is created and how it moves between exporters and importers within Asia. The analysis is designed to support strategic planning, market entry, portfolio prioritization, and risk management in the footwear landscape in Asia.
Quick navigation
- Key findings
- Report scope
- Product coverage
- Country coverage
- Methodology
- Forecasts to 2035
- Price analysis
- Market participants
- Country profiles
- How to use this report
- FAQ
Key findings
- Regional demand is shaped by both household and industrial usage, with trade flows linking supply hubs to import-reliant countries.
- Pricing dynamics reflect unit values, freight costs, exchange rates, and regulatory shifts that affect sourcing decisions.
- Supply depends on input availability and production efficiency, creating distinct cost curves across Asia.
- Market concentration varies by country, creating different competitive landscapes and entry barriers.
- The 2035 outlook highlights where capacity investment and demand growth are most aligned within the region.
Report scope
The report combines market sizing with trade intelligence and price analytics for Asia. It covers both historical performance and the forward outlook to 2035, allowing you to compare cycles, structural shifts, and policy impacts across countries and sub-regions.
- Market size and growth in value and volume terms
- Consumption structure by end-use segments and countries
- Production capacity, output, and cost dynamics
- Regional trade flows, exporters, importers, and balances
- Price benchmarks, unit values, and margin signals
- Competitive context and market entry conditions
Product coverage
- Prodcom 15201444 - Slippers and other indoor footwear (including dancing and bedroom slippers, mules) with uppers of textile materials
- Prodcom 15201445 - Footwear with rubber, plastic or leather outer soles and textile uppers (excluding slippers and other indoor footwear, sports footwear)
- Prodcom 15201446 - Footwear with textile uppers (excluding slippers and other indoor footwear as well as footwear with outer soles of rubber, plastics, leather or composition leather)
- Prodcom 15201330 - Footwear with a wooden base and leather uppers (including clogs) (excluding with an inner sole or a protective metal toecap)
- Prodcom 15201351 - Men
- Prodcom 15201352 - Women
- Prodcom 15201353 - Children
- Prodcom 15201361 - Men
- Prodcom 15201362 - Women
- Prodcom 15201363 - Children
- Prodcom 15201370 - Slippers and other indoor footwear with rubber, plastic or leather outer soles and leather uppers (including dancing and bedroom slippers, mules)
- Prodcom 15201380 - Footwear with wood, cork or other outer soles and leather uppers (excluding outer soles of rubber, plastics or leather)
- Prodcom 15201210 - Sandals with rubber or plastic outer soles and uppers (including thong-type sandals, flip flops)
- Prodcom 15201231 - Town footwear with rubber or plastic uppers
- Prodcom 15201237 - Slippers and other indoor footwear with rubber or plastic outer soles and plastic uppers (including bedroom and dancing slippers, mules)
- Prodcom 15201100 - Waterproof footwear, with uppers in rubber or plastics (excluding incorporating a protective metal toecap)
Country coverage
- Afghanistan
- Armenia
- Azerbaijan
- Bahrain
- Bangladesh
- Bhutan
- Brunei Darussalam
- Cambodia
- China
- Cyprus
- Democratic People's Republic of Korea
- Georgia
- Hong Kong SAR
- India
- Indonesia
- Iran
- Iraq
- Israel
- Japan
- Jordan
- Kazakhstan
- Kuwait
- Kyrgyzstan
- Lao People's Democratic Republic
- Lebanon
- Macao SAR
- Malaysia
- Maldives
- Mongolia
- Myanmar
- Nepal
- Oman
- Pakistan
- Palestine
- Philippines
- Qatar
- Saudi Arabia
- Singapore
- South Korea
- Sri Lanka
- Syrian Arab Republic
- Taiwan (Chinese)
- Tajikistan
- Thailand
- Timor-Leste
- Turkey
- Turkmenistan
- United Arab Emirates
- Uzbekistan
- Vietnam
- Yemen
Country profiles and benchmarks
For the regional report, country profiles provide a consistent view of market size, trade balance, prices, and per-capita indicators across Asia. The profiles highlight the largest consuming and producing markets and allow direct benchmarking across peers.
Methodology
The analysis is built on a multi-source framework that combines official statistics, trade records, company disclosures, and expert validation. Data are standardized, reconciled, and cross-checked to ensure consistency across time series.
- International trade data (exports, imports, and mirror statistics)
- National production and consumption statistics
- Company-level information from financial filings and public releases
- Price series and unit value benchmarks
- Analyst review, outlier checks, and time-series validation
All data are normalized to a common product definition and mapped to a consistent set of codes. This ensures that comparisons across time are aligned and actionable.
Forecasts to 2035
The forecast horizon extends to 2035 and is based on a structured model that links footwear demand and supply to macroeconomic indicators, trade patterns, and sector-specific drivers. The model captures both cyclical and structural factors and reflects known policy and technology shifts within Asia.
- Historical baseline: 2012-2025
- Forecast horizon: 2026-2035
- Scenario-based sensitivity to income growth, substitution, and regulation
- Capacity and investment outlook for major producing countries
Each country projection is built from its own historical pattern and the regional context, allowing the report to show where growth is concentrated and where risks are elevated.
Price analysis and trade dynamics
Prices are analyzed in detail, including export and import unit values, regional spreads, and changes in trade costs. The report highlights how seasonality, freight rates, exchange rates, and supply disruptions influence pricing and margins.
- Price benchmarks by country and sub-region
- Export and import unit value trends
- Seasonality and calendar effects in trade flows
- Price outlook to 2035 under baseline assumptions
Profiles of market participants
Key producers, exporters, and distributors are profiled with a focus on their operational scale, geographic footprint, product mix, and market positioning. This helps identify competitive pressure points, partnership opportunities, and routes to differentiation.
- Business focus and production capabilities
- Geographic reach and distribution networks
- Cost structure and pricing strategy indicators
- Compliance, certification, and sustainability context
How to use this report
- Quantify regional demand and identify the most attractive country markets
- Evaluate export opportunities and prioritize target destinations
- Track price dynamics and protect margins
- Benchmark performance against regional competitors
- Build evidence-based forecasts for investment decisions
This report is designed for manufacturers, distributors, importers, wholesalers, investors, and advisors who need a clear, data-driven picture of footwear dynamics in Asia.
FAQ
What is included in the footwear market in Asia?
The market size aggregates consumption and trade data at country and sub-regional levels, presented in both value and volume terms.
How are the forecasts to 2035 built?
The projections combine historical trends with macroeconomic indicators, trade dynamics, and sector-specific drivers.
Does the report cover prices and margins?
Yes, it includes export and import unit values, regional spreads, and a pricing outlook to 2035.
Which countries are profiled in detail?
The report provides profiles for the largest consuming and producing countries in Asia.
Can this report support market entry decisions?
Yes, it highlights demand hotspots, trade routes, pricing trends, and competitive context.
-
1. INTRODUCTION
Making Data-Driven Decisions to Grow Your Business
- REPORT DESCRIPTION
- RESEARCH METHODOLOGY AND THE AI PLATFORM
- DATA-DRIVEN DECISIONS FOR YOUR BUSINESS
- GLOSSARY AND SPECIFIC TERMS
-
2. EXECUTIVE SUMMARY
A Quick Overview of Market Performance
- KEY FINDINGS
- MARKET TRENDS This Chapter is Available Only for the Professional Edition PRO
-
3. MARKET OVERVIEW
Understanding the Current State of The Market and its Prospects
- MARKET SIZE: HISTORICAL DATA (2012–2025) AND FORECAST (2026–2035)
- CONSUMPTION BY COUNTRY: HISTORICAL DATA (2012–2025) AND FORECAST (2026–2035)
- CONSUMPTION BY TYPE: HISTORICAL DATA (2012–2025) AND FORECAST (2026–2035)
- MARKET FORECAST TO 2035
-
4. MOST PROMISING PRODUCTS FOR DIVERSIFICATION
Finding New Products to Diversify Your Business
- TOP PRODUCTS TO DIVERSIFY YOUR BUSINESS
- BEST-SELLING PRODUCTS
- MOST CONSUMED PRODUCTS
- MOST TRADED PRODUCTS
- MOST PROFITABLE PRODUCTS FOR EXPORT
-
5. MOST PROMISING SUPPLYING COUNTRIES
Choosing the Best Countries to Establish Your Sustainable Supply Chain
- TOP COUNTRIES TO SOURCE YOUR PRODUCT
- TOP PRODUCING COUNTRIES
- TOP EXPORTING COUNTRIES
- LOW-COST EXPORTING COUNTRIES
-
6. MOST PROMISING OVERSEAS MARKETS
Choosing the Best Countries to Boost Your Export
- TOP OVERSEAS MARKETS FOR EXPORTING YOUR PRODUCT
- TOP CONSUMING MARKETS
- UNSATURATED MARKETS
- TOP IMPORTING MARKETS
- MOST PROFITABLE MARKETS
-
7. PRODUCTION
The Latest Trends and Insights into The Industry
- PRODUCTION VOLUME AND VALUE: HISTORICAL DATA (2012–2025) AND FORECAST (2026–2035)
- PRODUCTION BY TYPE: HISTORICAL DATA (2012–2025) AND FORECAST (2026–2035)
- PRODUCTION BY COUNTRY: HISTORICAL DATA (2012–2025) AND FORECAST (2026–2035)
-
8. IMPORTS
The Largest Import Supplying Countries
- IMPORTS: HISTORICAL DATA (2012–2025) AND FORECAST (2026–2035)
- IMPORTS BY TYPE: HISTORICAL DATA (2012–2025) AND FORECAST (2026–2035)
- IMPORTS BY COUNTRY: HISTORICAL DATA (2012–2025) AND FORECAST (2026–2035)
- IMPORT PRICES BY TYPE AND COUNTRY: HISTORICAL DATA (2012–2025) AND FORECAST (2026–2035)
-
9. EXPORTS
The Largest Destinations for Exports
- EXPORTS: HISTORICAL DATA (2012–2025) AND FORECAST (2026–2035)
- EXPORTS BY TYPE: HISTORICAL DATA (2012–2025) AND FORECAST (2026–2035)
- EXPORTS BY COUNTRY: HISTORICAL DATA (2012–2025) AND FORECAST (2026–2035)
- EXPORT PRICES BY TYPE AND COUNTRY: HISTORICAL DATA (2012–2025) AND FORECAST (2026–2035)
-
10. PROFILES OF MAJOR PRODUCERS
The Largest Producers on The Market and Their Profiles
-
11. COUNTRY PROFILES
The Largest Markets And Their Profiles
This Chapter is Available Only for the Professional Edition PRO- 11.1Afghanistan
- Market Size
- Production
- Imports
- Exports
- 11.2Armenia
- Market Size
- Production
- Imports
- Exports
- 11.3Azerbaijan
- Market Size
- Production
- Imports
- Exports
- 11.4Bahrain
- Market Size
- Production
- Imports
- Exports
- 11.5Bangladesh
- Market Size
- Production
- Imports
- Exports
- 11.6Bhutan
- Market Size
- Production
- Imports
- Exports
- 11.7Brunei Darussalam
- Market Size
- Production
- Imports
- Exports
- 11.8Cambodia
- Market Size
- Production
- Imports
- Exports
- 11.9China
- Market Size
- Production
- Imports
- Exports
- 11.10Hong Kong SAR
- Market Size
- Production
- Imports
- Exports
- 11.11Macao SAR
- Market Size
- Production
- Imports
- Exports
- 11.12Cyprus
- Market Size
- Production
- Imports
- Exports
- 11.13Georgia
- Market Size
- Production
- Imports
- Exports
- 11.14India
- Market Size
- Production
- Imports
- Exports
- 11.15Indonesia
- Market Size
- Production
- Imports
- Exports
- 11.16Iran
- Market Size
- Production
- Imports
- Exports
- 11.17Iraq
- Market Size
- Production
- Imports
- Exports
- 11.18Israel
- Market Size
- Production
- Imports
- Exports
- 11.19Japan
- Market Size
- Production
- Imports
- Exports
- 11.20Jordan
- Market Size
- Production
- Imports
- Exports
- 11.21Kazakhstan
- Market Size
- Production
- Imports
- Exports
- 11.22Kuwait
- Market Size
- Production
- Imports
- Exports
- 11.23Kyrgyzstan
- Market Size
- Production
- Imports
- Exports
- 11.24Lebanon
- Market Size
- Production
- Imports
- Exports
- 11.25Malaysia
- Market Size
- Production
- Imports
- Exports
- 11.26Maldives
- Market Size
- Production
- Imports
- Exports
- 11.27Mongolia
- Market Size
- Production
- Imports
- Exports
- 11.28Myanmar
- Market Size
- Production
- Imports
- Exports
- 11.29Nepal
- Market Size
- Production
- Imports
- Exports
- 11.30Oman
- Market Size
- Production
- Imports
- Exports
- 11.31Pakistan
- Market Size
- Production
- Imports
- Exports
- 11.32Palestine
- Market Size
- Production
- Imports
- Exports
- 11.33Philippines
- Market Size
- Production
- Imports
- Exports
- 11.34Qatar
- Market Size
- Production
- Imports
- Exports
- 11.35Saudi Arabia
- Market Size
- Production
- Imports
- Exports
- 11.36Singapore
- Market Size
- Production
- Imports
- Exports
- 11.37South Korea
- Market Size
- Production
- Imports
- Exports
- 11.38Sri Lanka
- Market Size
- Production
- Imports
- Exports
- 11.39Syrian Arab Republic
- Market Size
- Production
- Imports
- Exports
- 11.40Taiwan (Chinese)
- Market Size
- Production
- Imports
- Exports
- 11.41Tajikistan
- Market Size
- Production
- Imports
- Exports
- 11.42Thailand
- Market Size
- Production
- Imports
- Exports
- 11.43Timor-Leste
- Market Size
- Production
- Imports
- Exports
- 11.44Turkey
- Market Size
- Production
- Imports
- Exports
- 11.45Turkmenistan
- Market Size
- Production
- Imports
- Exports
- 11.46United Arab Emirates
- Market Size
- Production
- Imports
- Exports
- 11.47Uzbekistan
- Market Size
- Production
- Imports
- Exports
- 11.48Vietnam
- Market Size
- Production
- Imports
- Exports
- 11.49Yemen
- Market Size
- Production
- Imports
- Exports
- 11.50Lao People's Democratic Republic
- Market Size
- Production
- Imports
- Exports
- 11.51Democratic People's Republic of Korea
- Market Size
- Production
- Imports
- Exports
-
LIST OF TABLES
- Key Findings In 2025
- Market Volume, In Physical Terms: Historical Data (2012–2025) and Forecast (2026–2035)
- Market Value: Historical Data (2012–2025) and Forecast (2026–2035)
- Per Capita Consumption, by Country, 2022–2025
- Consumption, in Physical and Value Terms, by Type: Historical Data (2012–2025) and Forecast (2026–2035)
- Production, in Physical and Value Terms, by Type: Historical Data (2012–2025) and Forecast (2026–2035)
- Production, In Physical Terms, By Country: Historical Data (2012–2025) and Forecast (2026–2035)
- Imports, in Physical and Value Terms, by Type: Historical Data (2012–2025) and Forecast (2026–2035)
- Imports, in Physical Terms, by Country: Historical Data (2012–2025) and Forecast (2026–2035)
- Imports, in Value Terms, by Country: Historical Data (2012–2025) and Forecast (2026–2035)
- Import Prices, by Country: Historical Data (2012–2025) and Forecast (2026–2035)
- Import Prices, by Type: Historical Data (2012–2025) and Forecast (2026–2035)
- Exports, in Physical and Value Terms, by Type: Historical Data (2012–2025) and Forecast (2026–2035)
- Exports, in Physical Terms, by Country: Historical Data (2012–2025) and Forecast (2026–2035)
- Exports, in Value Terms, by Country: Historical Data (2012–2025) and Forecast (2026–2035)
- Export Prices, by Country: Historical Data (2012–2025) and Forecast (2026–2035)
- Export Prices, by Type: Historical Data (2012–2025) and Forecast (2026–2035)
-
LIST OF FIGURES
- Market Volume, in Physical Terms: Historical Data (2012–2025) and Forecast (2026–2035)
- Market Value: Historical Data (2012–2025) and Forecast (2026–2035)
- Consumption, by Country, 2025
- Consumption, By Type, 2025
- Consumption, in Physical Terms, by Type: Historical Data (2012–2025) and Forecast (2026–2035)
- Consumption, in Value Terms, by Type: Historical Data (2012–2025) and Forecast (2026–2035)
- Consumption, Per Capita, by Type: Historical Data (2012–2025) and Forecast (2026–2035)
- Market Volume Forecast to 2035
- Market Value Forecast to 2035
- Market Size and Growth, by Product
- Average Per Capita Consumption, by Product
- Exports and Growth, by Product
- Export Prices and Growth, by Product
- Production Volume and Growth
- Exports and Growth
- Export Prices and Growth
- Market Size and Growth
- Per Capita Consumption
- Imports and Growth
- Import Prices
- Production, in Physical Terms: Historical Data (2012–2025) and Forecast (2026–2035)
- Production, in Value Terms: Historical Data (2012–2025) and Forecast (2026–2035)
- Production, By Type, 2025
- Production, in Physical Terms, by Type: Historical Data (2012–2025) and Forecast (2026–2035)
- Production, in Value Terms, by Type: Historical Data (2012–2025) and Forecast (2026–2035)
- Production, in Physical Terms, by Country: Historical Data (2012–2025) and Forecast (2026–2035)
- Imports, in Physical Terms: Historical Data (2012–2025) and Forecast (2026–2035)
- Imports, in Value Terms: Historical Data (2012–2025) and Forecast (2026–2035)
- Imports, By Type, 2025
- Imports, in Physical Terms, by Type: Historical Data (2012–2025) and Forecast (2026–2035)
- Imports, in Value Terms, by Type: Historical Data (2012–2025) and Forecast (2026–2035)
- Imports, in Physical Terms, by Country, 2025
- Imports, in Physical Terms, by Country: Historical Data (2012–2025) and Forecast (2026–2035)
- Imports, in Value Terms, by Country: Historical Data (2012–2025) and Forecast (2026–2035)
- Import Prices, by Country: Historical Data (2012–2025) and Forecast (2026–2035)
- Import Prices, by Type: Historical Data (2012–2025) and Forecast (2026–2035)
- Exports, in Physical Terms: Historical Data (2012–2025) and Forecast (2026–2035)
- Exports, in Value Terms: Historical Data (2012–2025) and Forecast (2026–2035)
- Exports, By Type, 2025
- Exports, in Physical Terms, by Type: Historical Data (2012–2025) and Forecast (2026–2035)
- Exports, in Value Terms, by Type: Historical Data (2012–2025) and Forecast (2026–2035)
- Exports, in Physical Terms, by Country, 2025
- Exports, in Physical Terms, by Country: Historical Data (2012–2025) and Forecast (2026–2035)
- Exports, in Value Terms, by Country: Historical Data (2012–2025) and Forecast (2026–2035)
- Export Prices, by Country: Historical Data (2012–2025) and Forecast (2026–2035)
- Export Prices, by Type: Historical Data (2012–2025) and Forecast (2026–2035)
Recommended posts
Free Data: Footwear - Asia
Instant access. No credit card needed.


