Latin America and the Caribbean - Electrical Transformers with Liquid Dielectric, of Power Handling Capacity over 10000 kVA - Market Analysis, Forecast, Size, Trends And Insights
Get instant access to more than 2 million reports, dashboards, and datasets on the IndexBox Platform.
View PricingLatin America and the Caribbean’s Transformer Market Forecast for Slight Growth With a 0.1% Volume CAGR Through 2035
IndexBox has just published a new report: Latin America and the Caribbean - Electrical Transformers with Liquid Dielectric, of Power Handling Capacity over 10000 kVA - Market Analysis, Forecast, Size, Trends And Insights.
The article provides a comprehensive market analysis for high-capacity liquid dielectric transformers in Latin America and the Caribbean. It reports that in 2024, market consumption was 145K units (valued at $179.8B), led by Brazil. The market is forecast for modest growth to 147K units (CAGR +0.1%) and $189.7B (CAGR +0.5%) by 2035. Production is concentrated in Brazil, Colombia, and Peru. Imports fell sharply in volume in 2024 but rose in average price, with Chile as the leading importer. Exports grew in value, led by Mexico and Brazil, with Brazil achieving the highest average export price.
Key Findings
- Market forecast shows minimal volume growth (CAGR +0.1%) to 147K units by 2035, but stronger value growth (CAGR +0.5%) to $189.7B
- Brazil dominates the region, accounting for 64% of consumption volume and 79% of market value in 2024
- Import volume plummeted by 70.5% in 2024, but the average import price surged by 165% to $188K per unit
- Export value soared to $1B in 2024, with Brazil commanding the highest average export price at $2.2 million per unit
- Chile emerged as the leading importer by volume, while Mexico was the largest exporter by volume but at a lower average price
Market Forecast
Driven by rising demand for electrical transformers with liquid dielectric, of power handling capacity over 10000 kVA in Latin America and the Caribbean, the market is expected to start an upward consumption trend over the next decade. The performance of the market is forecast to increase slightly, with an anticipated CAGR of +0.1% for the period from 2024 to 2035, which is projected to bring the market volume to 147K units by the end of 2035.
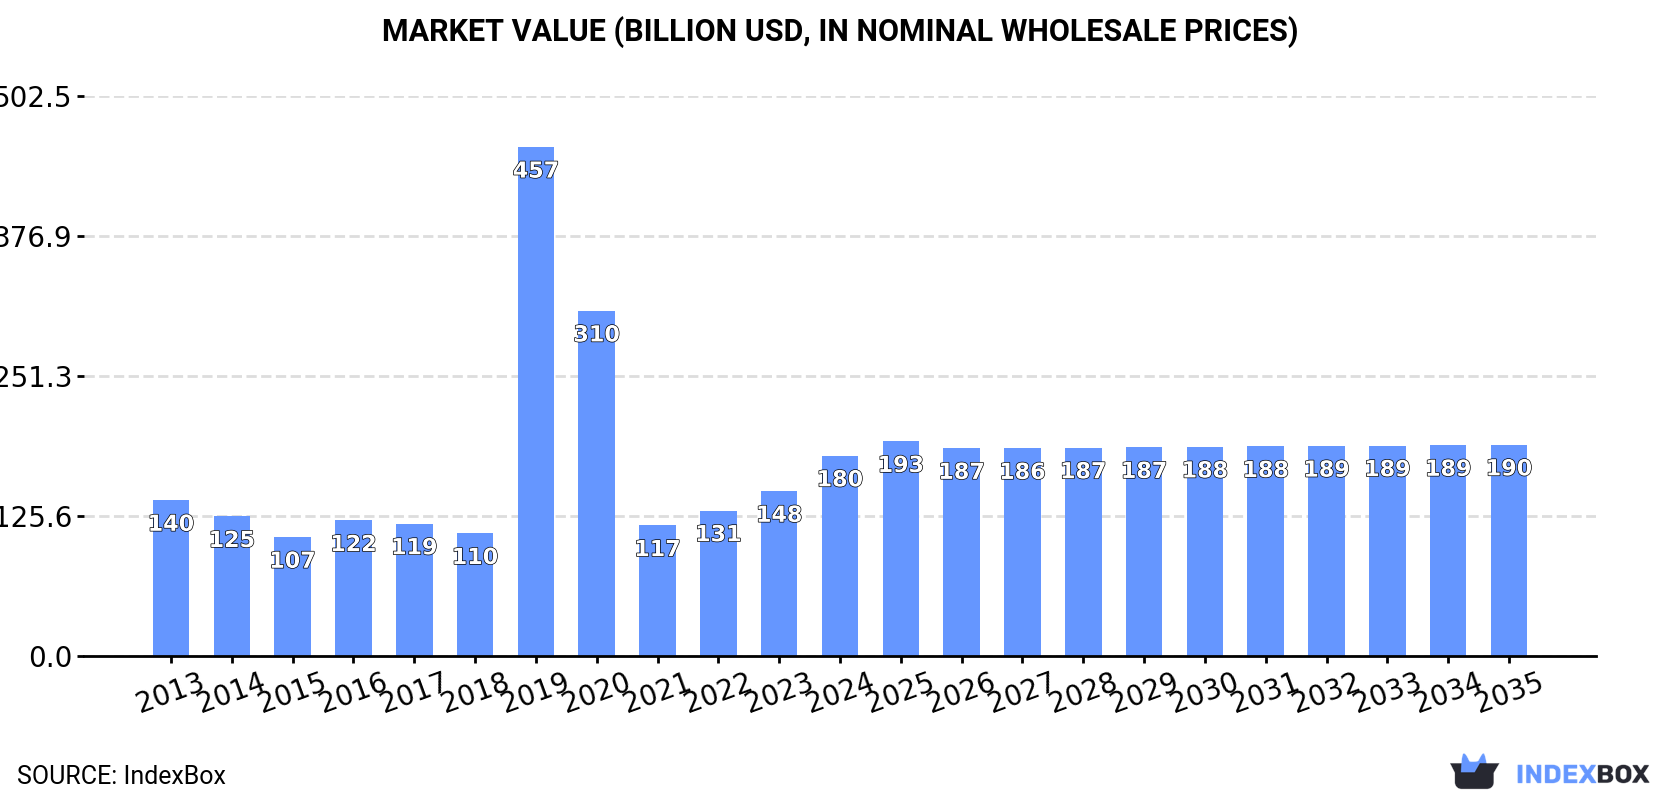
In value terms, the market is forecast to increase with an anticipated CAGR of +0.5% for the period from 2024 to 2035, which is projected to bring the market value to $189.7B (in nominal wholesale prices) by the end of 2035.
Consumption
Latin America and the Caribbean's Consumption of Electrical Transformers with Liquid Dielectric, of Power Handling Capacity over 10000 kVA
In 2024, consumption of electrical transformers with liquid dielectric, of power handling capacity over 10000 kVA decreased by -2.9% to 145K units for the first time since 2021, thus ending a two-year rising trend. In general, consumption showed a slight contraction. As a result, consumption reached the peak volume of 1.4M units. From 2020 to 2024, the growth of the consumption of remained at a somewhat lower figure.
The value of the market for electrical transformers with liquid dielectric, of power handling capacity over 10000 kVA in Latin America and the Caribbean skyrocketed to $179.8B in 2024, picking up by 21% against the previous year. This figure reflects the total revenues of producers and importers (excluding logistics costs, retail marketing costs, and retailers' margins, which will be included in the final consumer price). Overall, consumption, however, recorded a notable increase. As a result, consumption attained the peak level of $456.9B. From 2020 to 2024, the growth of the market remained at a lower figure.
Consumption By Country
The country with the largest volume of consumption of electrical transformers with liquid dielectric, of power handling capacity over 10000 kVA was Brazil (93K units), comprising approx. 64% of total volume. Moreover, consumption of electrical transformers with liquid dielectric, of power handling capacity over 10000 kVA in Brazil exceeded the figures recorded by the second-largest consumer, Colombia (20K units), fivefold. The third position in this ranking was held by Peru (14K units), with a 9.4% share.
From 2013 to 2024, the average annual rate of growth in terms of volume in Brazil totaled -2.1%. In the other countries, the average annual rates were as follows: Colombia (-1.6% per year) and Peru (-1.3% per year).
In value terms, Brazil ($142.4B) led the market, alone. The second position in the ranking was taken by Colombia ($20.7B). It was followed by Peru.
In Brazil, the market of electrical transformers with liquid dielectric, of power handling capacity over 10000 kVA expanded at an average annual rate of +2.2% over the period from 2013-2024. In the other countries, the average annual rates were as follows: Colombia (+3.8% per year) and Peru (+1.3% per year).
The countries with the highest levels of electrical transformers with liquid dielectric, of power handling capacity over 10000 kVA per capita consumption in 2024 were Costa Rica (1,070 units per million persons), Nicaragua (655 units per million persons) and Honduras (451 units per million persons).
From 2013 to 2024, the most notable rate of growth in terms of kVA, amongst the leading consuming countries, was attained by Nicaragua (with a CAGR of -1.2%), while kVA for the other leaders experienced a decline in the per capita consumption figures.
Production
Latin America and the Caribbean's Production of Electrical Transformers with Liquid Dielectric, of Power Handling Capacity over 10000 kVA
In 2024, the amount of electrical transformers with liquid dielectric, of power handling capacity over 10000 kVA produced in Latin America and the Caribbean reduced to 144K units, stabilizing at 2023. In general, production saw a slight descent. The pace of growth appeared the most rapid in 2019 with an increase of 9.8% against the previous year. Over the period under review, production of attained the peak volume at 175K units in 2013; however, from 2014 to 2024, production remained at a lower figure.
In value terms, production of electrical transformers with liquid dielectric, of power handling capacity over 10000 kVA soared to $194.5B in 2024 estimated in export price. The total production indicated tangible growth from 2013 to 2024: its value increased at an average annual rate of +3.3% over the last eleven-year period. The trend pattern, however, indicated some noticeable fluctuations being recorded throughout the analyzed period. Based on 2024 figures, production increased by +69.8% against 2021 indices. As a result, production reached the peak level and is likely to continue growth in the immediate term.
Production By Country
Brazil (93K units) constituted the country with the largest volume of production of electrical transformers with liquid dielectric, of power handling capacity over 10000 kVA, accounting for 65% of total volume. Moreover, production of electrical transformers with liquid dielectric, of power handling capacity over 10000 kVA in Brazil exceeded the figures recorded by the second-largest producer, Colombia (20K units), fivefold. Peru (14K units) ranked third in terms of total production with a 9.5% share.
From 2013 to 2024, the average annual rate of growth in terms of volume in Brazil stood at -2.1%. In the other countries, the average annual rates were as follows: Colombia (-1.6% per year) and Peru (-1.2% per year).
Imports
Latin America and the Caribbean's Imports of Electrical Transformers with Liquid Dielectric, of Power Handling Capacity over 10000 kVA
In 2024, imports of electrical transformers with liquid dielectric, of power handling capacity over 10000 kva in Latin America and the Caribbean shrank rapidly to 1.5K units, which is down by -70.5% on the previous year. Overall, imports, however, continue to indicate a perceptible expansion. The most prominent rate of growth was recorded in 2019 with an increase of 3,628% against the previous year. As a result, imports reached the peak of 1.2M units. From 2020 to 2024, the growth of imports of remained at a somewhat lower figure.
In value terms, imports of electrical transformers with liquid dielectric, of power handling capacity over 10000 kVA dropped rapidly to $286M in 2024. Over the period under review, imports continue to indicate a noticeable decline. The most prominent rate of growth was recorded in 2023 when imports increased by 46% against the previous year. The level of import peaked at $417M in 2014; however, from 2015 to 2024, imports stood at a somewhat lower figure.
Imports By Country
In 2024, Chile (718 units) was the key importer of electrical transformers with liquid dielectric, of power handling capacity over 10000 kVA, comprising 47% of total imports. Guyana (200 units) took a 13% share (based on physical terms) of total imports, which put it in second place, followed by Mexico (8.7%) and Suriname (5.4%). The following importers - Cuba (59 units), Ecuador (52 units), Bolivia (39 units), Guatemala (37 units), Venezuela (29 units) and Paraguay (27 units) - together made up 16% of total imports.
From 2013 to 2024, average annual rates of growth with regard to electrical transformers with liquid dielectric, of power handling capacity over 10000 kVA imports into Chile stood at +13.7%. At the same time, Guyana (+61.9%), Suriname (+49.3%), Mexico (+13.2%) and Cuba (+5.4%) displayed positive paces of growth. Moreover, Guyana emerged as the fastest-growing importer imported in Latin America and the Caribbean, with a CAGR of +61.9% from 2013-2024. Guatemala experienced a relatively flat trend pattern. By contrast, Ecuador (-1.7%), Bolivia (-6.5%), Paraguay (-11.5%) and Venezuela (-18.1%) illustrated a downward trend over the same period. Chile (+33 p.p.), Guyana (+13 p.p.), Mexico (+5.9 p.p.) and Suriname (+5.3 p.p.) significantly strengthened its position in terms of the total imports, while Ecuador, Bolivia, Paraguay and Venezuela saw its share reduced by -1.8%, -4.2%, -6.7% and -19.7% from 2013 to 2024, respectively. The shares of the other countries remained relatively stable throughout the analyzed period.
In value terms, Mexico ($45M), Chile ($27M) and Bolivia ($21M) were the countries with the highest levels of imports in 2024, together comprising 33% of total imports. Guyana, Suriname, Guatemala, Venezuela, Paraguay, Ecuador and Cuba lagged somewhat behind, together comprising a further 34%.
Among the main importing countries, Suriname, with a CAGR of +45.8%, recorded the highest growth rate of the value of imports, over the period under review, while purchases for the other leaders experienced more modest paces of growth.
Import Prices By Country
In 2024, the import price in Latin America and the Caribbean amounted to $188 thousand per unit, with an increase of 165% against the previous year. Overall, the import price, however, saw a pronounced curtailment. The pace of growth appeared the most rapid in 2021 an increase of 37,427% against the previous year. Over the period under review, import prices reached the peak figure at $308 thousand per unit in 2013; however, from 2014 to 2024, import prices remained at a lower figure.
Prices varied noticeably by country of destination: amid the top importers, the country with the highest price was Venezuela ($617 thousand per unit), while Cuba ($29 thousand per unit) was amongst the lowest.
From 2013 to 2024, the most notable rate of growth in terms of prices was attained by Bolivia (+24.2%), while the other leaders experienced more modest paces of growth.
Exports
Latin America and the Caribbean's Exports of Electrical Transformers with Liquid Dielectric, of Power Handling Capacity over 10000 kVA
In 2024, approx. 1.3K units of electrical transformers with liquid dielectric, of power handling capacity over 10000 kVA were exported in Latin America and the Caribbean; picking up by 34% against 2023. In general, exports saw a relatively flat trend pattern. The pace of growth appeared the most rapid in 2023 with an increase of 41%. Over the period under review, the exports of reached the peak figure at 1.3K units in 2015; afterwards, it flattened through to 2024.
In value terms, exports of electrical transformers with liquid dielectric, of power handling capacity over 10000 kVA soared to $1B in 2024. Over the period under review, exports posted a strong expansion. As a result, the exports reached the peak and are likely to continue growth in the immediate term.
Exports By Country
Mexico was the largest exporting country with an export of around 944 units, which resulted at 75% of total exports. Brazil (210 units) took the second position in the ranking, distantly followed by Colombia (66 units). All these countries together held near 22% share of total exports.
Mexico experienced a relatively flat trend pattern with regard to volume of exports of electrical transformers with liquid dielectric, of power handling capacity over 10000 kVA. Brazil experienced a relatively flat trend pattern. Colombia (-3.4%) illustrated a downward trend over the same period. Mexico (+3.3 p.p.) significantly strengthened its position in terms of the total exports, while Colombia saw its share reduced by -2.9% from 2013 to 2024, respectively. The shares of the other countries remained relatively stable throughout the analyzed period.
In value terms, Mexico ($465M), Brazil ($462M) and Colombia ($102M) appeared to be the countries with the highest levels of exports in 2024, with a combined 99% share of total exports.
Brazil, with a CAGR of +10.9%, saw the highest growth rate of the value of exports, in terms of the main exporting countries over the period under review, while shipments for the other leaders experienced more modest paces of growth.
Export Prices By Country
In 2024, the export price in Latin America and the Caribbean amounted to $823 thousand per unit, jumping by 34% against the previous year. Overall, the export price saw a prominent expansion. The pace of growth appeared the most rapid in 2016 when the export price increased by 49%. The level of export peaked in 2024 and is likely to see gradual growth in years to come.
Prices varied noticeably by country of origin: amid the top suppliers, the country with the highest price was Brazil ($2.2 million per unit), while Mexico ($493 thousand per unit) was amongst the lowest.
From 2013 to 2024, the most notable rate of growth in terms of prices was attained by Colombia (+10.3%), while the other leaders experienced more modest paces of growth.
This report provides a comprehensive view of the electrical transformers with liquid dielectric, of power handling capacity over 10000 kva industry in Latin America and the Caribbean, tracking demand, supply, and trade flows across the regional value chain. It explains how demand across key channels and end-use segments shapes consumption patterns, while also mapping the role of input availability, production efficiency, and regulatory standards on supply.
Beyond headline metrics, the study benchmarks prices, margins, and trade routes so you can see where value is created and how it moves between exporters and importers within Latin America and the Caribbean. The analysis is designed to support strategic planning, market entry, portfolio prioritization, and risk management in the electrical transformers with liquid dielectric, of power handling capacity over 10000 kva landscape in Latin America and the Caribbean.
Quick navigation
- Key findings
- Report scope
- Product coverage
- Country coverage
- Methodology
- Forecasts to 2035
- Price analysis
- Market participants
- Country profiles
- How to use this report
- FAQ
Key findings
- Regional demand is shaped by both household and industrial usage, with trade flows linking supply hubs to import-reliant countries.
- Pricing dynamics reflect unit values, freight costs, exchange rates, and regulatory shifts that affect sourcing decisions.
- Supply depends on input availability and production efficiency, creating distinct cost curves across Latin America and the Caribbean.
- Market concentration varies by country, creating different competitive landscapes and entry barriers.
- The 2035 outlook highlights where capacity investment and demand growth are most aligned within the region.
Report scope
The report combines market sizing with trade intelligence and price analytics for Latin America and the Caribbean. It covers both historical performance and the forward outlook to 2035, allowing you to compare cycles, structural shifts, and policy impacts across countries and sub-regions.
- Market size and growth in value and volume terms
- Consumption structure by end-use segments and countries
- Production capacity, output, and cost dynamics
- Regional trade flows, exporters, importers, and balances
- Price benchmarks, unit values, and margin signals
- Competitive context and market entry conditions
Product coverage
- Prodcom 27114180 - Liquid dielectric transformers having a power handling capacity > .10 .000 kVA
Country coverage
- Anguilla
- Antigua and Barbuda
- Argentina
- Aruba
- Bahamas
- Barbados
- Belize
- Bolivia
- Brazil
- British Virgin Islands
- Cayman Islands
- Chile
- Colombia
- Costa Rica
- Cuba
- Curacao
- Dominica
- Dominican Republic
- Ecuador
- El Salvador
- Falkland Islands (Malvinas)
- French Guiana
- Grenada
- Guadeloupe
- Guatemala
- Guyana
- Haiti
- Honduras
- Jamaica
- Martinique
- Mexico
- Montserrat
- Nicaragua
- Panama
- Paraguay
- Peru
- Puerto Rico
- Saint Kitts and Nevis
- Saint Lucia
- Saint Maarten (Dutch part)
- Saint Vincent and the Grenadines
- Suriname
- Trinidad and Tobago
- Turks and Caicos Islands
- United States Virgin Islands
- Uruguay
- Venezuela
Country profiles and benchmarks
For the regional report, country profiles provide a consistent view of market size, trade balance, prices, and per-capita indicators across Latin America and the Caribbean. The profiles highlight the largest consuming and producing markets and allow direct benchmarking across peers.
Methodology
The analysis is built on a multi-source framework that combines official statistics, trade records, company disclosures, and expert validation. Data are standardized, reconciled, and cross-checked to ensure consistency across time series.
- International trade data (exports, imports, and mirror statistics)
- National production and consumption statistics
- Company-level information from financial filings and public releases
- Price series and unit value benchmarks
- Analyst review, outlier checks, and time-series validation
All data are normalized to a common product definition and mapped to a consistent set of codes. This ensures that comparisons across time are aligned and actionable.
Forecasts to 2035
The forecast horizon extends to 2035 and is based on a structured model that links electrical transformers with liquid dielectric, of power handling capacity over 10000 kva demand and supply to macroeconomic indicators, trade patterns, and sector-specific drivers. The model captures both cyclical and structural factors and reflects known policy and technology shifts within Latin America and the Caribbean.
- Historical baseline: 2012-2025
- Forecast horizon: 2026-2035
- Scenario-based sensitivity to income growth, substitution, and regulation
- Capacity and investment outlook for major producing countries
Each country projection is built from its own historical pattern and the regional context, allowing the report to show where growth is concentrated and where risks are elevated.
Price analysis and trade dynamics
Prices are analyzed in detail, including export and import unit values, regional spreads, and changes in trade costs. The report highlights how seasonality, freight rates, exchange rates, and supply disruptions influence pricing and margins.
- Price benchmarks by country and sub-region
- Export and import unit value trends
- Seasonality and calendar effects in trade flows
- Price outlook to 2035 under baseline assumptions
Profiles of market participants
Key producers, exporters, and distributors are profiled with a focus on their operational scale, geographic footprint, product mix, and market positioning. This helps identify competitive pressure points, partnership opportunities, and routes to differentiation.
- Business focus and production capabilities
- Geographic reach and distribution networks
- Cost structure and pricing strategy indicators
- Compliance, certification, and sustainability context
How to use this report
- Quantify regional demand and identify the most attractive country markets
- Evaluate export opportunities and prioritize target destinations
- Track price dynamics and protect margins
- Benchmark performance against regional competitors
- Build evidence-based forecasts for investment decisions
This report is designed for manufacturers, distributors, importers, wholesalers, investors, and advisors who need a clear, data-driven picture of electrical transformers with liquid dielectric, of power handling capacity over 10000 kva dynamics in Latin America and the Caribbean.
FAQ
What is included in the electrical transformers with liquid dielectric, of power handling capacity over 10000 kva market in Latin America and the Caribbean?
The market size aggregates consumption and trade data at country and sub-regional levels, presented in both value and volume terms.
How are the forecasts to 2035 built?
The projections combine historical trends with macroeconomic indicators, trade dynamics, and sector-specific drivers.
Does the report cover prices and margins?
Yes, it includes export and import unit values, regional spreads, and a pricing outlook to 2035.
Which countries are profiled in detail?
The report provides profiles for the largest consuming and producing countries in Latin America and the Caribbean.
Can this report support market entry decisions?
Yes, it highlights demand hotspots, trade routes, pricing trends, and competitive context.
1. INTRODUCTION
Making Data-Driven Decisions to Grow Your Business
- REPORT DESCRIPTION
- RESEARCH METHODOLOGY AND THE AI PLATFORM
- DATA-DRIVEN DECISIONS FOR YOUR BUSINESS
- GLOSSARY AND SPECIFIC TERMS
2. EXECUTIVE SUMMARY
A Quick Overview of Market Performance
- KEY FINDINGS
- MARKET TRENDS This Chapter is Available Only for the Professional EditionPRO
3. MARKET OVERVIEW
Understanding the Current State of The Market and its Prospects
- MARKET SIZE: HISTORICAL DATA (2012–2025) AND FORECAST (2026–2035)
- CONSUMPTION BY COUNTRY: HISTORICAL DATA (2012–2025) AND FORECAST (2026–2035)
- MARKET FORECAST TO 2035
4. MOST PROMISING PRODUCTS FOR DIVERSIFICATION
Finding New Products to Diversify Your Business
- TOP PRODUCTS TO DIVERSIFY YOUR BUSINESS
- BEST-SELLING PRODUCTS
- MOST CONSUMED PRODUCTS
- MOST TRADED PRODUCTS
- MOST PROFITABLE PRODUCTS FOR EXPORT
5. MOST PROMISING SUPPLYING COUNTRIES
Choosing the Best Countries to Establish Your Sustainable Supply Chain
- TOP COUNTRIES TO SOURCE YOUR PRODUCT
- TOP PRODUCING COUNTRIES
- TOP EXPORTING COUNTRIES
- LOW-COST EXPORTING COUNTRIES
6. MOST PROMISING OVERSEAS MARKETS
Choosing the Best Countries to Boost Your Export
- TOP OVERSEAS MARKETS FOR EXPORTING YOUR PRODUCT
- TOP CONSUMING MARKETS
- UNSATURATED MARKETS
- TOP IMPORTING MARKETS
- MOST PROFITABLE MARKETS
7. PRODUCTION
The Latest Trends and Insights into The Industry
- PRODUCTION VOLUME AND VALUE: HISTORICAL DATA (2012–2025) AND FORECAST (2026–2035)
- PRODUCTION BY COUNTRY: HISTORICAL DATA (2012–2025) AND FORECAST (2026–2035)
8. IMPORTS
The Largest Import Supplying Countries
- IMPORTS: HISTORICAL DATA (2012–2025) AND FORECAST (2026–2035)
- IMPORTS BY COUNTRY: HISTORICAL DATA (2012–2025) AND FORECAST (2026–2035)
- IMPORT PRICES BY COUNTRY: HISTORICAL DATA (2012–2025) AND FORECAST (2026–2035)
9. EXPORTS
The Largest Destinations for Exports
- EXPORTS: HISTORICAL DATA (2012–2025) AND FORECAST (2026–2035)
- EXPORTS BY COUNTRY: HISTORICAL DATA (2012–2025) AND FORECAST (2026–2035)
- EXPORT PRICES BY COUNTRY: HISTORICAL DATA (2012–2025) AND FORECAST (2026–2035)
10. PROFILES OF MAJOR PRODUCERS
The Largest Producers on The Market and Their Profiles
-
11. COUNTRY PROFILES
The Largest Markets And Their Profiles
This Chapter is Available Only for the Professional Edition PRO LIST OF TABLES
- Key Findings In 2025
- Market Volume, In Physical Terms: Historical Data (2012–2025) and Forecast (2026–2035)
- Market Value: Historical Data (2012–2025) and Forecast (2026–2035)
- Per Capita Consumption, by Country, 2022–2025
- Production, In Physical Terms, By Country: Historical Data (2012–2025) and Forecast (2026–2035)
- Imports, In Physical Terms, By Country: Historical Data (2012–2025) and Forecast (2026–2035)
- Imports, In Value Terms, By Country: Historical Data (2012–2025) and Forecast (2026–2035)
- Import Prices, By Country: Historical Data (2012–2025) and Forecast (2026–2035)
- Exports, In Physical Terms, By Country: Historical Data (2012–2025) and Forecast (2026–2035)
- Exports, In Value Terms, By Country: Historical Data (2012–2025) and Forecast (2026–2035)
- Export Prices, By Country: Historical Data (2012–2025) and Forecast (2026–2035)
LIST OF FIGURES
- Market Volume, In Physical Terms: Historical Data (2012–2025) and Forecast (2026–2035)
- Market Value: Historical Data (2012–2025) and Forecast (2026–2035)
- Consumption, by Country, 2025
- Market Volume Forecast to 2035
- Market Value Forecast to 2035
- Market Size and Growth, By Product
- Average Per Capita Consumption, By Product
- Exports and Growth, By Product
- Export Prices and Growth, By Product
- Production Volume and Growth
- Exports and Growth
- Export Prices and Growth
- Market Size and Growth
- Per Capita Consumption
- Imports and Growth
- Import Prices
- Production, In Physical Terms: Historical Data (2012–2025) and Forecast (2026–2035)
- Production, In Value Terms: Historical Data (2012–2025) and Forecast (2026–2035)
- Production, by Country, 2025
- Production, In Physical Terms, by Country: Historical Data (2012–2025) and Forecast (2026–2035)
- Imports, In Physical Terms: Historical Data (2012–2025) and Forecast (2026–2035)
- Imports, In Value Terms: Historical Data (2012–2025) and Forecast (2026–2035)
- Imports, In Physical Terms, By Country, 2025
- Imports, In Physical Terms, By Country: Historical Data (2012–2025) and Forecast (2026–2035)
- Imports, In Value Terms, By Country: Historical Data (2012–2025) and Forecast (2026–2035)
- Import Prices, By Country: Historical Data (2012–2025) and Forecast (2026–2035)
- Exports, In Physical Terms: Historical Data (2012–2025) and Forecast (2026–2035)
- Exports, In Value Terms: Historical Data (2012–2025) and Forecast (2026–2035)
- Exports, In Physical Terms, By Country, 2025
- Exports, In Physical Terms, By Country: Historical Data (2012–2025) and Forecast (2026–2035)
- Exports, In Value Terms, By Country: Historical Data (2012–2025) and Forecast (2026–2035)
- Export Prices, By Country: Historical Data (2012–2025) and Forecast (2026–2035)
Recommended posts
Free Data: Electrical Transformers with Liquid Dielectric, of Power Handling Capacity over 10000 kVA - Latin America and the Caribbean
Instant access. No credit card needed.


