
China - Wool - Market Analysis, Forecast, Size, Trends And Insights
Get instant access to more than 2 million reports, dashboards, and datasets on the IndexBox Platform.
View PricingChina's Wool Imports Plummet in June 2023, Reaching a Mere $5.3M.
China Wool Imports
In June 2023, approximately 2.7K tons of wool were imported into China; which is down by -40.9% on May 2023. Overall, imports continue to indicate a abrupt descent. The growth pace was the most rapid in May 2023 with an increase of 51% month-to-month.
In value terms, wool imports declined dramatically to $5.3M (IndexBox estimates) in June 2023. In general, imports saw a abrupt descent. The pace of growth was the most pronounced in May 2023 when imports increased by 78% month-to-month. 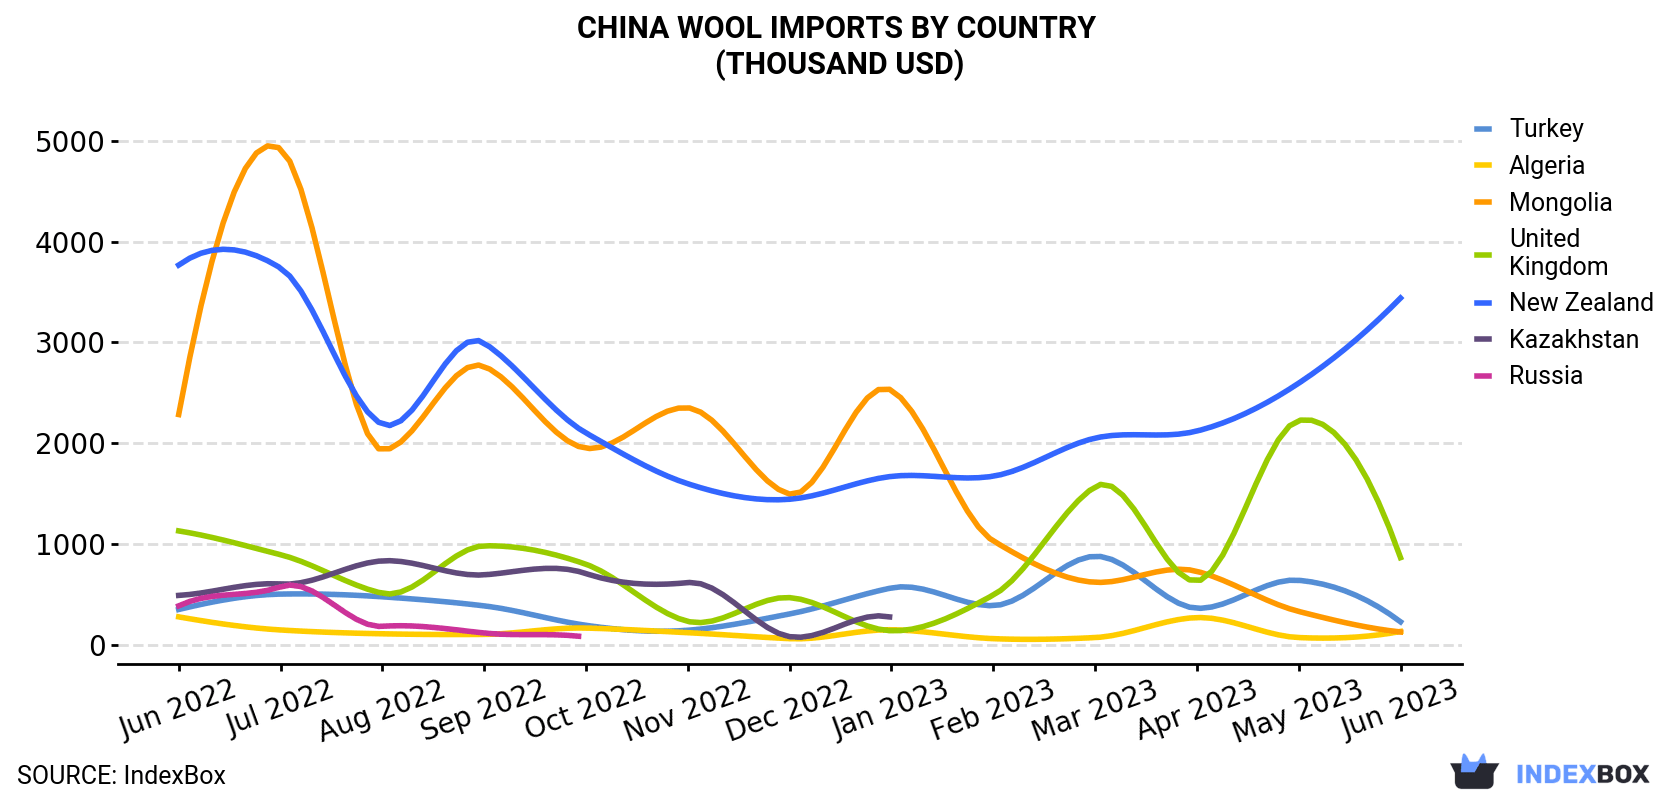
| COUNTRY | Import Value of Wool in China (thousand USD) | ||||||||||||
|---|---|---|---|---|---|---|---|---|---|---|---|---|---|
| Jun 2022 | Jul 2022 | Aug 2022 | Sep 2022 | Oct 2022 | Nov 2022 | Dec 2022 | Jan 2023 | Feb 2023 | Mar 2023 | Apr 2023 | May 2023 | Jun 2023 | |
| New Zealand | 3,767 | 3,738 | 2,187 | 2,994 | 2,101 | 1,597 | 1,443 | 1,670 | 1,672 | 2,050 | 2,120 | 2,595 | 3,440 |
| United Kingdom | 1,129 | 893 | 510 | 981 | 798 | 231 | 467 | 138 | 492 | 1,568 | 631 | 2,225 | 864 |
| Turkey | 349 | 502 | 475 | 385 | 192 | 143 | 305 | 563 | 387 | 878 | 361 | 639 | 227 |
| Algeria | 276 | 146 | 108 | 102 | 165 | 119 | 59.7 | 148 | 59.7 | 70.4 | 269 | 70.5 | 131 |
| Kazakhstan | 489 | 602 | 832 | 693 | 706 | 616 | 79.2 | 271 | 23.8 | 22.2 | N/A | 118 | 127 |
| Mongolia | 2,284 | 4,921 | 1,932 | 2,762 | 1,949 | 2,351 | 1,494 | 2,525 | 1,030 | 619 | 728 | 330 | 126 |
| Russia | 385 | 575 | 182 | 116 | 74.9 | 257 | 41.9 | N/A | 172 | 46.7 | 107 | 218 | N/A |
| Others | 1,206 | 536 | 761 | 908 | 214 | 1,061 | 1,075 | 713 | 609 | 1,135 | 718 | 2,579 | 402 |
| Total | 9,885 | 11,912 | 6,986 | 8,942 | 6,201 | 6,375 | 4,966 | 6,028 | 4,444 | 6,390 | 4,935 | 8,777 | 5,317 |
Imports by Country
In June 2023, New Zealand (1.6K tons) constituted the largest supplier of wool to China, with a 60% share of total imports. Moreover, wool imports from New Zealand exceeded the figures recorded by the second-largest supplier, the UK (342 tons), fivefold. The third position in this ranking was held by Algeria (157 tons), with a 5.8% share.
From June 2022 to June 2023, the average monthly rate of growth in terms of volume from New Zealand was relatively modest. The remaining supplying countries recorded the following average monthly rates of imports growth: the UK (-2.3% per month) and Algeria (-6.6% per month).
In value terms, New Zealand ($3.4M) constituted the largest supplier of wool to China, comprising 65% of total imports. The second position in the ranking was taken by the UK ($864K), with a 16% share of total imports. It was followed by Turkey, with a 4.3% share.
From June 2022 to June 2023, the average monthly rate of growth in terms of value from New Zealand was relatively modest. The remaining supplying countries recorded the following average monthly rates of imports growth: the UK (-2.2% per month) and Turkey (-3.5% per month).
Imports by Type
In June 2023, wool; (not carded or combed), degreased, (not carbonised), shorn (2.6K tons) was the main type of wool supplied to China, accounting for a 97% share of total imports. It was followed by wool; (not carded or combed), degreased, (not carbonised), (other than shorn) (51 tons), with a 1.9% share of total imports.
From June 2022 to June 2023, the average monthly rate of growth in terms of the volume of import of wool; (not carded or combed), degreased, (not carbonised), shorn totaled -6.9%. With regard to the other supplied products, the following average monthly rates of growth were recorded: wool; (not carded or combed), degreased, (not carbonised), (other than shorn) (+8.0% per month) and wool; (not carded or combed), carbonised (+3.8% per month).
In value terms, wool; (not carded or combed), degreased, (not carbonised), shorn ($5.1M) constituted the largest type of wool supplied to China, comprising 97% of total imports. The second position in the ranking was held by wool; (not carded or combed), carbonised ($115K), with a 2.2% share of total imports.
Import Prices by Country
In June 2023, the wool price stood at $1,965 per ton (CIF, China), surging by 2.4% against the previous month. Over the last twelve-month period, it increased at an average monthly rate of +1.8%. The most prominent rate of growth was recorded in March 2023 an increase of 24% month-to-month. Over the period under review, average import prices reached the peak figure in June 2023.
There were significant differences in the average prices amongst the major supplying countries. In June 2023, the country with the highest price was Uruguay ($3,133 per ton), while the price for Algeria ($832 per ton) was amongst the lowest.
From June 2022 to June 2023, the most notable rate of growth in terms of prices was attained by Tunisia (+2.1%), while the prices for the other major suppliers experienced more modest paces of growth.
This report provides an in-depth analysis of the wool market in China. Within it, you will discover the latest data on market trends and opportunities by country, consumption, production and price developments, as well as the global trade (imports and exports). The forecast exhibits the market prospects through 2030.
Product coverage:
- Prodcom 13102200 - Wool, degreased or carbonised, not carded or combed
Country coverage:
Data coverage:
- Market volume and value
- Per Capita consumption
- Forecast of the market dynamics in the medium term
- Trade (exports and imports) in China
- Export and import prices
- Market trends, drivers and restraints
- Key market players and their profiles
Reasons to buy this report:
- Take advantage of the latest data
- Find deeper insights into current market developments
- Discover vital success factors affecting the market
This report is designed for manufacturers, distributors, importers, and wholesalers, as well as for investors, consultants and advisors.
In this report, you can find information that helps you to make informed decisions on the following issues:
- How to diversify your business and benefit from new market opportunities
- How to load your idle production capacity
- How to boost your sales on overseas markets
- How to increase your profit margins
- How to make your supply chain more sustainable
- How to reduce your production and supply chain costs
- How to outsource production to other countries
- How to prepare your business for global expansion
While doing this research, we combine the accumulated expertise of our analysts and the capabilities of artificial intelligence. The AI-based platform, developed by our data scientists, constitutes the key working tool for business analysts, empowering them to discover deep insights and ideas from the marketing data.
-
1. INTRODUCTION
Making Data-Driven Decisions to Grow Your Business
- REPORT DESCRIPTION
- RESEARCH METHODOLOGY AND AI PLATFORM
- DATA-DRIVEN DECISIONS FOR YOUR BUSINESS
- GLOSSARY AND SPECIFIC TERMS
-
2. EXECUTIVE SUMMARY
A Quick Overview of Market Performance
- KEY FINDINGS
- MARKET TRENDS This Chapter is Available Only for the Professional Edition PRO
-
3. MARKET OVERVIEW
Understanding the Current State of The Market and Its Prospects
- MARKET SIZE
- MARKET STRUCTURE
- TRADE BALANCE
- PER CAPITA CONSUMPTION
- MARKET FORECAST TO 2030
-
4. MOST PROMISING PRODUCT
Finding New Products to Diversify Your Business
This Chapter is Available Only for the Professional Edition PRO- TOP PRODUCTS TO DIVERSIFY YOUR BUSINESS
- BEST-SELLING PRODUCTS
- MOST CONSUMED PRODUCT
- MOST TRADED PRODUCT
- MOST PROFITABLE PRODUCT FOR EXPORT
-
5. MOST PROMISING SUPPLYING COUNTRIES
Choosing the Best Countries to Establish Your Sustainable Supply Chain
This Chapter is Available Only for the Professional Edition PRO- TOP COUNTRIES TO SOURCE YOUR PRODUCT
- TOP PRODUCING COUNTRIES
- TOP EXPORTING COUNTRIES
- LOW-COST EXPORTING COUNTRIES
-
6. MOST PROMISING OVERSEAS MARKETS
Choosing the Best Countries to Boost Your Exports
This Chapter is Available Only for the Professional Edition PRO- TOP OVERSEAS MARKETS FOR EXPORTING YOUR PRODUCT
- TOP CONSUMING MARKETS
- UNSATURATED MARKETS
- TOP IMPORTING MARKETS
- MOST PROFITABLE MARKETS
7. PRODUCTION
The Latest Trends and Insights into The Industry
- PRODUCTION VOLUME AND VALUE
8. IMPORTS
The Largest Import Supplying Countries
- IMPORTS FROM 2012–2023
- IMPORTS BY COUNTRY
- IMPORT PRICES BY COUNTRY
9. EXPORTS
The Largest Destinations for Exports
- EXPORTS FROM 2012–2023
- EXPORTS BY COUNTRY
- EXPORT PRICES BY COUNTRY
-
10. PROFILES OF MAJOR PRODUCERS
The Largest Producers on The Market and Their Profiles
This Chapter is Available Only for the Professional Edition PRO -
LIST OF TABLES
- Key Findings In 2023
- Market Volume, In Physical Terms, 2012–2023
- Market Value, 2012–2023
- Per Capita Consumption In 2012-2023
- Imports, In Physical Terms, By Country, 2012–2023
- Imports, In Value Terms, By Country, 2012–2023
- Import Prices, By Country Of Origin, 2012–2023
- Exports, In Physical Terms, By Country, 2012–2023
- Exports, In Value Terms, By Country, 2012–2023
- Export Prices, By Country Of Destination, 2012–2023
-
LIST OF FIGURES
- Market Volume, In Physical Terms, 2012–2023
- Market Value, 2012–2023
- Market Structure – Domestic Supply vs. Imports, In Physical Terms, 2012-2023
- Market Structure – Domestic Supply vs. Imports, In Value Terms, 2012-2023
- Trade Balance, In Physical Terms, 2012-2023
- Trade Balance, In Value Terms, 2012-2023
- Per Capita Consumption, 2012-2023
- Market Volume Forecast to 2030
- Market Value Forecast to 2030
- Products: Market Size And Growth, By Type
- Products: Average Per Capita Consumption, By Type
- Products: Exports And Growth, By Type
- Products: Export Prices And Growth, By Type
- Production Volume And Growth
- Exports And Growth
- Export Prices And Growth
- Market Size And Growth
- Per Capita Consumption
- Imports And Growth
- Import Prices
- Production, In Physical Terms, 2012–2023
- Production, In Value Terms, 2012–2023
- Imports, In Physical Terms, 2012–2023
- Imports, In Value Terms, 2012–2023
- Imports, In Physical Terms, By Country, 2023
- Imports, In Physical Terms, By Country, 2012–2023
- Imports, In Value Terms, By Country, 2012–2023
- Import Prices, By Country Of Origin, 2012–2023
- Exports, In Physical Terms, 2012–2023
- Exports, In Value Terms, 2012–2023
- Exports, In Physical Terms, By Country, 2023
- Exports, In Physical Terms, By Country, 2012–2023
- Exports, In Value Terms, By Country, 2012–2023
- Export Prices, By Country Of Destination, 2012–2023


