
China - Table Knives - Market Analysis, Forecast, Size, Trends And Insights
Get instant access to more than 2 million reports, dashboards, and datasets on the IndexBox Platform.
View PricingChina Sees a 7% Decrease in Table Knife Prices at $465 per Thousand Units
China Table Knife Export Price in June 2023
In June 2023, the table knife price stood at $465 per thousand units (FOB, China), falling by -6.5% against the previous month. Over the period under review, the export price continues to indicate a relatively flat trend pattern. The most prominent rate of growth was recorded in September 2022 an increase of 12% against the previous month. Over the period under review, the average export prices reached the maximum at $594 per thousand units in November 2022; however, from December 2022 to June 2023, the export prices failed to regain momentum.
There were significant differences in the average prices for the major overseas markets. In June 2023, the country with the highest price was France ($554 per thousand units), while the average price for exports to Italy ($129 per thousand units) was amongst the lowest.
From June 2022 to June 2023, the most notable rate of growth in terms of prices was recorded for supplies to France (+2.1%), while the prices for the other major destinations experienced mixed trend patterns.
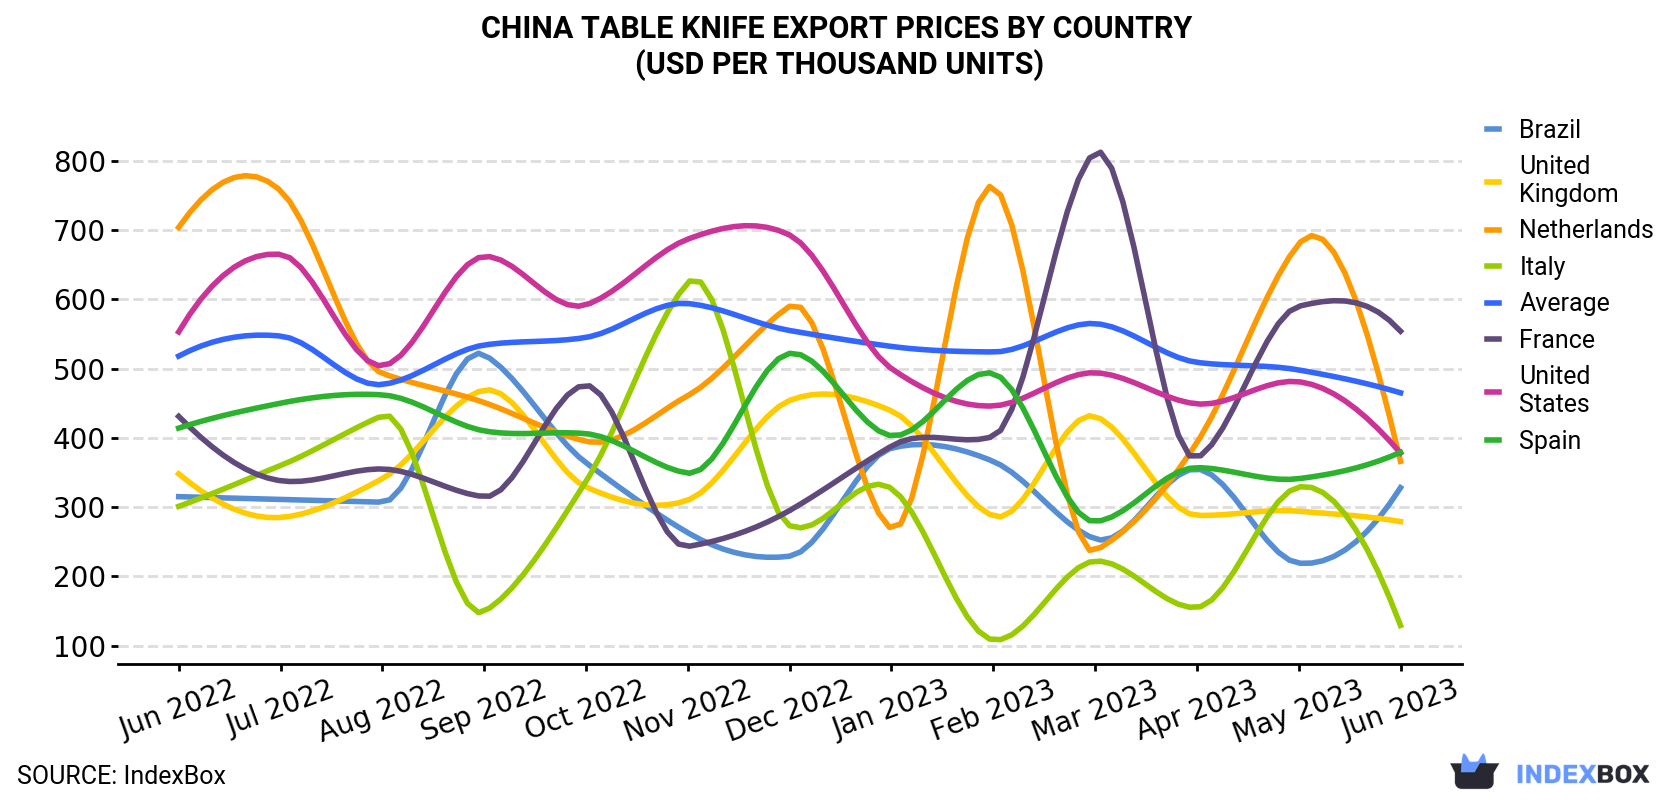
| COUNTRY | Export Price of Table Knife in China (USD per thousand units) | ||||||||||||
|---|---|---|---|---|---|---|---|---|---|---|---|---|---|
| Jun 2022 | Jul 2022 | Aug 2022 | Sep 2022 | Oct 2022 | Nov 2022 | Dec 2022 | Jan 2023 | Feb 2023 | Mar 2023 | Apr 2023 | May 2023 | Jun 2023 | |
| France | 431 | 338 | 355 | 315 | 476 | 243 | 295 | 388 | 402 | 812 | 371 | 590 | 554 |
| Spain | 414 | 450 | 462 | 410 | 406 | 349 | 522 | 403 | 493 | 279 | 357 | 341 | 379 |
| United States | 553 | 665 | 504 | 662 | 592 | 687 | 693 | 500 | 446 | 494 | 449 | 481 | 378 |
| Netherlands | 704 | 757 | 493 | 451 | 395 | 461 | 590 | 269 | 763 | 237 | 393 | 680 | 366 |
| Brazil | 315 | 311 | 307 | 520 | 364 | 263 | 229 | 385 | 366 | 254 | 355 | 219 | 328 |
| United Kingdom | 348 | 285 | 341 | 469 | 329 | 310 | 454 | 439 | 287 | 431 | 288 | 294 | 279 |
| Italy | 301 | 360 | 432 | 149 | 337 | 624 | 273 | 327 | 108 | 222 | 155 | 329 | 129 |
| Average | 518 | 547 | 477 | 534 | 545 | 594 | 555 | 532 | 524 | 565 | 509 | 498 | 465 |
China Table Knife Exports
Table knife exports from China rose significantly to 27M units in June 2023, picking up by 6.6% against the previous month's figure. In general, exports, however, recorded a relatively flat trend pattern. The pace of growth was the most pronounced in March 2023 with an increase of 128% against the previous month. The exports peaked at 28M units in August 2022; however, from September 2022 to June 2023, the exports remained at a lower figure.
In value terms, table knife exports shrank modestly to $12M (IndexBox estimates) in June 2023. Over the period under review, exports, however, recorded a slight slump. The pace of growth was the most pronounced in March 2023 with an increase of 146% month-to-month. The exports peaked at 15M units in January 2023; however, from February 2023 to June 2023, the exports stood at a somewhat lower figure.
China Table Knife Exports by Country
The United States (7.1M units) was the main destination for table knife exports from China, accounting for a 27% share of total exports. Moreover, table knife exports to the United States exceeded the volume sent to the second major destination, France (3M units), twofold. The third position in this ranking was taken by Brazil (2.3M units), with an 8.7% share.
From June 2022 to June 2023, the average monthly growth rate of volume to the United States totaled -1.8%. Exports to the other major destinations recorded the following average monthly rates of exports growth: France (+4.9% per month) and Brazil (+8.5% per month).
In value terms, the United States ($2.7M), France ($1.7M) and Brazil ($765K) appeared to be the largest markets for table knife exported from China worldwide, with a combined 41% share of total exports. These countries were followed by Germany, Saudi Arabia, the UK, the Netherlands, Spain, Italy, Belgium and Canada, which together accounted for a further 19%.
Saudi Arabia, with a CAGR of +12.5%, saw the highest rates of growth with regard to the value of exports, in terms of the main countries of destination over the period under review, while shipments for the other leaders experienced more modest paces of growth.
This report provides an in-depth analysis of the table knife market in China. Within it, you will discover the latest data on market trends and opportunities by country, consumption, production and price developments, as well as the global trade (imports and exports). The forecast exhibits the market prospects through 2030.
Product coverage:
- Prodcom 25711120 - Table knives having fixed blades of base metal, including handles (excluding butter knives and fish knives)
- Prodcom 25711115 -
- Prodcom 25711130 -
Country coverage:
Data coverage:
- Market volume and value
- Per Capita consumption
- Forecast of the market dynamics in the medium term
- Trade (exports and imports) in China
- Export and import prices
- Market trends, drivers and restraints
- Key market players and their profiles
Reasons to buy this report:
- Take advantage of the latest data
- Find deeper insights into current market developments
- Discover vital success factors affecting the market
This report is designed for manufacturers, distributors, importers, and wholesalers, as well as for investors, consultants and advisors.
In this report, you can find information that helps you to make informed decisions on the following issues:
- How to diversify your business and benefit from new market opportunities
- How to load your idle production capacity
- How to boost your sales on overseas markets
- How to increase your profit margins
- How to make your supply chain more sustainable
- How to reduce your production and supply chain costs
- How to outsource production to other countries
- How to prepare your business for global expansion
While doing this research, we combine the accumulated expertise of our analysts and the capabilities of artificial intelligence. The AI-based platform, developed by our data scientists, constitutes the key working tool for business analysts, empowering them to discover deep insights and ideas from the marketing data.
-
1. INTRODUCTION
Making Data-Driven Decisions to Grow Your Business
- REPORT DESCRIPTION
- RESEARCH METHODOLOGY AND AI PLATFORM
- DATA-DRIVEN DECISIONS FOR YOUR BUSINESS
- GLOSSARY AND SPECIFIC TERMS
-
2. EXECUTIVE SUMMARY
A Quick Overview of Market Performance
- KEY FINDINGS
- MARKET TRENDS This Chapter is Available Only for the Professional Edition PRO
-
3. MARKET OVERVIEW
Understanding the Current State of The Market and Its Prospects
- MARKET SIZE
- MARKET STRUCTURE
- TRADE BALANCE
- PER CAPITA CONSUMPTION
- MARKET FORECAST TO 2030
-
4. MOST PROMISING PRODUCT
Finding New Products to Diversify Your Business
This Chapter is Available Only for the Professional Edition PRO- TOP PRODUCTS TO DIVERSIFY YOUR BUSINESS
- BEST-SELLING PRODUCTS
- MOST CONSUMED PRODUCT
- MOST TRADED PRODUCT
- MOST PROFITABLE PRODUCT FOR EXPORT
-
5. MOST PROMISING SUPPLYING COUNTRIES
Choosing the Best Countries to Establish Your Sustainable Supply Chain
This Chapter is Available Only for the Professional Edition PRO- TOP COUNTRIES TO SOURCE YOUR PRODUCT
- TOP PRODUCING COUNTRIES
- TOP EXPORTING COUNTRIES
- LOW-COST EXPORTING COUNTRIES
-
6. MOST PROMISING OVERSEAS MARKETS
Choosing the Best Countries to Boost Your Exports
This Chapter is Available Only for the Professional Edition PRO- TOP OVERSEAS MARKETS FOR EXPORTING YOUR PRODUCT
- TOP CONSUMING MARKETS
- UNSATURATED MARKETS
- TOP IMPORTING MARKETS
- MOST PROFITABLE MARKETS
7. PRODUCTION
The Latest Trends and Insights into The Industry
- PRODUCTION VOLUME AND VALUE
8. IMPORTS
The Largest Import Supplying Countries
- IMPORTS FROM 2012–2023
- IMPORTS BY COUNTRY
- IMPORT PRICES BY COUNTRY
9. EXPORTS
The Largest Destinations for Exports
- EXPORTS FROM 2012–2023
- EXPORTS BY COUNTRY
- EXPORT PRICES BY COUNTRY
-
10. PROFILES OF MAJOR PRODUCERS
The Largest Producers on The Market and Their Profiles
This Chapter is Available Only for the Professional Edition PRO -
LIST OF TABLES
- Key Findings In 2023
- Market Volume, In Physical Terms, 2012–2023
- Market Value, 2012–2023
- Per Capita Consumption In 2012-2023
- Imports, In Physical Terms, By Country, 2012–2023
- Imports, In Value Terms, By Country, 2012–2023
- Import Prices, By Country Of Origin, 2012–2023
- Exports, In Physical Terms, By Country, 2012–2023
- Exports, In Value Terms, By Country, 2012–2023
- Export Prices, By Country Of Destination, 2012–2023
-
LIST OF FIGURES
- Market Volume, In Physical Terms, 2012–2023
- Market Value, 2012–2023
- Market Structure – Domestic Supply vs. Imports, In Physical Terms, 2012-2023
- Market Structure – Domestic Supply vs. Imports, In Value Terms, 2012-2023
- Trade Balance, In Physical Terms, 2012-2023
- Trade Balance, In Value Terms, 2012-2023
- Per Capita Consumption, 2012-2023
- Market Volume Forecast to 2030
- Market Value Forecast to 2030
- Products: Market Size And Growth, By Type
- Products: Average Per Capita Consumption, By Type
- Products: Exports And Growth, By Type
- Products: Export Prices And Growth, By Type
- Production Volume And Growth
- Exports And Growth
- Export Prices And Growth
- Market Size And Growth
- Per Capita Consumption
- Imports And Growth
- Import Prices
- Production, In Physical Terms, 2012–2023
- Production, In Value Terms, 2012–2023
- Imports, In Physical Terms, 2012–2023
- Imports, In Value Terms, 2012–2023
- Imports, In Physical Terms, By Country, 2023
- Imports, In Physical Terms, By Country, 2012–2023
- Imports, In Value Terms, By Country, 2012–2023
- Import Prices, By Country Of Origin, 2012–2023
- Exports, In Physical Terms, 2012–2023
- Exports, In Value Terms, 2012–2023
- Exports, In Physical Terms, By Country, 2023
- Exports, In Physical Terms, By Country, 2012–2023
- Exports, In Value Terms, By Country, 2012–2023
- Export Prices, By Country Of Destination, 2012–2023


