
China - Relays - Market Analysis, Forecast, Size, Trends and Insights
Get instant access to more than 2 million reports, dashboards, and datasets on the IndexBox Platform.
View PricingPrice of Relay in China Drops by 8% to Average $656 per Thousand Units Following Two Consecutive Months of Contraction.
China Relay Export Price in June 2023
In June 2023, the relay price amounted to $656 per thousand units (FOB, China), waning by -7.5% against the previous month. Over the last twelve-month period, it increased at an average monthly rate of +1.1%. The pace of growth was the most pronounced in July 2022 when the average export price increased by 12% month-to-month. Over the period under review, the average export prices hit record highs at $717 per thousand units in April 2023; however, from May 2023 to June 2023, the export prices stood at a somewhat lower figure.
Prices varied noticeably by the country of destination: the country with the highest price was the United States ($879 per thousand units), while the average price for exports to Brazil ($351 per thousand units) was amongst the lowest.
From June 2022 to June 2023, the most notable rate of growth in terms of prices was recorded for supplies to the United States (+2.7%), while the prices for the other major destinations experienced more modest paces of growth.
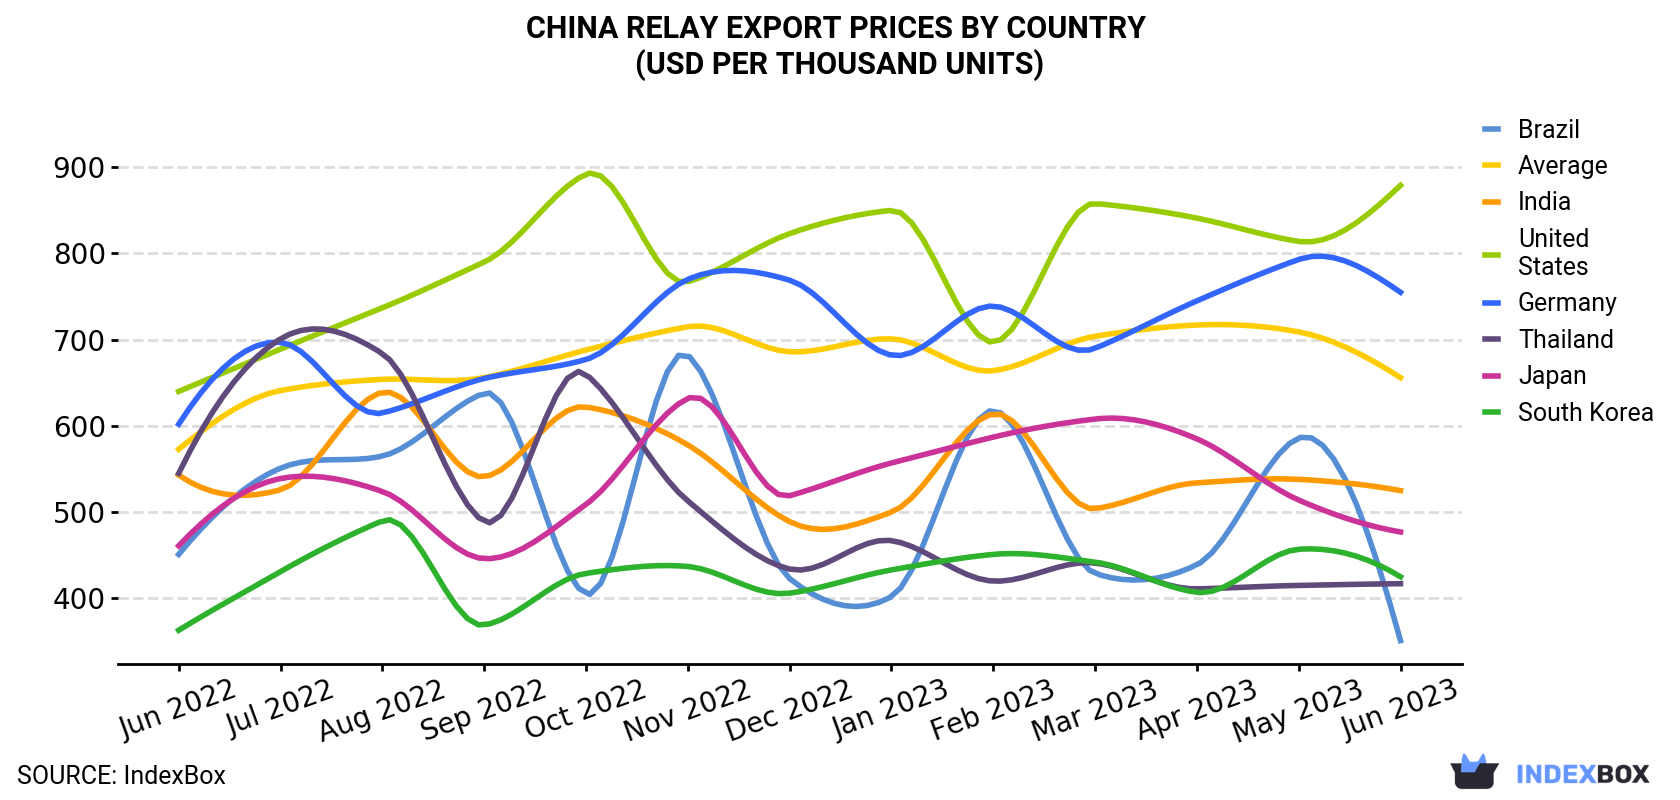
| COUNTRY | Export Price of Relay in China (USD per thousand units) | ||||||||||||
|---|---|---|---|---|---|---|---|---|---|---|---|---|---|
| Jun 2022 | Jul 2022 | Aug 2022 | Sep 2022 | Oct 2022 | Nov 2022 | Dec 2022 | Jan 2023 | Feb 2023 | Mar 2023 | Apr 2023 | May 2023 | Jun 2023 | |
| United States | 640 | 689 | 737 | 790 | 892 | 767 | 823 | 850 | 697 | 858 | 841 | 814 | 879 |
| Germany | 602 | 697 | 615 | 655 | 677 | 770 | 769 | 682 | 739 | 690 | 745 | 793 | 755 |
| India | 543 | 526 | 639 | 541 | 622 | 578 | 489 | 500 | 614 | 504 | 534 | 538 | 525 |
| Japan | 461 | 539 | 524 | 446 | 509 | 632 | 519 | 557 | 587 | 608 | 585 | 514 | 477 |
| South Korea | 363 | 431 | 490 | 369 | 429 | 437 | 406 | 433 | 451 | 442 | 407 | 457 | 425 |
| Thailand | 545 | 701 | 684 | 489 | 660 | 513 | 434 | 467 | 420 | 441 | 411 | 415 | 417 |
| Brazil | 451 | 551 | 565 | 638 | 405 | 682 | 423 | 402 | 618 | 429 | 439 | 586 | 351 |
| Average | 573 | 641 | 654 | 656 | 688 | 715 | 686 | 701 | 664 | 704 | 717 | 709 | 656 |
China Relay Export Prices by Type
Average prices varied somewhat for the major types of exported product. In June 2023, the product with the highest price was electrical apparatus ($819 per thousand units), while the average price for exports of electrical apparatus; relays, (for a voltage not exceeding 60 volts) amounted to $548 per thousand units.
From June 2022 to June 2023, the most notable rate of growth in terms of prices was recorded for the following types: electrical apparatus; relays, for a voltage exceeding 60 volts (+1.2%).
China Relay Exports
In June 2023, overseas shipments of relays increased by 4.7% to 221M units for the first time since March 2023, thus ending a two-month declining trend. In general, exports, however, saw a pronounced curtailment. The growth pace was the most rapid in March 2023 when exports increased by 31% month-to-month. Over the period under review, the exports attained the maximum at 305M units in June 2022; however, from July 2022 to June 2023, the exports failed to regain momentum.
In value terms, relay exports reduced modestly to $145M (IndexBox estimates) in June 2023. Overall, exports, however, showed a mild descent. The pace of growth appeared the most rapid in March 2023 with an increase of 39% month-to-month. The exports peaked at 191M units in July 2022; however, from August 2022 to June 2023, the exports remained at a lower figure.
China Relay Exports by Type
Electrical apparatus; relays, (for a voltage not exceeding 60 volts) (133M units) and electrical apparatus (88M units) were the main products of relay exports from China.
From June 2022 to June 2023, the biggest increases were in electrical apparatus; relays, for a voltage exceeding 60 volts (with a CAGR of -2.0%).
In value terms, the most traded types of relays in China were electrical apparatus; relays, (for a voltage not exceeding 60 volts) ($73M) and electrical apparatus ($72M).
In terms of the main product categories, electrical apparatus; relays, for a voltage exceeding 60 volts, with a CAGR of -0.8%, recorded the highest rates of growth with regard to the value of exports, over the period under review.
China Relay Exports by Country
Germany (31M units), Japan (19M units) and South Korea (18M units) were the main destinations of relay exports from China, with a combined 31% share of total exports. the United States, India, Mexico, Brazil, the Netherlands, Thailand, Turkey, Vietnam, Singapore and Russia lagged somewhat behind, together comprising a further 41%.
From June 2022 to June 2023, the most notable rate of growth in terms of shipments, amongst the main countries of destination, was attained by the Netherlands (with a CAGR of +9.2%), while the other leaders experienced more modest paces of growth.
In value terms, the largest markets for relay exported from China were Germany ($24M), the United States ($15M) and Japan ($9.2M), with a combined 33% share of total exports. These countries were followed by Mexico, South Korea, India, Russia, Singapore, Brazil, the Netherlands, Thailand, Vietnam and Turkey, which together accounted for a further 34%.
Among the main countries of destination, Russia, with a CAGR of +7.1%, saw the highest rates of growth with regard to the value of exports, over the period under review, while shipments for the other leaders experienced mixed trend patterns.
This report provides an in-depth analysis of the relay market in China. Within it, you will discover the latest data on market trends and opportunities by country, consumption, production and price developments, as well as the global trade (imports and exports). The forecast exhibits the market prospects through 2030.
Product coverage:
- Prodcom 27122433 - Relays for a voltage . .60 V and for a current . 2 A
- Prodcom 27122435 - Relays for a voltage . .60 V and for a current > 2 A
- Prodcom 27122450 - Relays and contactors for a voltage > .60 V but . 1 kV
Country coverage:
Data coverage:
- Market volume and value
- Per Capita consumption
- Forecast of the market dynamics in the medium term
- Trade (exports and imports) in China
- Export and import prices
- Market trends, drivers and restraints
- Key market players and their profiles
Reasons to buy this report:
- Take advantage of the latest data
- Find deeper insights into current market developments
- Discover vital success factors affecting the market
This report is designed for manufacturers, distributors, importers, and wholesalers, as well as for investors, consultants and advisors.
In this report, you can find information that helps you to make informed decisions on the following issues:
- How to diversify your business and benefit from new market opportunities
- How to load your idle production capacity
- How to boost your sales on overseas markets
- How to increase your profit margins
- How to make your supply chain more sustainable
- How to reduce your production and supply chain costs
- How to outsource production to other countries
- How to prepare your business for global expansion
While doing this research, we combine the accumulated expertise of our analysts and the capabilities of artificial intelligence. The AI-based platform, developed by our data scientists, constitutes the key working tool for business analysts, empowering them to discover deep insights and ideas from the marketing data.
-
1. INTRODUCTION
Making Data-Driven Decisions to Grow Your Business
- REPORT DESCRIPTION
- RESEARCH METHODOLOGY AND AI PLATFORM
- DATA-DRIVEN DECISIONS FOR YOUR BUSINESS
- GLOSSARY AND SPECIFIC TERMS
-
2. EXECUTIVE SUMMARY
A Quick Overview of Market Performance
- KEY FINDINGS
- MARKET TRENDS This Chapter is Available Only for the Professional Edition PRO
-
3. MARKET OVERVIEW
Understanding the Current State of The Market and Its Prospects
- MARKET SIZE
- MARKET STRUCTURE
- TRADE BALANCE
- PER CAPITA CONSUMPTION
- MARKET FORECAST TO 2030
-
4. MOST PROMISING PRODUCT
Finding New Products to Diversify Your Business
This Chapter is Available Only for the Professional Edition PRO- TOP PRODUCTS TO DIVERSIFY YOUR BUSINESS
- BEST-SELLING PRODUCTS
- MOST CONSUMED PRODUCT
- MOST TRADED PRODUCT
- MOST PROFITABLE PRODUCT FOR EXPORT
-
5. MOST PROMISING SUPPLYING COUNTRIES
Choosing the Best Countries to Establish Your Sustainable Supply Chain
This Chapter is Available Only for the Professional Edition PRO- TOP COUNTRIES TO SOURCE YOUR PRODUCT
- TOP PRODUCING COUNTRIES
- TOP EXPORTING COUNTRIES
- LOW-COST EXPORTING COUNTRIES
-
6. MOST PROMISING OVERSEAS MARKETS
Choosing the Best Countries to Boost Your Exports
This Chapter is Available Only for the Professional Edition PRO- TOP OVERSEAS MARKETS FOR EXPORTING YOUR PRODUCT
- TOP CONSUMING MARKETS
- UNSATURATED MARKETS
- TOP IMPORTING MARKETS
- MOST PROFITABLE MARKETS
7. PRODUCTION
The Latest Trends and Insights into The Industry
- PRODUCTION VOLUME AND VALUE
8. IMPORTS
The Largest Import Supplying Countries
- IMPORTS FROM 2012–2023
- IMPORTS BY COUNTRY
- IMPORT PRICES BY COUNTRY
9. EXPORTS
The Largest Destinations for Exports
- EXPORTS FROM 2012–2023
- EXPORTS BY COUNTRY
- EXPORT PRICES BY COUNTRY
-
10. PROFILES OF MAJOR PRODUCERS
The Largest Producers on The Market and Their Profiles
This Chapter is Available Only for the Professional Edition PRO -
LIST OF TABLES
- Key Findings In 2023
- Market Volume, In Physical Terms, 2012–2023
- Market Value, 2012–2023
- Per Capita Consumption In 2012-2023
- Imports, In Physical Terms, By Country, 2012–2023
- Imports, In Value Terms, By Country, 2012–2023
- Import Prices, By Country Of Origin, 2012–2023
- Exports, In Physical Terms, By Country, 2012–2023
- Exports, In Value Terms, By Country, 2012–2023
- Export Prices, By Country Of Destination, 2012–2023
-
LIST OF FIGURES
- Market Volume, In Physical Terms, 2012–2023
- Market Value, 2012–2023
- Market Structure – Domestic Supply vs. Imports, In Physical Terms, 2012-2023
- Market Structure – Domestic Supply vs. Imports, In Value Terms, 2012-2023
- Trade Balance, In Physical Terms, 2012-2023
- Trade Balance, In Value Terms, 2012-2023
- Per Capita Consumption, 2012-2023
- Market Volume Forecast to 2030
- Market Value Forecast to 2030
- Products: Market Size And Growth, By Type
- Products: Average Per Capita Consumption, By Type
- Products: Exports And Growth, By Type
- Products: Export Prices And Growth, By Type
- Production Volume And Growth
- Exports And Growth
- Export Prices And Growth
- Market Size And Growth
- Per Capita Consumption
- Imports And Growth
- Import Prices
- Production, In Physical Terms, 2012–2023
- Production, In Value Terms, 2012–2023
- Imports, In Physical Terms, 2012–2023
- Imports, In Value Terms, 2012–2023
- Imports, In Physical Terms, By Country, 2023
- Imports, In Physical Terms, By Country, 2012–2023
- Imports, In Value Terms, By Country, 2012–2023
- Import Prices, By Country Of Origin, 2012–2023
- Exports, In Physical Terms, 2012–2023
- Exports, In Value Terms, 2012–2023
- Exports, In Physical Terms, By Country, 2023
- Exports, In Physical Terms, By Country, 2012–2023
- Exports, In Value Terms, By Country, 2012–2023
- Export Prices, By Country Of Destination, 2012–2023


