
China - Graphic Papers - Market Analysis, Forecast, Size, Trends and Insights
Get instant access to more than 2 million reports, dashboards, and datasets on the IndexBox Platform.
View PricingChina's Export of Graphic Papers Plunges to $269M in June 2023
China Graphic Papers Exports
In June 2023, approximately 258K tons of graphic papers were exported from China; declining by -7.2% compared with the previous month. Overall, exports saw a mild decline. The most prominent rate of growth was recorded in February 2023 when exports increased by 8.6% against the previous month.
In value terms, graphic papers exports declined to $269M (IndexBox estimates) in June 2023. In general, exports saw a pronounced contraction. The pace of growth was the most pronounced in November 2022 when exports increased by 17% against the previous month.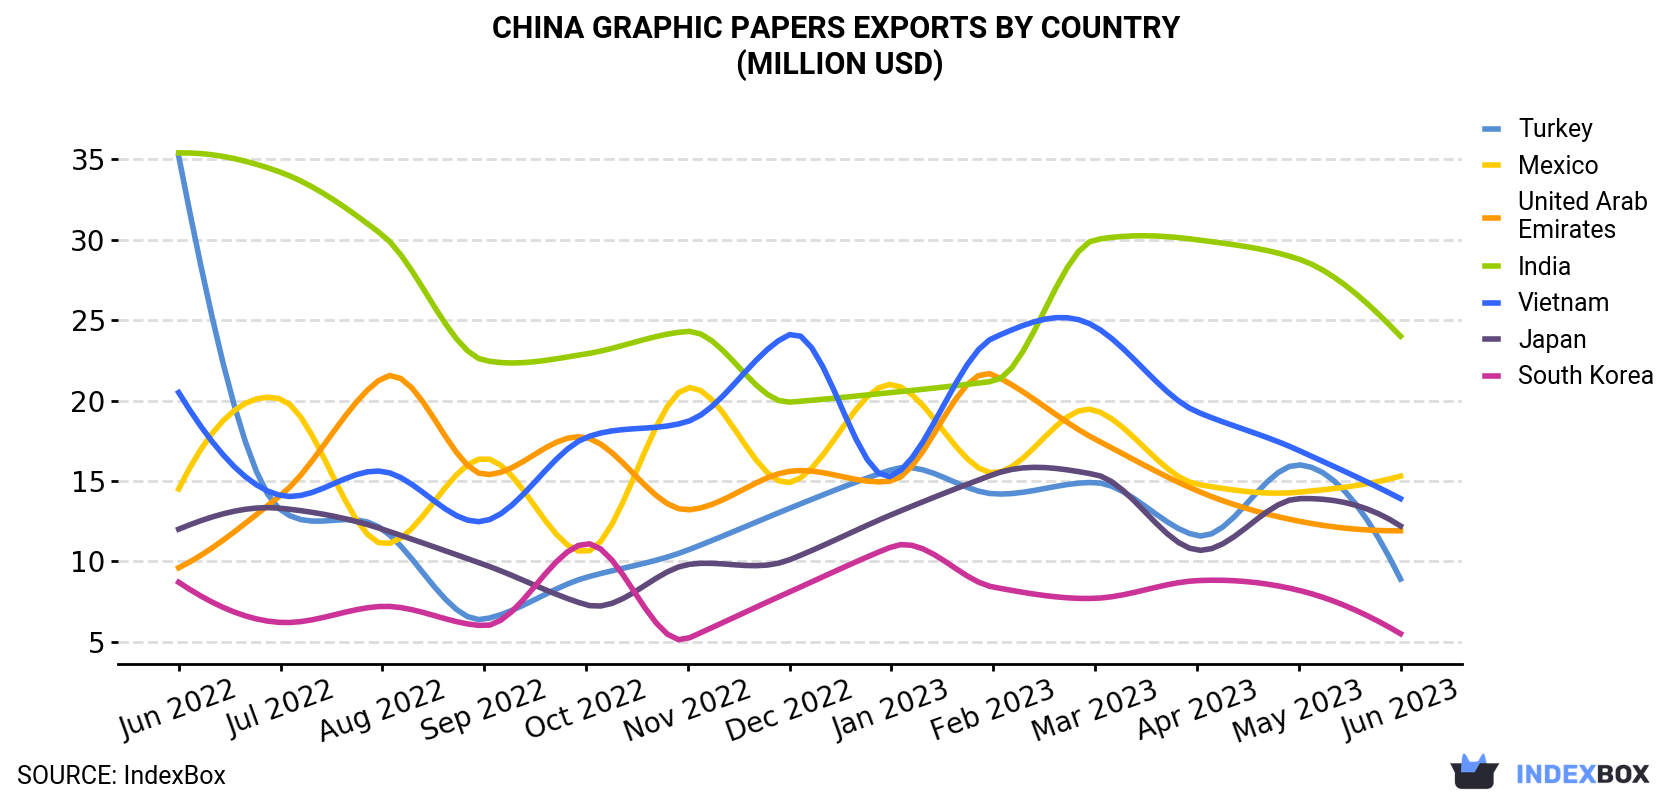
| COUNTRY | Export Value of Graphic Papers in China (million USD) | ||||||||||||
|---|---|---|---|---|---|---|---|---|---|---|---|---|---|
| Jun 2022 | Jul 2022 | Aug 2022 | Sep 2022 | Oct 2022 | Nov 2022 | Dec 2022 | Jan 2023 | Feb 2023 | Mar 2023 | Apr 2023 | May 2023 | Jun 2023 | |
| India | 35.4 | 34.2 | 30.3 | 22.5 | 22.9 | 24.3 | 19.9 | 20.5 | 21.2 | 30.0 | 30.0 | 28.8 | 24.0 |
| Mexico | 14.5 | 20.1 | 11.1 | 16.4 | 10.6 | 20.8 | 14.9 | 21.0 | 15.5 | 19.4 | 14.8 | 14.3 | 15.3 |
| Vietnam | 20.5 | 14.1 | 15.6 | 12.5 | 17.7 | 18.7 | 24.1 | 15.3 | 23.9 | 24.6 | 19.3 | 16.9 | 13.9 |
| Japan | 12.0 | 13.3 | 12.0 | 9.8 | 7.3 | 9.8 | 10.1 | 12.9 | 15.4 | 15.4 | 10.7 | 13.9 | 12.2 |
| United Arab Emirates | 9.6 | 14.1 | 21.4 | 15.4 | 17.7 | 13.2 | 15.6 | 15.0 | 21.6 | 17.6 | 14.4 | 12.5 | 11.9 |
| Turkey | 35.2 | 13.2 | 12.0 | 6.4 | 9.0 | 10.7 | 13.3 | 15.7 | 14.2 | 14.9 | 11.6 | 16.0 | 8.9 |
| South Korea | 8.7 | 6.2 | 7.2 | 6.0 | 11.1 | 5.2 | 8.1 | 10.9 | 8.4 | 7.7 | 8.8 | 8.2 | 5.5 |
| Others | 212 | 236 | 207 | 173 | 172 | 210 | 197 | 174 | 176 | 209 | 198 | 194 | 177 |
| Total | 347 | 351 | 317 | 262 | 269 | 313 | 302 | 286 | 297 | 338 | 308 | 304 | 269 |
Exports by Country
India (22K tons), Mexico (15K tons) and Vietnam (13K tons) were the main destinations of graphic papers exports from China, with a combined 19% share of total exports.
From June 2022 to June 2023, the most notable rate of growth in terms of shipments, amongst the main countries of destination, was attained by Mexico (with a CAGR of +2.4%), while the other leaders experienced mixed trend patterns.
In value terms, the largest markets for graphic papers exported from China were India ($24M), Mexico ($15M) and Vietnam ($14M), together comprising 20% of total exports. These countries were followed by Japan, the United Arab Emirates, Turkey and South Korea, which together accounted for a further 14%.
Among the main countries of destination, the United Arab Emirates, with a CAGR of +1.8%, saw the highest rates of growth with regard to the value of exports, over the period under review, while shipments for the other leaders experienced more modest paces of growth.
Exports by Type
Printing and writing paper (257K tons) was the largest type of graphic papers exported from China, with a 100% share of total exports. It was followed by newsprint (1.1K tons), with a 0.4% share of total exports.
From June 2022 to June 2023, the average monthly growth rate of the volume of export of printing and writing paper stood at -1.4%.
In value terms, printing and writing paper ($268M) remains the largest type of graphic papers exported from China, comprising 100% of total exports. The second position in the ranking was held by newsprint ($1.1M), with a 0.4% share of total exports.
From June 2022 to June 2023, the average monthly growth rate of the export volume of printing and writing paper totaled -2.1%.
Export Prices by Country
In June 2023, the graphic papers price amounted to $1,043 per ton (FOB, China), dropping by -4.8% against the previous month. Over the period under review, the export price recorded a relatively flat trend pattern. The pace of growth was the most pronounced in November 2022 an increase of 12% m-o-m. As a result, the export price reached the peak level of $1,280 per ton. From December 2022 to June 2023, the the average export prices remained at a lower figure.
Average prices varied somewhat for the major foreign markets. In June 2023, the highest price was recorded for prices to Turkey ($1,199 per ton) and Russia ($1,140 per ton), while the average price for exports to the Philippines ($898 per ton) and Japan ($953 per ton) were amongst the lowest.
From June 2022 to June 2023, the most notable rate of growth in terms of prices was recorded for supplies to Turkey (+1.9%), while the prices for the other major destinations experienced more modest paces of growth.
This report provides an in-depth analysis of the graphic papers market in China. Within it, you will discover the latest data on market trends and opportunities by country, consumption, production and price developments, as well as the global trade (imports and exports). The forecast exhibits the market prospects through 2030.
Product coverage:
- FCL 1671 - Newsprint
- FCL 1612 - Printing and writing papers, uncoated, mechanical
- FCL 1615 - Printing and writing papers, uncoated, wood free
- FCL 1616 - Printing and writing papers, coated
Country coverage:
Data coverage:
- Market volume and value
- Per Capita consumption
- Forecast of the market dynamics in the medium term
- Trade (exports and imports) in China
- Export and import prices
- Market trends, drivers and restraints
- Key market players and their profiles
Reasons to buy this report:
- Take advantage of the latest data
- Find deeper insights into current market developments
- Discover vital success factors affecting the market
This report is designed for manufacturers, distributors, importers, and wholesalers, as well as for investors, consultants and advisors.
In this report, you can find information that helps you to make informed decisions on the following issues:
- How to diversify your business and benefit from new market opportunities
- How to load your idle production capacity
- How to boost your sales on overseas markets
- How to increase your profit margins
- How to make your supply chain more sustainable
- How to reduce your production and supply chain costs
- How to outsource production to other countries
- How to prepare your business for global expansion
While doing this research, we combine the accumulated expertise of our analysts and the capabilities of artificial intelligence. The AI-based platform, developed by our data scientists, constitutes the key working tool for business analysts, empowering them to discover deep insights and ideas from the marketing data.
-
1. INTRODUCTION
Making Data-Driven Decisions to Grow Your Business
- REPORT DESCRIPTION
- RESEARCH METHODOLOGY AND AI PLATFORM
- DATA-DRIVEN DECISIONS FOR YOUR BUSINESS
- GLOSSARY AND SPECIFIC TERMS
-
2. EXECUTIVE SUMMARY
A Quick Overview of Market Performance
- KEY FINDINGS
- MARKET TRENDS This Chapter is Available Only for the Professional Edition PRO
-
3. MARKET OVERVIEW
Understanding the Current State of The Market and Its Prospects
- MARKET SIZE
- MARKET STRUCTURE
- TRADE BALANCE
- PER CAPITA CONSUMPTION
- MARKET FORECAST TO 2030
-
4. MOST PROMISING PRODUCT
Finding New Products to Diversify Your Business
This Chapter is Available Only for the Professional Edition PRO- TOP PRODUCTS TO DIVERSIFY YOUR BUSINESS
- BEST-SELLING PRODUCTS
- MOST CONSUMED PRODUCT
- MOST TRADED PRODUCT
- MOST PROFITABLE PRODUCT FOR EXPORT
-
5. MOST PROMISING SUPPLYING COUNTRIES
Choosing the Best Countries to Establish Your Sustainable Supply Chain
This Chapter is Available Only for the Professional Edition PRO- TOP COUNTRIES TO SOURCE YOUR PRODUCT
- TOP PRODUCING COUNTRIES
- TOP EXPORTING COUNTRIES
- LOW-COST EXPORTING COUNTRIES
-
6. MOST PROMISING OVERSEAS MARKETS
Choosing the Best Countries to Boost Your Exports
This Chapter is Available Only for the Professional Edition PRO- TOP OVERSEAS MARKETS FOR EXPORTING YOUR PRODUCT
- TOP CONSUMING MARKETS
- UNSATURATED MARKETS
- TOP IMPORTING MARKETS
- MOST PROFITABLE MARKETS
7. PRODUCTION
The Latest Trends and Insights into The Industry
- PRODUCTION VOLUME AND VALUE
8. IMPORTS
The Largest Import Supplying Countries
- IMPORTS FROM 2012–2023
- IMPORTS BY COUNTRY
- IMPORT PRICES BY COUNTRY
9. EXPORTS
The Largest Destinations for Exports
- EXPORTS FROM 2012–2023
- EXPORTS BY COUNTRY
- EXPORT PRICES BY COUNTRY
-
10. PROFILES OF MAJOR PRODUCERS
The Largest Producers on The Market and Their Profiles
This Chapter is Available Only for the Professional Edition PRO -
LIST OF TABLES
- Key Findings In 2023
- Market Volume, In Physical Terms, 2012–2023
- Market Value, 2012–2023
- Per Capita Consumption In 2012-2023
- Imports, In Physical Terms, By Country, 2012–2023
- Imports, In Value Terms, By Country, 2012–2023
- Import Prices, By Country Of Origin, 2012–2023
- Exports, In Physical Terms, By Country, 2012–2023
- Exports, In Value Terms, By Country, 2012–2023
- Export Prices, By Country Of Destination, 2012–2023
-
LIST OF FIGURES
- Market Volume, In Physical Terms, 2012–2023
- Market Value, 2012–2023
- Market Structure – Domestic Supply vs. Imports, In Physical Terms, 2012-2023
- Market Structure – Domestic Supply vs. Imports, In Value Terms, 2012-2023
- Trade Balance, In Physical Terms, 2012-2023
- Trade Balance, In Value Terms, 2012-2023
- Per Capita Consumption, 2012-2023
- Market Volume Forecast to 2030
- Market Value Forecast to 2030
- Products: Market Size And Growth, By Type
- Products: Average Per Capita Consumption, By Type
- Products: Exports And Growth, By Type
- Products: Export Prices And Growth, By Type
- Production Volume And Growth
- Exports And Growth
- Export Prices And Growth
- Market Size And Growth
- Per Capita Consumption
- Imports And Growth
- Import Prices
- Production, In Physical Terms, 2012–2023
- Production, In Value Terms, 2012–2023
- Imports, In Physical Terms, 2012–2023
- Imports, In Value Terms, 2012–2023
- Imports, In Physical Terms, By Country, 2023
- Imports, In Physical Terms, By Country, 2012–2023
- Imports, In Value Terms, By Country, 2012–2023
- Import Prices, By Country Of Origin, 2012–2023
- Exports, In Physical Terms, 2012–2023
- Exports, In Value Terms, 2012–2023
- Exports, In Physical Terms, By Country, 2023
- Exports, In Physical Terms, By Country, 2012–2023
- Exports, In Value Terms, By Country, 2012–2023
- Export Prices, By Country Of Destination, 2012–2023


