
U.S. - Cellular Plates, Sheets, Film, Foil and Strip of Plastics - Market Analysis, Forecast, Size, Trends And Insights
Get instant access to more than 2 million reports, dashboards, and datasets on the IndexBox Platform.
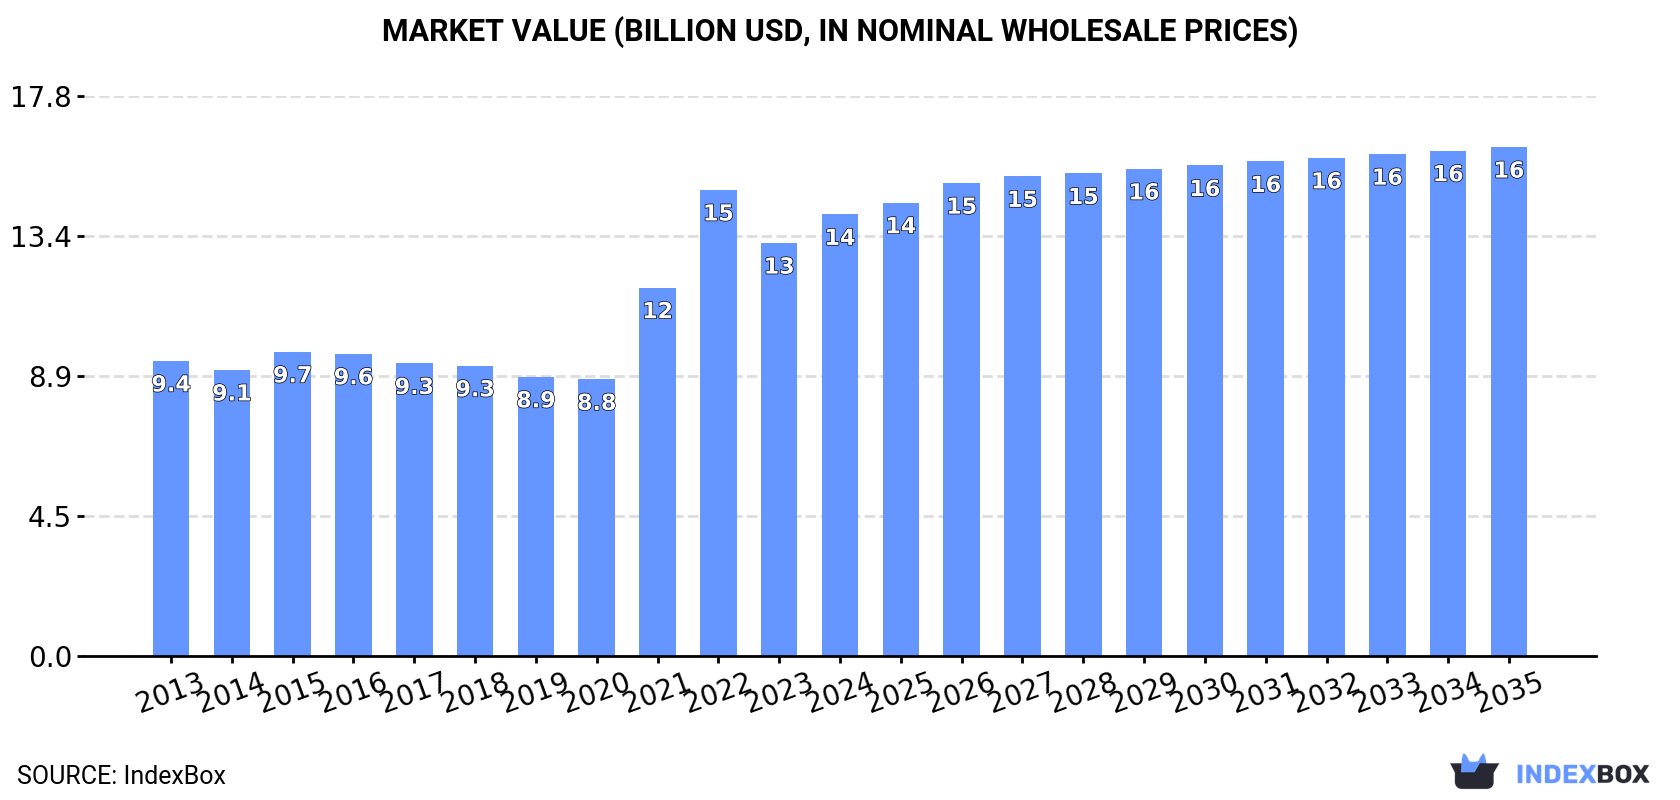
View PricingUnited States' Cellular Plastics Market Forecast Shows Modest Growth With a 1.3% CAGR in Value
IndexBox has just published a new report: U.S. - Cellular Plates, Sheets, Film, Foil and Strip of Plastics - Market Analysis, Forecast, Size, Trends And Insights.
This market analysis provides a comprehensive overview of the US market for cellular plates, sheets, film, foil, and strip of plastics. It details historical and current data on consumption, production, imports, and exports, segmented by product type and key trading partners. The report forecasts market growth to 2035, projecting a volume of 2.4M tons and a value of $16.2B, driven by sustained demand. Key insights include the dominance of styrene and polyurethane products, significant import reliance on China and Canada, and Mexico's role as the primary high-value export destination, alongside notable price disparities across product categories and trade routes.
Key Findings
- US market forecast to grow to 2.4M tons and $16.2B by 2035, with a decelerating CAGR of +0.6% in volume and +1.3% in value
- Consumption and production are dominated by cellular plates/sheets/films of styrene and polyurethane polymers
- Major import sources are China, Canada, and Mexico by volume, but South Korea leads by value due to higher prices
- Mexico is the top export destination by value, accounting for 41% of total US export revenue
- Significant price gaps exist, with import prices averaging $7,366/ton and export prices reaching $20,460/ton in 2024
Market Forecast
Driven by increasing demand for cellular plates, sheets, film, foil and strip of plastics in the United States, the market is expected to continue an upward consumption trend over the next decade. Market performance is forecast to decelerate, expanding with an anticipated CAGR of +0.6% for the period from 2024 to 2035, which is projected to bring the market volume to 2.4M tons by the end of 2035.
In value terms, the market is forecast to increase with an anticipated CAGR of +1.3% for the period from 2024 to 2035, which is projected to bring the market value to $16.2B (in nominal wholesale prices) by the end of 2035.
Consumption
United States's Consumption of Cellular Plates, Sheets, Film, Foil and Strip of Plastics
In 2024, approx. 2.2M tons of cellular plates, sheets, film, foil and strip of plastics were consumed in the United States; growing by 5.2% compared with 2023 figures. The total consumption volume increased at an average annual rate of +3.0% over the period from 2013 to 2024; however, the trend pattern indicated some noticeable fluctuations being recorded throughout the analyzed period. Over the period under review, consumption of reached the maximum volume at 2.3M tons in 2022; however, from 2023 to 2024, consumption remained at a lower figure.
The value of the market for cellular plates, sheets, film, foil and strip of plastics in the United States expanded rapidly to $14.1B in 2024, with an increase of 7% against the previous year. This figure reflects the total revenues of producers and importers (excluding logistics costs, retail marketing costs, and retailers' margins, which will be included in the final consumer price). Overall, the total consumption indicated pronounced growth from 2013 to 2024: its value increased at an average annual rate of +3.7% over the last eleven years. The trend pattern, however, indicated some noticeable fluctuations being recorded throughout the analyzed period. Based on 2024 figures, consumption decreased by -5.2% against 2022 indices. Over the period under review, the market reached the peak level at $14.9B in 2022; however, from 2023 to 2024, consumption failed to regain momentum.
Consumption By Type
Cellular plates, sheets and films of polyymers of styrene (1.1M tons), cellular plates, sheets and films of polyymers of polyurethanes (895K tons) and cellular plates, sheets and films of polyymers of vinyl chloride (130K tons) were the main products of consumption of cellular plates, sheets, film, foil and strip of plastics in the United States, together accounting for 100% of the total volume. Cellular plates, sheets and films of regenerated cellulose lagged somewhat behind, accounting for a further 0.4%.
From 2013 to 2024, the biggest increases were recorded for cellular plates, sheets and films of regenerated cellulose (with a CAGR of +7.4%), while plastics for the other products experienced more modest paces of growth.
In value terms, cellular plates, sheets, film, foil and strip of plastics with the largest market size in the United States were cellular plates, sheets and films of polyymers of styrene ($7.6B), cellular plates, sheets and films of polyymers of polyurethanes ($5.3B) and cellular plates, sheets and films of polyymers of vinyl chloride ($463M), together comprising 100% of the total market. Cellular plates, sheets and films of regenerated cellulose lagged somewhat behind, accounting for a further 0.4%.
Cellular plates, sheets and films of regenerated cellulose, with a CAGR of +10.9%, recorded the highest rates of growth with regard to market size among the main consumed products over the period under review, while plastics for the other products experienced more modest paces of growth.
Production
United States's Production of Cellular Plates, Sheets, Film, Foil and Strip of Plastics
Production of cellular plates, sheets, film, foil and strip of plastics in the United States expanded modestly to 2.1M tons in 2024, growing by 4% on the previous year's figure. The total output volume increased at an average annual rate of +2.1% over the period from 2013 to 2024; the trend pattern remained consistent, with only minor fluctuations being recorded throughout the analyzed period. The growth pace was the most rapid in 2021 with an increase of 22%. Over the period under review, production of hit record highs at 2.2M tons in 2022; however, from 2023 to 2024, production remained at a lower figure.
In value terms, production of cellular plates, sheets, film, foil and strip of plastics rose significantly to $13.7B in 2024. Over the period under review, the total production indicated notable growth from 2013 to 2024: its value increased at an average annual rate of +3.3% over the last eleven years. The trend pattern, however, indicated some noticeable fluctuations being recorded throughout the analyzed period. Based on 2024 figures, production decreased by -5.9% against 2022 indices. The growth pace was the most rapid in 2021 when the production volume increased by 31%. Over the period under review, production of hit record highs at $14.6B in 2022; however, from 2023 to 2024, production failed to regain momentum.
Production By Type
Cellular plates, sheets and films of polyymers of styrene (1.1M tons), cellular plates, sheets and films of polyymers of polyurethanes (854K tons) and cellular plates, sheets and films of polyymers of vinyl chloride (52K tons) were the main products of production of cellular plates, sheets, film, foil and strip of plastics in the United States, together accounting for 100% of the total output.
From 2013 to 2024, the biggest increases were recorded for cellular plates, sheets and films of polyymers of styrene (with a CAGR of +1.1%), while plastics for the other products experienced mixed trend patterns.
In value terms, the most produced types of cellular plates, sheets, film, foil and strip of plastics in the United States were cellular plates, sheets and films of polyymers of styrene ($7.7B), cellular plates, sheets and films of polyymers of polyurethanes ($5B) and cellular plates, sheets and films of polyymers of vinyl chloride ($161M), together comprising 100% of the total output. These products were followed by cellular plates, sheets and films of regenerated cellulose, which accounted for a further 0.5%.
In terms of the main produced products, cellular plates, sheets and films of regenerated cellulose, with a CAGR of +4.5%, recorded the highest rates of growth with regard to market size over the period under review, while plastics for the other products experienced mixed trend patterns.
Imports
United States's Imports of Cellular Plates, Sheets, Film, Foil and Strip of Plastics
In 2024, imports of cellular plates, sheets, film, foil and strip of plastics into the United States rose rapidly to 244K tons, with an increase of 5.8% compared with the previous year's figure. In general, imports posted a strong expansion. The most prominent rate of growth was recorded in 2021 when imports increased by 30%. As a result, imports reached the peak of 251K tons. From 2022 to 2024, the growth of imports of failed to regain momentum.
In value terms, imports of cellular plates, sheets, film, foil and strip of plastics totaled $1.8B in 2024. Over the period under review, imports enjoyed a strong expansion. The pace of growth was the most pronounced in 2021 when imports increased by 24% against the previous year. Over the period under review, imports of hit record highs in 2024 and are likely to continue growth in years to come.
Imports By Country
China (50K tons), Canada (49K tons) and Mexico (31K tons) were the main suppliers of imports of cellular plates, sheets, film, foil and strip of plastics to the United States, together comprising 57% of total imports. India, Germany, South Korea, Taiwan (Chinese), Turkey, Japan, Vietnam, Costa Rica and Colombia lagged somewhat behind, together comprising a further 33%.
From 2013 to 2023, the biggest increases were recorded for Turkey (with a CAGR of +52.2%), while purchases for the other leaders experienced more modest paces of growth.
In value terms, the largest cellular plates, sheets, film, foil and strip of plastics suppliers to the United States were South Korea ($334M), Canada ($219M) and Mexico ($135M), with a combined 39% share of total imports. Germany, China, Japan, India, Costa Rica, Taiwan (Chinese), Vietnam, Colombia and Turkey lagged somewhat behind, together comprising a further 33%.
Turkey, with a CAGR of +53.4%, recorded the highest rates of growth with regard to the value of imports, among the main suppliers over the period under review, while purchases for the other leaders experienced more modest paces of growth.
Imports By Type
Plastics; plates, sheets, film, foil and strip, of plastics n.e.s. in heading no. 3921, cellular (83K tons), cellular plates, sheets and films of polyymers of vinyl chloride (81K tons) and cellular plates, sheets and films of polyymers of polyurethanes (53K tons) were the main products of imports of cellular plates, sheets, film, foil and strip of plastics to the United States, together accounting for 89% of total imports. Cellular plates, sheets and films of polyymers of styrene and cellular plates, sheets and films of regenerated cellulose lagged somewhat behind, together accounting for a further 11%.
From 2013 to 2024, the most notable rate of growth in terms of purchases, amongst the major product types, was attained by cellular plates, sheets and films of regenerated cellulose (with a CAGR of +17.6%), while imports for the other products experienced more modest paces of growth.
In value terms, plastics; plates, sheets, film, foil and strip, of plastics n.e.s. in heading no. 3921, cellular ($1B) constituted the largest type of cellular plates, sheets, film, foil and strip of plastics supplied to the United States, comprising 58% of total imports. The second position in the ranking was held by cellular plates, sheets and films of polyymers of polyurethanes ($329M), with an 18% share of total imports. It was followed by cellular plates, sheets and films of polyymers of vinyl chloride, with a 15% share.
From 2013 to 2024, the average annual rate of growth in terms of the value of plastics; plates, sheets, film, foil and strip, of plastics n.e.s. in heading no. 3921, cellular imports stood at +10.4%. With regard to the other supplied products, the following average annual rates of growth were recorded: cellular plates, sheets and films of polyymers of polyurethanes (+2.3% per year) and cellular plates, sheets and films of polyymers of vinyl chloride (+3.1% per year).
Import Prices By Type
In 2024, the average import price for cellular plates, sheets, film, foil and strip of plastics amounted to $7,366 per ton, reducing by -4% against the previous year. In general, the import price recorded a relatively flat trend pattern. The pace of growth appeared the most rapid in 2022 when the average import price increased by 24% against the previous year. As a result, import price attained the peak level of $7,802 per ton. From 2023 to 2024, the average import prices remained at a somewhat lower figure.
There were significant differences in the average prices amongst the major supplied products. In 2024, the product with the highest price was plastics; plates, sheets, film, foil and strip, of plastics n.e.s. in heading no. 3921, cellular ($12,643 per ton), while the price for cellular plates, sheets and films of polyymers of vinyl chloride ($3,422 per ton) was amongst the lowest.
From 2013 to 2024, the most notable rate of growth in terms of prices was attained by polyurethane cellular plates, sheets and films (+0.8%), while the prices for the other products experienced a decline.
Import Prices By Country
The average import price for cellular plates, sheets, film, foil and strip of plastics stood at $7,674 per ton in 2023, shrinking by -1.6% against the previous year. In general, the import price, however, continues to indicate a relatively flat trend pattern. The pace of growth appeared the most rapid in 2022 an increase of 24%. As a result, import price reached the peak level of $7,802 per ton, and then fell slightly in the following year.
There were significant differences in the average prices amongst the major supplying countries. In 2023, amid the top importers, the country with the highest price was South Korea ($32,016 per ton), while the price for China ($2,428 per ton) was amongst the lowest.
From 2013 to 2023, the most notable rate of growth in terms of prices was attained by South Korea (+16.9%), while the prices for the other major suppliers experienced more modest paces of growth.
Exports
United States's Exports of Cellular Plates, Sheets, Film, Foil and Strip of Plastics
In 2024, after two years of growth, there was significant decline in shipments abroad of cellular plates, sheets, film, foil and strip of plastics, when their volume decreased by -13.4% to 102K tons. Overall, exports continue to indicate a abrupt shrinkage. The pace of growth was the most pronounced in 2023 with an increase of 18%. Over the period under review, the exports of reached the peak figure at 266K tons in 2019; however, from 2020 to 2024, the exports remained at a lower figure.
In value terms, exports of cellular plates, sheets, film, foil and strip of plastics expanded modestly to $2.1B in 2024. The total export value increased at an average annual rate of +3.4% over the period from 2013 to 2024; however, the trend pattern indicated some noticeable fluctuations being recorded in certain years. The most prominent rate of growth was recorded in 2022 when exports increased by 16% against the previous year. The exports peaked in 2024 and are likely to see steady growth in the immediate term.
Exports By Country
Canada (39K tons), Mexico (38K tons) and Malaysia (7.4K tons) were the main destinations of exports of cellular plates, sheets, film, foil and strip of plastics from the United States, with a combined 72% share of total exports.
From 2013 to 2023, the most notable rate of growth in terms of shipments, amongst the main countries of destination, was attained by Malaysia (with a CAGR of +24.3%), while the other leaders experienced mixed trend patterns.
In value terms, Mexico ($823M) remains the key foreign market for cellular plates, sheets, film, foil and strip of plastics exports from the United States, comprising 41% of total exports. The second position in the ranking was taken by Canada ($377M), with a 19% share of total exports. It was followed by China, with a 6.5% share.
From 2013 to 2023, the average annual growth rate of value to Mexico amounted to +4.1%. Exports to the other major destinations recorded the following average annual rates of exports growth: Canada (+2.6% per year) and China (+2.4% per year).
Exports By Type
Plastics; plates, sheets, film, foil and strip, of plastics n.e.s. in heading no. 3921, cellular (66K tons) was the largest type of cellular plates, sheets, film, foil and strip of plastics exported from the United States, accounting for a 65% share of total exports. Moreover, plastics; plates, sheets, film, foil and strip, of plastics n.e.s. in heading no. 3921, cellular exceeded the volume of the second product type, cellular plates, sheets and films of polyymers of styrene (17K tons), fourfold. The third position in this ranking was taken by cellular plates, sheets and films of polyymers of polyurethanes (13K tons), with a 13% share.
From 2013 to 2024, the average annual rate of growth in terms of the volume of plastics; plates, sheets, film, foil and strip, of plastics n.e.s. in heading no. 3921, cellular exports totaled +4.1%. With regard to the other exported products, the following average annual rates of growth were recorded: cellular plates, sheets and films of polyymers of styrene (-0.8% per year) and cellular plates, sheets and films of polyymers of polyurethanes (-14.9% per year).
In value terms, plastics; plates, sheets, film, foil and strip, of plastics n.e.s. in heading no. 3921, cellular ($867M), cellular plates, sheets and films of polyymers of polyurethanes ($722M) and cellular plates, sheets and films of polyymers of vinyl chloride ($366M) appeared to be the most exported types of cellular plates, sheets, film, foil and strip of plastics from the United States worldwide, together comprising 93% of total exports.
Among the main product categories, plastics; plates, sheets, film, foil and strip, of plastics n.e.s. in heading no. 3921, cellular, with a CAGR of +4.9%, saw the highest rates of growth with regard to the value of exports, over the period under review, while shipments for the other products experienced more modest paces of growth.
Export Prices By Type
The average export price for cellular plates, sheets, film, foil and strip of plastics stood at $20,460 per ton in 2024, surging by 19% against the previous year. Over the period under review, the export price showed a buoyant expansion. The pace of growth appeared the most rapid in 2020 when the average export price increased by 118%. Over the period under review, the average export prices attained the peak figure in 2024 and is likely to continue growth in the immediate term.
There were significant differences in the average prices for the major types of exported product. In 2024, the product with the highest price was cellular plates, sheets and films of polyymers of vinyl chloride ($116,381 per ton), while the average price for exports of cellular plates, sheets and films of regenerated cellulose ($6,250 per ton) was amongst the lowest.
From 2013 to 2024, the most notable rate of growth in terms of prices was recorded for the following types: PVC cellular plates, sheets and films (+34.9%), while the prices for the other products experienced more modest paces of growth.
Export Prices By Country
In 2023, the average export price for cellular plates, sheets, film, foil and strip of plastics amounted to $17,167 per ton, with a decrease of -11.6% against the previous year. In general, the export price, however, enjoyed a remarkable increase. The pace of growth appeared the most rapid in 2020 an increase of 118% against the previous year. Over the period under review, the average export prices reached the peak figure at $19,414 per ton in 2022, and then reduced in the following year.
Prices varied noticeably by country of destination: amid the top suppliers, the country with the highest price was the UK ($69,121 per ton), while the average price for exports to Malaysia ($2,350 per ton) was amongst the lowest.
From 2013 to 2023, the most notable rate of growth in terms of prices was recorded for supplies to Mexico (+14.2%), while the prices for the other major destinations experienced more modest paces of growth.
This report provides a comprehensive view of the cellular plates, sheets, film, foil and strip of plastics industry in the United States, tracking demand, supply, and trade flows across the national value chain. It explains how demand across key channels and end-use segments shapes consumption patterns, while also mapping the role of input availability, production efficiency, and regulatory standards on supply.
Beyond headline metrics, the study benchmarks prices, margins, and trade routes so you can see where value is created and how it moves between domestic suppliers and international partners. The analysis is designed to support strategic planning, market entry, portfolio prioritization, and risk management in the cellular plates, sheets, film, foil and strip of plastics landscape in the United States.
Quick navigation
- Key findings
- Report scope
- Product coverage
- Country coverage
- Methodology
- Forecasts to 2035
- Price analysis
- Market participants
- Country profiles
- How to use this report
- FAQ
Key findings
- Domestic demand is shaped by both household and industrial usage, with trade flows linking local supply to imports and exports.
- Pricing dynamics reflect unit values, freight costs, exchange rates, and regulatory shifts that affect sourcing decisions.
- Supply depends on input availability and production efficiency, creating a distinct national cost curve.
- Market concentration varies by segment, creating different competitive landscapes and entry barriers.
- The 2035 outlook highlights where capacity investment and demand growth are most aligned within the country.
Report scope
The report combines market sizing with trade intelligence and price analytics for the United States. It covers both historical performance and the forward outlook to 2035, allowing you to compare cycles, structural shifts, and policy impacts.
- Market size and growth in value and volume terms
- Consumption structure by end-use segments
- Production capacity, output, and cost dynamics
- Trade flows, exporters, importers, and balances
- Price benchmarks, unit values, and margin signals
- Competitive context and market entry conditions
Product coverage
- Prodcom 22214120 - Cellular plates, sheet, film, foil and strip of polymers of styrene
- Prodcom 22214150 - Cellular plates, sheets, film, foil and strip of polyurethanes
- Prodcom 22214130 - Cellular plates, sheets, film, foil and strip of polymers of vinyl chloride
- Prodcom 22214170 - Cellular plates, sheets, film, foil and strip of regenerated cellulose
Country coverage
- United States
Country profile and benchmarks
This report provides a consistent view of market size, trade balance, prices, and per-capita indicators for the United States. The profile highlights demand structure and trade position, enabling benchmarking against regional and global peers.
Methodology
The analysis is built on a multi-source framework that combines official statistics, trade records, company disclosures, and expert validation. Data are standardized, reconciled, and cross-checked to ensure consistency across time series.
- International trade data (exports, imports, and mirror statistics)
- National production and consumption statistics
- Company-level information from financial filings and public releases
- Price series and unit value benchmarks
- Analyst review, outlier checks, and time-series validation
All data are normalized to a common product definition and mapped to a consistent set of codes. This ensures that comparisons across time are aligned and actionable.
Forecasts to 2035
The forecast horizon extends to 2035 and is based on a structured model that links cellular plates, sheets, film, foil and strip of plastics demand and supply to macroeconomic indicators, trade patterns, and sector-specific drivers. The model captures both cyclical and structural factors and reflects known policy and technology shifts in the United States.
- Historical baseline: 2012-2025
- Forecast horizon: 2026-2035
- Scenario-based sensitivity to income growth, substitution, and regulation
- Capacity and investment outlook for major producing companies
Each projection is built from national historical patterns and the broader regional context, allowing the report to show where growth is concentrated and where risks are elevated.
Price analysis and trade dynamics
Prices are analyzed in detail, including export and import unit values, regional spreads, and changes in trade costs. The report highlights how seasonality, freight rates, exchange rates, and supply disruptions influence pricing and margins.
- Price benchmarks by country and sub-region
- Export and import unit value trends
- Seasonality and calendar effects in trade flows
- Price outlook to 2035 under baseline assumptions
Profiles of market participants
Key producers, exporters, and distributors are profiled with a focus on their operational scale, geographic footprint, product mix, and market positioning. This helps identify competitive pressure points, partnership opportunities, and routes to differentiation.
- Business focus and production capabilities
- Geographic reach and distribution networks
- Cost structure and pricing strategy indicators
- Compliance, certification, and sustainability context
How to use this report
- Quantify domestic demand and identify the most attractive segments
- Evaluate export opportunities and prioritize target destinations
- Track price dynamics and protect margins
- Benchmark performance against leading competitors
- Build evidence-based forecasts for investment decisions
This report is designed for manufacturers, distributors, importers, wholesalers, investors, and advisors who need a clear, data-driven picture of cellular plates, sheets, film, foil and strip of plastics dynamics in the United States.
FAQ
What is included in the cellular plates, sheets, film, foil and strip of plastics market in the United States?
The market size aggregates consumption and trade data, presented in both value and volume terms.
How are the forecasts to 2035 built?
The projections combine historical trends with macroeconomic indicators, trade dynamics, and sector-specific drivers.
Does the report cover prices and margins?
Yes, it includes export and import unit values, regional spreads, and a pricing outlook to 2035.
Which benchmarks are included?
The report benchmarks market size, trade balance, prices, and per-capita indicators for the United States.
Can this report support market entry decisions?
Yes, it highlights demand hotspots, trade routes, pricing trends, and competitive context.
-
1. INTRODUCTION
Making Data-Driven Decisions to Grow Your Business
- REPORT DESCRIPTION
- RESEARCH METHODOLOGY AND THE AI PLATFORM
- DATA-DRIVEN DECISIONS FOR YOUR BUSINESS
- GLOSSARY AND SPECIFIC TERMS
-
2. EXECUTIVE SUMMARY
A Quick Overview of Market Performance
- KEY FINDINGS
- MARKET TRENDS This Chapter is Available Only for the Professional Edition PRO
-
3. MARKET OVERVIEW
Understanding the Current State of The Market and its Prospects
- MARKET SIZE: HISTORICAL DATA (2012–2025) AND FORECAST (2026–2035)
- MARKET STRUCTURE: HISTORICAL DATA (2012–2025) AND FORECAST (2026–2035)
- CONSUMPTION BY TYPE: HISTORICAL DATA (2012–2025) AND FORECAST (2026–2035)
- TRADE BALANCE: HISTORICAL DATA (2012–2025) AND FORECAST (2026–2035)
- PER CAPITA CONSUMPTION: HISTORICAL DATA (2012–2025) AND FORECAST (2026–2035)
- MARKET FORECAST TO 2035
-
4. MOST PROMISING PRODUCTS FOR DIVERSIFICATION
Finding New Products to Diversify Your Business
- TOP PRODUCTS TO DIVERSIFY YOUR BUSINESS
- BEST-SELLING PRODUCTS
- MOST CONSUMED PRODUCTS
- MOST TRADED PRODUCTS
- MOST PROFITABLE PRODUCTS FOR EXPORTS
-
5. MOST PROMISING SUPPLYING COUNTRIES
Choosing the Best Countries to Establish Your Sustainable Supply Chain
- TOP COUNTRIES TO SOURCE YOUR PRODUCT
- TOP PRODUCING COUNTRIES
- TOP EXPORTING COUNTRIES
- LOW-COST EXPORTING COUNTRIES
-
6. MOST PROMISING OVERSEAS MARKETS
Choosing the Best Countries to Boost Your Export
- TOP OVERSEAS MARKETS FOR EXPORTING YOUR PRODUCT
- TOP CONSUMING MARKETS
- UNSATURATED MARKETS
- TOP IMPORTING MARKETS
- MOST PROFITABLE MARKETS
-
7. PRODUCTION
The Latest Trends and Insights into The Industry
- PRODUCTION VOLUME AND VALUE: HISTORICAL DATA (2012–2025) AND FORECAST (2026–2035)
- PRODUCTION BY TYPE: HISTORICAL DATA (2012–2025) AND FORECAST (2026–2035)
-
8. IMPORTS
The Largest Import Supplying Countries
- IMPORTS: HISTORICAL DATA (2012–2025) AND FORECAST (2026–2035)
- IMPORTS BY TYPE: HISTORICAL DATA (2012–2025) AND FORECAST (2026–2035)
- IMPORTS BY COUNTRY: HISTORICAL DATA (2012–2025)
- IMPORT PRICES BY TYPE AND COUNTRY: HISTORICAL DATA (2012–2025)
-
9. EXPORTS
The Largest Destinations for Exports
- EXPORTS: HISTORICAL DATA (2012–2025) AND FORECAST (2026–2035)
- EXPORTS BY TYPE: HISTORICAL DATA (2012–2025) AND FORECAST (2026–2035)
- EXPORTS BY COUNTRY: HISTORICAL DATA (2012–2025)
- EXPORT PRICES BY TYPE AND COUNTRY: HISTORICAL DATA (2012–2025)
-
10. PROFILES OF MAJOR PRODUCERS
The Largest Producers on The Market and Their Profiles
-
LIST OF TABLES
- Key Findings In 2025
- Market Volume, In Physical Terms: Historical Data (2012–2025) and Forecast (2026–2035)
- Market Value: Historical Data (2012–2025) and Forecast (2026–2035)
- Consumption, in Physical and Value Terms, by Type: Historical Data (2012–2025) and Forecast (2026–2035)
- Per Capita Consumption: Historical Data (2012–2025) and Forecast (2026–2035)
- Production, in Physical and Value Terms, by Type: Historical Data (2012–2025) and Forecast (2026–2035)
- Imports, in Physical and Value Terms, by Type: Historical Data (2012–2025) and Forecast (2026–2035)
- Imports, In Physical Terms, By Country, 2012-2025
- Imports, In Value Terms, By Country, 2012-2025
- Import Prices, By Country, 2012-2025
- Import Prices, by Type: Historical Data (2012–2025) and Forecast (2026–2035)
- Exports, in Physical and Value Terms, by Type: Historical Data (2012–2025) and Forecast (2026–2035)
- Exports, In Physical Terms, By Country, 2012-2025
- Exports, In Value Terms, By Country, 2012-2025
- Exports Prices, By Country, 2012-2025
- Exports Prices, by Type: Historical Data (2012–2025) and Forecast (2026–2035)
-
LIST OF FIGURES
- Market Volume, in Physical Terms: Historical Data (2012–2025) and Forecast (2026–2035)
- Market Value: Historical Data (2012–2025) and Forecast (2026–2035)
- Consumption, By Type, 2025
- Consumption, in Physical Terms, by Type: Historical Data (2012–2025) and Forecast (2026–2035)
- Consumption, in Value Terms, by Type: Historical Data (2012–2025) and Forecast (2026–2035)
- Consumption, Per Capita, by Type: Historical Data (2012–2025) and Forecast (2026–2035)
- Market Structure – Domestic Supply Vs. Imports, in Physical Terms: Historical Data (2012–2025) and Forecast (2026–2035)
- Market Structure – Domestic Supply Vs. Imports, in Value Terms: Historical Data (2012–2025) and Forecast (2026–2035)
- Trade Balance, in Physical Terms: Historical Data (2012–2025) and Forecast (2026–2035)
- Trade Balance, in Value Terms: Historical Data (2012–2025) and Forecast (2026–2035)
- Per Capita Consumption: Historical Data (2012–2025) and Forecast (2026–2035)
- Market Volume Forecast to 2035
- Market Value Forecast to 2035
- Market Size and Growth, by Product
- Average Per Capita Consumption, by Product
- Exports and Growth, by Product
- Export Prices and Growth, by Product
- Production Volume and Growth
- Exports and Growth
- Export Prices and Growth
- Market Size and Growth
- Per Capita Consumption
- Imports and Growth
- Import Prices
- Production, in Physical Terms: Historical Data (2012–2025) and Forecast (2026–2035)
- Production, in Value Terms: Historical Data (2012–2025) and Forecast (2026–2035)
- Production, By Type, 2025
- Production, in Physical Terms, by Type: Historical Data (2012–2025) and Forecast (2026–2035)
- Production, in Value Terms, by Type: Historical Data (2012–2025) and Forecast (2026–2035)
- Imports, in Physical Terms: Historical Data (2012–2025) and Forecast (2026–2035)
- Imports, in Value Terms: Historical Data (2012–2025) and Forecast (2026–2035)
- Imports, By Type, 2025
- Imports, in Physical Terms, by Type: Historical Data (2012–2025) and Forecast (2026–2035)
- Imports, in Value Terms, by Type: Historical Data (2012–2025) and Forecast (2026–2035)
- Imports, in Physical Terms, by Country, 2025
- Imports, in Physical Terms, by Country, 2012-2025
- Imports, in Value Terms, by Country, 2012-2025
- Import Prices, by Country, 2012-2025
- Import Prices, by Type: Historical Data (2012–2025) and Forecast (2026–2035)
- Exports, in Physical Terms: Historical Data (2012–2025) and Forecast (2026–2035)
- Exports, in Value Terms: Historical Data (2012–2025) and Forecast (2026–2035)
- Exports, By Type, 2025
- Exports, in Physical Terms, by Type: Historical Data (2012–2025) and Forecast (2026–2035)
- Exports, in Value Terms, by Type: Historical Data (2012–2025) and Forecast (2026–2035)
- Exports, in Physical Terms, by Country, 2025
- Exports, in Physical Terms, by Country, 2012-2025
- Exports, in Value Terms, by Country, 2012-2025
- Export Prices, by Country, 2012-2025
- Export Prices, by Type: Historical Data (2012–2025) and Forecast (2026–2035)
Recommended posts
Free Data: Cellular Plates, Sheets, Film, Foil and Strip of Plastics - United States
Instant access. No credit card needed.


