Doormat Market Analysis: Rating vs Review Strategies for Brand Growth
Key Findings
The analysis of the doormat market reveals several critical strategic insights for brand positioning and growth.
- Market leadership is concentrated with a few brands, yet significant opportunities exist in niche and premium segments.
- A strong correlation exists between high review volume and high ratings, but some brands defy this trend, indicating potential quality or marketing issues.
- The market exhibits clear price segmentation, with distinct clusters for budget, mass-market, and premium strategies.
- Assortment breadth, as indicated by the number of offers, is a key lever for sales volume, particularly in the low-to-mid price range.
- Price dispersion among top brands highlights opportunities for strategic positioning and the risks of direct price competition.

Methodology
Data Source and Aggregation The findings in this report are derived from an analysis of publicly available e-commerce data on the Amazon marketplace in the United States, with ZIP code 60007 as the delivery location. The data is collected by product categories using the specified search keyword "doormat". For a dynamic and detailed view of brand performance, please refer to the Brands section of the IndexBox platform.
Rating vs Reviews
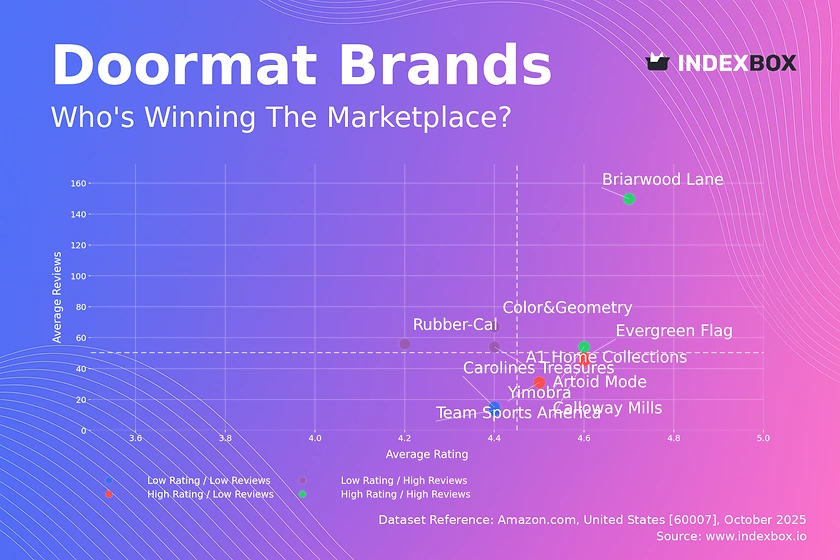
Star Brands Brands like Briarwood Lane and Artoid Mode demonstrate that high customer satisfaction (rating > 4.58) can be successfully scaled to a large audience. Their strategy should focus on maintaining product quality and leveraging their strong reputation for brand extensions and premium offerings.
Rising Brands Brands such as Color&Geometry and A1 Home Collections have high visibility (reviews > 53K) but sub-par ratings (< 4.44), indicating potential quality control or customer expectation mismatches. Immediate action should include a deep dive into negative reviews, product improvements, and proactive customer service outreach to convert reviewers into brand advocates.
Niche Brands Evergreen Flag and Calloway Mills enjoy high customer loyalty (rating > 4.55) but have not yet achieved mass-market review volume. They should invest in targeted marketing to amplify their quality story, using loyalty programs and referral incentives to stimulate organic growth without compromising their premium positioning.
Problematic Brands This quadrant, with low ratings and low reviews, represents brands at risk of being delisted. A fundamental reassessment of product-market fit is required, potentially coupled with aggressive promotions to generate initial sales volume and fresh reviews, provided the core product issues are resolved first.
Price vs Sales Volume
Premium Strategy Analysis Brands like Colonial Mills operate in a high-price, low-volume quadrant, suggesting a successful niche luxury strategy. The primary risk is assortment cannibalization if they introduce lower-priced lines; they should instead focus on margin protection and storytelling to justify the premium.
Mass-Market Dominance OLANLY demonstrates that exceptionally high sales volume can be achieved even at an above-median price, indicating strong brand equity or unique product features. Calloway Mills and Artoid Mode excel in the low-price, high-volume segment, leveraging economies of scale and a broad assortment to capture market share.
Demand Elasticity The concentration of brands in the low-price, high-volume quadrant suggests high price sensitivity in the overall doormat market. For mass-market players, minor price reductions could disproportionately increase volume, while premium brands have inelastic demand within their specific customer segment.
Price Distribution
Key Price Ranges The market is heavily concentrated in the $18 to $38 range, which represents the core "sweet spot" for the majority of consumers. A secondary, smaller peak exists in the premium segment above $100, occupied by specialized or artisan brands.
Assortment Segmentation Brands should align their portfolios with these natural price clusters. Mass-market brands should dominate the $18-$38 range with variety, while premium brands must clearly communicate superior materials, design, or durability to justify prices in the $100+ range.
Anomaly Identification The long tail of prices extending beyond $150 requires scrutiny. While some may be legitimate luxury goods, others could indicate grey market imports or counterfeit risks, necessitating brand protection monitoring.
Market Share
Market Concentration The market is highly concentrated, with the top three brands (OLANLY, Yimobra, Mibao) commanding a dominant share. This indicates significant barriers to entry for new players and the power of established brand recognition and distribution.
Strategic Moves for Leaders Leading brands should focus on portfolio diversification to cover multiple price points and use cases, protecting their flanks from niche attackers. They can also leverage their scale for aggressive marketing spend to further solidify their position.
The "Others" Segment The "Others" category represents a collective volume larger than several top-10 brands, making it a critical segment to analyze. Breaking down this basket would reveal emerging brands and potential acquisition targets or partnership opportunities for larger players.
Boxplot
Price Variability Analysis Colonial Mills exhibits extreme price dispersion, from ~$29 to $248, indicating a wide portfolio from entry-level to ultra-premium products. In contrast, Studio M has no variability, suggesting a single-SKU strategy which carries higher risk.
Assortment Strategy Brands like Calloway Mills and Carolines Treasures show moderate price ranges, allowing them to capture different consumer segments within the mass market. The overlapping interquartile ranges of Team Sports America and Calloway Mills indicate a direct competitive battleground.
Optimization Recommendations Brands with tight clusters should consider expanding their range to address unmet needs. Those with wide ranges should ensure clear tiering to avoid cannibalization, using the outliers (e.g., Colonial Mills' $297 products) as halo products to enhance brand perception.
Custom Search Request
On-Demand Market Intelligence The IndexBox platform allows for on-demand data updates through the "Custom Search Request" panel. A marketing director can automate this process via API to receive real-time alerts on competitor promotions and pricing changes.
Automation and Integration This functionality enables the creation of dynamic dashboards integrated into existing Business Intelligence (BI) tools. This allows for continuous market monitoring rather than relying on periodic, static reports, transforming market intelligence from a reactive to a proactive function.
Conclusion
Synthesis of Insights The doormat market presents a clear dichotomy between volume-driven mass-market players and margin-focused premium niches. Success hinges on a clearly defined brand position supported by an aligned pricing, assortment, and marketing strategy.
Regional Perspective The analysis based on ZIP code 60007 reflects a suburban market with standard logistics, ensuring broad product availability. This provides a reliable baseline for national strategy, though specific urban or rural ZIPs may show variations in premium product demand and delivery costs.
Strategic Imperatives For investors, the high market concentration suggests that acquiring an established brand is more viable than launching a new one. New entrants face significant barriers but can succeed by targeting an underserved niche with a superior product, as demonstrated by brands in the "High Rating / Low Reviews" quadrant. Regular monitoring through the IndexBox platform is essential to track these dynamic market shifts and inform strategic decision-making.
-
1. INTRODUCTION
Making Data-Driven Decisions to Grow Your Business
- REPORT DESCRIPTION
- RESEARCH METHODOLOGY AND THE AI PLATFORM
- DATA-DRIVEN DECISIONS FOR YOUR BUSINESS
- GLOSSARY AND SPECIFIC TERMS
-
2. EXECUTIVE SUMMARY
A Quick Overview of Market Performance
- KEY FINDINGS
- MARKET TRENDS This Chapter is Available Only for the Professional Edition PRO
-
3. MARKET OVERVIEW
Understanding the Current State of The Market and its Prospects
- MARKET SIZE: HISTORICAL DATA (2012–2025) AND FORECAST (2026–2035)
- MARKET STRUCTURE: HISTORICAL DATA (2012–2025) AND FORECAST (2026–2035)
- CONSUMPTION BY TYPE: HISTORICAL DATA (2012–2025) AND FORECAST (2026–2035)
- TRADE BALANCE: HISTORICAL DATA (2012–2025) AND FORECAST (2026–2035)
- PER CAPITA CONSUMPTION: HISTORICAL DATA (2012–2025) AND FORECAST (2026–2035)
- MARKET FORECAST TO 2035
-
4. MOST PROMISING PRODUCTS FOR DIVERSIFICATION
Finding New Products to Diversify Your Business
- TOP PRODUCTS TO DIVERSIFY YOUR BUSINESS
- BEST-SELLING PRODUCTS
- MOST CONSUMED PRODUCTS
- MOST TRADED PRODUCTS
- MOST PROFITABLE PRODUCTS FOR EXPORTS
-
5. MOST PROMISING SUPPLYING COUNTRIES
Choosing the Best Countries to Establish Your Sustainable Supply Chain
- TOP COUNTRIES TO SOURCE YOUR PRODUCT
- TOP PRODUCING COUNTRIES
- TOP EXPORTING COUNTRIES
- LOW-COST EXPORTING COUNTRIES
-
6. MOST PROMISING OVERSEAS MARKETS
Choosing the Best Countries to Boost Your Export
- TOP OVERSEAS MARKETS FOR EXPORTING YOUR PRODUCT
- TOP CONSUMING MARKETS
- UNSATURATED MARKETS
- TOP IMPORTING MARKETS
- MOST PROFITABLE MARKETS
-
7. PRODUCTION
The Latest Trends and Insights into The Industry
- PRODUCTION VOLUME AND VALUE: HISTORICAL DATA (2012–2025) AND FORECAST (2026–2035)
- PRODUCTION BY TYPE: HISTORICAL DATA (2012–2025) AND FORECAST (2026–2035)
-
8. IMPORTS
The Largest Import Supplying Countries
- IMPORTS: HISTORICAL DATA (2012–2025) AND FORECAST (2026–2035)
- IMPORTS BY TYPE: HISTORICAL DATA (2012–2025) AND FORECAST (2026–2035)
- IMPORTS BY COUNTRY: HISTORICAL DATA (2012–2025)
- IMPORT PRICES BY TYPE AND COUNTRY: HISTORICAL DATA (2012–2025)
-
9. EXPORTS
The Largest Destinations for Exports
- EXPORTS: HISTORICAL DATA (2012–2025) AND FORECAST (2026–2035)
- EXPORTS BY TYPE: HISTORICAL DATA (2012–2025) AND FORECAST (2026–2035)
- EXPORTS BY COUNTRY: HISTORICAL DATA (2012–2025)
- EXPORT PRICES BY TYPE AND COUNTRY: HISTORICAL DATA (2012–2025)
-
10. PROFILES OF MAJOR PRODUCERS
The Largest Producers on The Market and Their Profiles
-
LIST OF TABLES
- Key Findings In 2025
- Market Volume, In Physical Terms: Historical Data (2012–2025) and Forecast (2026–2035)
- Market Value: Historical Data (2012–2025) and Forecast (2026–2035)
- Consumption, in Physical and Value Terms, by Type: Historical Data (2012–2025) and Forecast (2026–2035)
- Per Capita Consumption: Historical Data (2012–2025) and Forecast (2026–2035)
- Production, in Physical and Value Terms, by Type: Historical Data (2012–2025) and Forecast (2026–2035)
- Imports, in Physical and Value Terms, by Type: Historical Data (2012–2025) and Forecast (2026–2035)
- Imports, In Physical Terms, By Country, 2012-2025
- Imports, In Value Terms, By Country, 2012-2025
- Import Prices, By Country, 2012-2025
- Import Prices, by Type: Historical Data (2012–2025) and Forecast (2026–2035)
- Exports, in Physical and Value Terms, by Type: Historical Data (2012–2025) and Forecast (2026–2035)
- Exports, In Physical Terms, By Country, 2012-2025
- Exports, In Value Terms, By Country, 2012-2025
- Exports Prices, By Country, 2012-2025
- Exports Prices, by Type: Historical Data (2012–2025) and Forecast (2026–2035)
-
LIST OF FIGURES
- Market Volume, in Physical Terms: Historical Data (2012–2025) and Forecast (2026–2035)
- Market Value: Historical Data (2012–2025) and Forecast (2026–2035)
- Consumption, By Type, 2025
- Consumption, in Physical Terms, by Type: Historical Data (2012–2025) and Forecast (2026–2035)
- Consumption, in Value Terms, by Type: Historical Data (2012–2025) and Forecast (2026–2035)
- Consumption, Per Capita, by Type: Historical Data (2012–2025) and Forecast (2026–2035)
- Market Structure – Domestic Supply Vs. Imports, in Physical Terms: Historical Data (2012–2025) and Forecast (2026–2035)
- Market Structure – Domestic Supply Vs. Imports, in Value Terms: Historical Data (2012–2025) and Forecast (2026–2035)
- Trade Balance, in Physical Terms: Historical Data (2012–2025) and Forecast (2026–2035)
- Trade Balance, in Value Terms: Historical Data (2012–2025) and Forecast (2026–2035)
- Per Capita Consumption: Historical Data (2012–2025) and Forecast (2026–2035)
- Market Volume Forecast to 2035
- Market Value Forecast to 2035
- Market Size and Growth, by Product
- Average Per Capita Consumption, by Product
- Exports and Growth, by Product
- Export Prices and Growth, by Product
- Production Volume and Growth
- Exports and Growth
- Export Prices and Growth
- Market Size and Growth
- Per Capita Consumption
- Imports and Growth
- Import Prices
- Production, in Physical Terms: Historical Data (2012–2025) and Forecast (2026–2035)
- Production, in Value Terms: Historical Data (2012–2025) and Forecast (2026–2035)
- Production, By Type, 2025
- Production, in Physical Terms, by Type: Historical Data (2012–2025) and Forecast (2026–2035)
- Production, in Value Terms, by Type: Historical Data (2012–2025) and Forecast (2026–2035)
- Imports, in Physical Terms: Historical Data (2012–2025) and Forecast (2026–2035)
- Imports, in Value Terms: Historical Data (2012–2025) and Forecast (2026–2035)
- Imports, By Type, 2025
- Imports, in Physical Terms, by Type: Historical Data (2012–2025) and Forecast (2026–2035)
- Imports, in Value Terms, by Type: Historical Data (2012–2025) and Forecast (2026–2035)
- Imports, in Physical Terms, by Country, 2025
- Imports, in Physical Terms, by Country, 2012-2025
- Imports, in Value Terms, by Country, 2012-2025
- Import Prices, by Country, 2012-2025
- Import Prices, by Type: Historical Data (2012–2025) and Forecast (2026–2035)
- Exports, in Physical Terms: Historical Data (2012–2025) and Forecast (2026–2035)
- Exports, in Value Terms: Historical Data (2012–2025) and Forecast (2026–2035)
- Exports, By Type, 2025
- Exports, in Physical Terms, by Type: Historical Data (2012–2025) and Forecast (2026–2035)
- Exports, in Value Terms, by Type: Historical Data (2012–2025) and Forecast (2026–2035)
- Exports, in Physical Terms, by Country, 2025
- Exports, in Physical Terms, by Country, 2012-2025
- Exports, in Value Terms, by Country, 2012-2025
- Export Prices, by Country, 2012-2025
- Export Prices, by Type: Historical Data (2012–2025) and Forecast (2026–2035)
Recommended posts
Free Data: Carpets And Other Textile Floor Coverings - United States
Instant access. No credit card needed.


