Canada - Stranded Wire, Ropes And Cables - Market Analysis, Forecast, Size, Trends and Insights
Get instant access to more than 2 million reports, dashboards, and datasets on the IndexBox Platform.
View PricingCanada's June 2023 Imports of Stranded Wire Reach An Average of $45M
Canada Stranded Wire Imports
In June 2023, supplies from abroad of stranded wire, ropes and cables decreased by -9.7% to 9.8K tons, falling for the second month in a row after two months of growth. Overall, imports continue to indicate a mild decrease. The pace of growth appeared the most rapid in September 2022 when imports increased by 22% month-to-month. As a result, imports attained the peak of 13K tons. From October 2022 to June 2023, the growth of imports remained at a somewhat lower figure.
In value terms, stranded wire imports dropped to $45M (IndexBox estimates) in June 2023. Over the period under review, imports continue to indicate a mild reduction. The growth pace was the most rapid in March 2023 with an increase of 20% month-to-month. 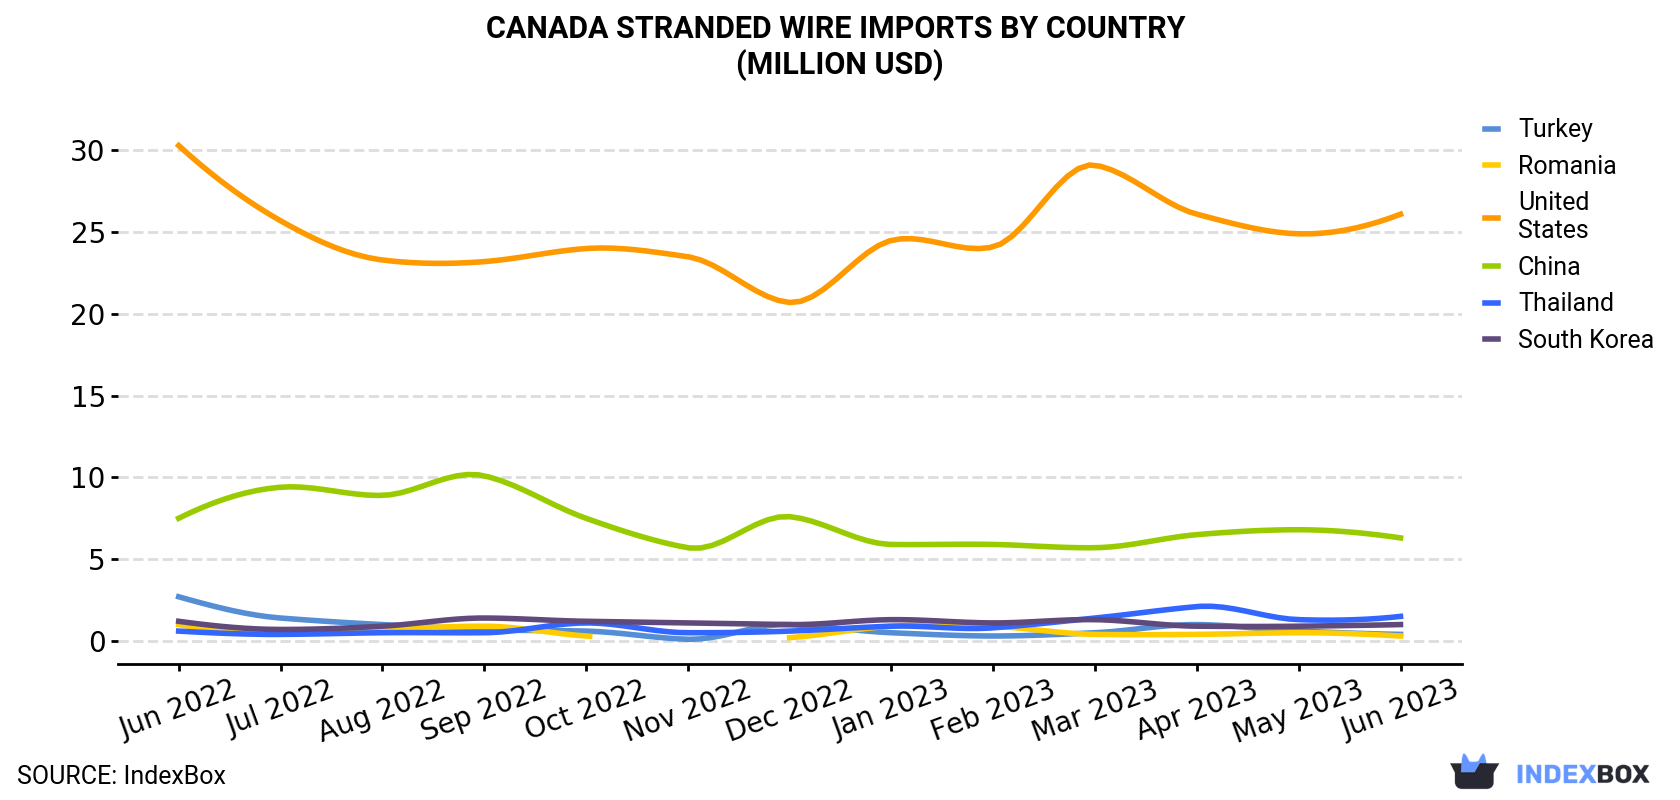
| COUNTRY | Import Value of Stranded Wire in Canada (million USD) | ||||||||||||
|---|---|---|---|---|---|---|---|---|---|---|---|---|---|
| Jun 2022 | Jul 2022 | Aug 2022 | Sep 2022 | Oct 2022 | Nov 2022 | Dec 2022 | Jan 2023 | Feb 2023 | Mar 2023 | Apr 2023 | May 2023 | Jun 2023 | |
| United States | 30.3 | 25.7 | 23.3 | 23.2 | 24.0 | 23.5 | 20.7 | 24.5 | 24.1 | 29.1 | 26.1 | 24.9 | 26.1 |
| China | 7.5 | 9.4 | 8.9 | 10.1 | 7.5 | 5.7 | 7.6 | 5.9 | 5.9 | 5.7 | 6.5 | 6.8 | 6.3 |
| Thailand | 0.6 | 0.4 | 0.5 | 0.5 | 1.1 | 0.5 | 0.6 | 0.9 | 0.8 | 1.4 | 2.1 | 1.3 | 1.5 |
| South Korea | 1.2 | 0.7 | 0.9 | 1.4 | 1.2 | 1.1 | 1.0 | 1.3 | 1.1 | 1.3 | 0.9 | 0.9 | 1.0 |
| Turkey | 2.7 | 1.4 | 1.0 | 0.7 | 0.6 | 0.1 | 1.0 | 0.5 | 0.3 | 0.5 | 1.0 | 0.6 | 0.4 |
| Romania | 1.0 | 0.4 | 0.7 | 0.9 | 0.3 | < 0.1 | 0.2 | 0.9 | 0.9 | 0.4 | 0.4 | 0.5 | 0.3 |
| Others | 7.3 | 7.8 | 10.3 | 11.7 | 8.4 | 5.2 | 5.0 | 5.5 | 4.8 | 7.1 | 8.3 | 10.2 | 9.5 |
| Total | 50.6 | 45.8 | 45.5 | 48.5 | 43.1 | 36.2 | 36.1 | 39.5 | 37.8 | 45.4 | 45.2 | 45.2 | 45.1 |
Imports by Country
The United States (3.9K tons), China (3K tons) and Thailand (560 tons) were the main suppliers of stranded wire imports to Canada, with a combined 76% share of total imports.
From June 2022 to June 2023, the biggest increases were in Thailand (with a CAGR of +8.5%), while purchases for the other leaders experienced a decline.
In value terms, the United States ($26M) constituted the largest supplier of stranded wire to Canada, comprising 58% of total imports. The second position in the ranking was taken by China ($6.3M), with a 14% share of total imports. It was followed by Thailand, with a 3.3% share.
From June 2022 to June 2023, the average monthly growth rate of value from the United States totaled -1.2%. The remaining supplying countries recorded the following average monthly rates of imports growth: China (-1.4% per month) and Thailand (+7.6% per month).
Imports by Type
In June 2023, stranded wire, ropes, cables, plaited bands, slings and the like, of iron or steel, not electrically insulated (7.7K tons) constituted the largest type of stranded wire supplied to Canada, with a 78% share of total imports. Moreover, stranded wire, ropes, cables, plaited bands, slings and the like, of iron or steel, not electrically insulated exceeded the figures recorded for the second-largest type, copper stranded wire, cables and plaited bands (1.2K tons), sixfold.
From June 2022 to June 2023, the average monthly growth rate of the volume of import of stranded wire, ropes, cables, plaited bands, slings and the like, of iron or steel, not electrically insulated was relatively modest. With regard to the other supplied products, the following average monthly rates of growth were recorded: copper stranded wire, cables and plaited bands (-2.5% per month) and aluminium; stranded wire, cables, plaited bands and the like, (not electrically insulated) (-4.9% per month).
In value terms, the most traded types of stranded wire, ropes and cables in Canada were stranded wire, ropes, cables, plaited bands, slings and the like, of iron or steel, not electrically insulated ($27M), copper stranded wire, cables and plaited bands ($14M) and aluminium; stranded wire, cables, plaited bands and the like, (not electrically insulated) ($3.7M).
Import Prices by Country
In June 2023, the stranded wire price amounted to $4,578 per ton (CIF, Canada), surging by 11% against the previous month. Over the period under review, the import price showed a relatively flat trend pattern. The most prominent rate of growth was recorded in January 2023 an increase of 16% month-to-month. Over the period under review, average import prices attained the maximum in June 2023.
There were significant differences in the average prices amongst the major supplying countries. In June 2023, the country with the highest price was Germany ($6,821 per ton), while the price for Portugal ($1,695 per ton) was amongst the lowest.
From June 2022 to June 2023, the most notable rate of growth in terms of prices was attained by the United States (+1.3%), while the prices for the other major suppliers experienced more modest paces of growth.
This report provides an in-depth analysis of the stranded wire market in Canada. Within it, you will discover the latest data on market trends and opportunities by country, consumption, production and price developments, as well as the global trade (imports and exports). The forecast exhibits the market prospects through 2030.
Product coverage:
- Prodcom 25931130 - Iron or steel stranded wire, ropes and cables (including stranded wires and wire ropes with or without attached fittings not electrically insulated) (excluding electrically insulated)
- Prodcom 25931150 - Iron or steel plaited bands, slings and the like (excluding electrically insulated)
- Prodcom 25931250 - Copper stranded wire, cables, plaited bands and the like excluding electrically insulated, barbed wire and loosely twisted non-barbed double fencing wire, insulated electric wire and cables
- Prodcom 25931270 - Aluminium stranded wire, cables, plaited bands and the like excluding electrically insulated, barbed wire and loosely twisted non-barbed double fencing wire, insulated electric wire and cables
Country coverage:
- Canada
Data coverage:
- Market volume and value
- Per Capita consumption
- Forecast of the market dynamics in the medium term
- Trade (exports and imports) in Canada
- Export and import prices
- Market trends, drivers and restraints
- Key market players and their profiles
Reasons to buy this report:
- Take advantage of the latest data
- Find deeper insights into current market developments
- Discover vital success factors affecting the market
This report is designed for manufacturers, distributors, importers, and wholesalers, as well as for investors, consultants and advisors.
In this report, you can find information that helps you to make informed decisions on the following issues:
- How to diversify your business and benefit from new market opportunities
- How to load your idle production capacity
- How to boost your sales on overseas markets
- How to increase your profit margins
- How to make your supply chain more sustainable
- How to reduce your production and supply chain costs
- How to outsource production to other countries
- How to prepare your business for global expansion
While doing this research, we combine the accumulated expertise of our analysts and the capabilities of artificial intelligence. The AI-based platform, developed by our data scientists, constitutes the key working tool for business analysts, empowering them to discover deep insights and ideas from the marketing data.
-
1. INTRODUCTION
Making Data-Driven Decisions to Grow Your Business
- REPORT DESCRIPTION
- RESEARCH METHODOLOGY AND AI PLATFORM
- DATA-DRIVEN DECISIONS FOR YOUR BUSINESS
- GLOSSARY AND SPECIFIC TERMS
-
2. EXECUTIVE SUMMARY
A Quick Overview of Market Performance
- KEY FINDINGS
- MARKET TRENDS This Chapter is Available Only for the Professional Edition PRO
-
3. MARKET OVERVIEW
Understanding the Current State of The Market and Its Prospects
- MARKET SIZE
- MARKET STRUCTURE
- TRADE BALANCE
- PER CAPITA CONSUMPTION
- MARKET FORECAST TO 2030
-
4. MOST PROMISING PRODUCT
Finding New Products to Diversify Your Business
This Chapter is Available Only for the Professional Edition PRO- TOP PRODUCTS TO DIVERSIFY YOUR BUSINESS
- BEST-SELLING PRODUCTS
- MOST CONSUMED PRODUCT
- MOST TRADED PRODUCT
- MOST PROFITABLE PRODUCT FOR EXPORT
-
5. MOST PROMISING SUPPLYING COUNTRIES
Choosing the Best Countries to Establish Your Sustainable Supply Chain
This Chapter is Available Only for the Professional Edition PRO- TOP COUNTRIES TO SOURCE YOUR PRODUCT
- TOP PRODUCING COUNTRIES
- TOP EXPORTING COUNTRIES
- LOW-COST EXPORTING COUNTRIES
-
6. MOST PROMISING OVERSEAS MARKETS
Choosing the Best Countries to Boost Your Exports
This Chapter is Available Only for the Professional Edition PRO- TOP OVERSEAS MARKETS FOR EXPORTING YOUR PRODUCT
- TOP CONSUMING MARKETS
- UNSATURATED MARKETS
- TOP IMPORTING MARKETS
- MOST PROFITABLE MARKETS
7. PRODUCTION
The Latest Trends and Insights into The Industry
- PRODUCTION VOLUME AND VALUE
8. IMPORTS
The Largest Import Supplying Countries
- IMPORTS FROM 2012–2023
- IMPORTS BY COUNTRY
- IMPORT PRICES BY COUNTRY
9. EXPORTS
The Largest Destinations for Exports
- EXPORTS FROM 2012–2023
- EXPORTS BY COUNTRY
- EXPORT PRICES BY COUNTRY
-
10. PROFILES OF MAJOR PRODUCERS
The Largest Producers on The Market and Their Profiles
This Chapter is Available Only for the Professional Edition PRO -
LIST OF TABLES
- Key Findings In 2023
- Market Volume, In Physical Terms, 2012–2023
- Market Value, 2012–2023
- Per Capita Consumption In 2012-2023
- Imports, In Physical Terms, By Country, 2012–2023
- Imports, In Value Terms, By Country, 2012–2023
- Import Prices, By Country Of Origin, 2012–2023
- Exports, In Physical Terms, By Country, 2012–2023
- Exports, In Value Terms, By Country, 2012–2023
- Export Prices, By Country Of Destination, 2012–2023
-
LIST OF FIGURES
- Market Volume, In Physical Terms, 2012–2023
- Market Value, 2012–2023
- Market Structure – Domestic Supply vs. Imports, In Physical Terms, 2012-2023
- Market Structure – Domestic Supply vs. Imports, In Value Terms, 2012-2023
- Trade Balance, In Physical Terms, 2012-2023
- Trade Balance, In Value Terms, 2012-2023
- Per Capita Consumption, 2012-2023
- Market Volume Forecast to 2030
- Market Value Forecast to 2030
- Products: Market Size And Growth, By Type
- Products: Average Per Capita Consumption, By Type
- Products: Exports And Growth, By Type
- Products: Export Prices And Growth, By Type
- Production Volume And Growth
- Exports And Growth
- Export Prices And Growth
- Market Size And Growth
- Per Capita Consumption
- Imports And Growth
- Import Prices
- Production, In Physical Terms, 2012–2023
- Production, In Value Terms, 2012–2023
- Imports, In Physical Terms, 2012–2023
- Imports, In Value Terms, 2012–2023
- Imports, In Physical Terms, By Country, 2023
- Imports, In Physical Terms, By Country, 2012–2023
- Imports, In Value Terms, By Country, 2012–2023
- Import Prices, By Country Of Origin, 2012–2023
- Exports, In Physical Terms, 2012–2023
- Exports, In Value Terms, 2012–2023
- Exports, In Physical Terms, By Country, 2023
- Exports, In Physical Terms, By Country, 2012–2023
- Exports, In Value Terms, By Country, 2012–2023
- Export Prices, By Country Of Destination, 2012–2023


