GCC - Bromides And Bromide Oxides, Iodides And Iodide Oxides - Market Analysis, Forecast, Size, Trends And Insights
Get instant access to more than 2 million reports, dashboards, and datasets on the IndexBox Platform.
View PricingGCC's Bromides and Bromide Oxides, Iodides and Iodide Oxides Market to Grow at +1.0% CAGR through 2035
IndexBox has just published a new report: GCC - Bromides And Bromide Oxides, Iodides And Iodide Oxides - Market Analysis, Forecast, Size, Trends And Insights.
The market for bromides and bromide oxides, iodides and iodide oxides in the GCC is expected to grow steadily, with a forecasted increase in market volume and value by the end of 2035. Market performance is anticipated to decelerate, with a projected CAGR of +1.0% for volume and +3.8% for value from 2024 to 2035.
Market Forecast
Driven by increasing demand for bromides and bromide oxides, iodides and iodide oxides in GCC, the market is expected to continue an upward consumption trend over the next decade. Market performance is forecast to decelerate, expanding with an anticipated CAGR of +1.0% for the period from 2024 to 2035, which is projected to bring the market volume to 88K tons by the end of 2035.
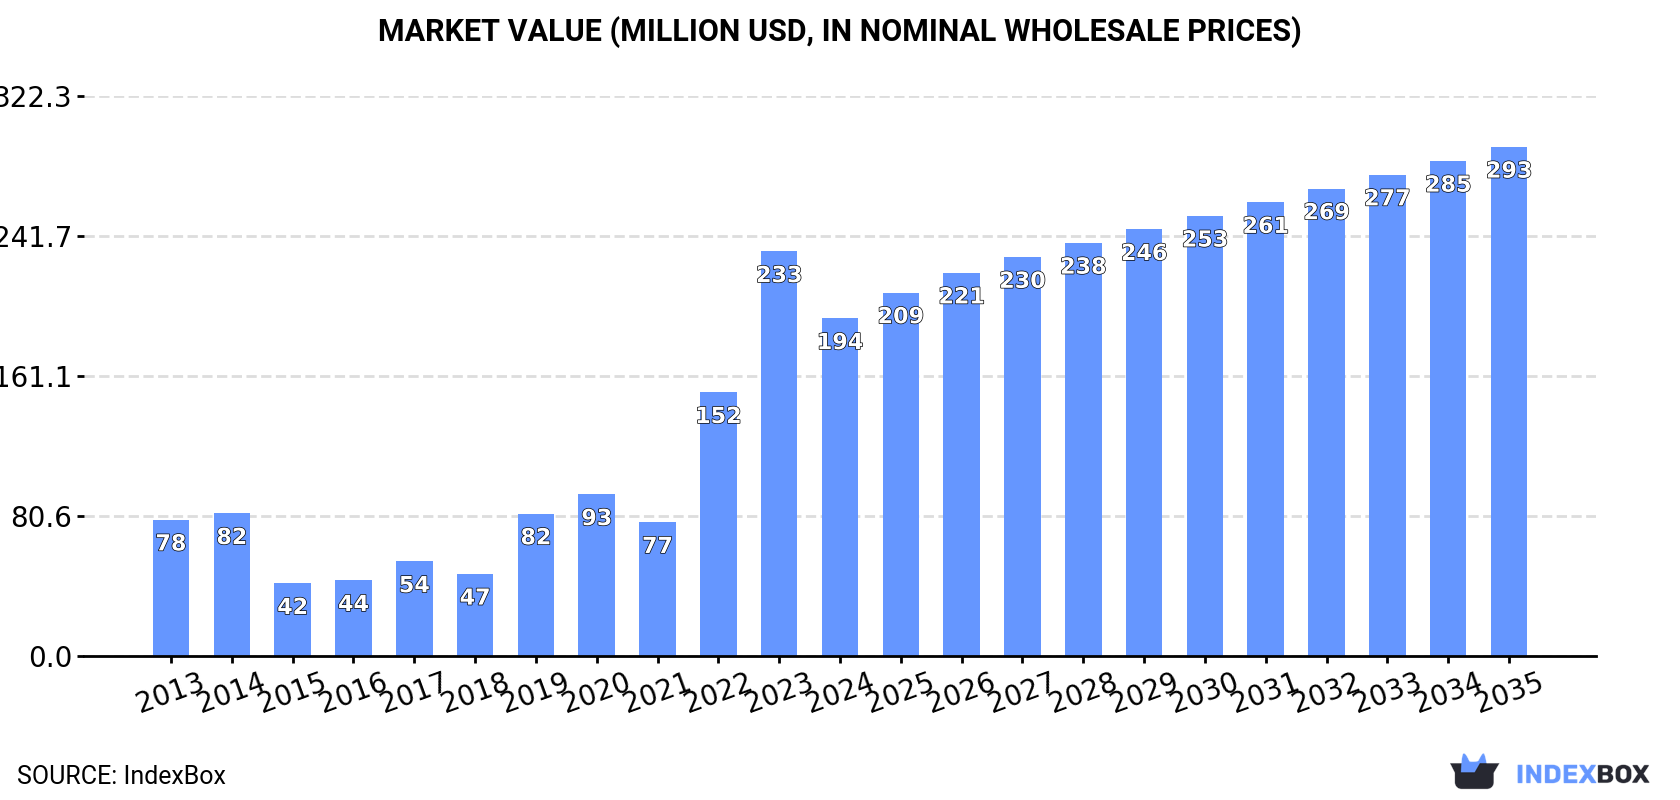
In value terms, the market is forecast to increase with an anticipated CAGR of +3.8% for the period from 2024 to 2035, which is projected to bring the market value to $293M (in nominal wholesale prices) by the end of 2035.
Consumption
GCC's Consumption of Bromides And Bromide Oxides, Iodides And Iodide Oxides
In 2024, after two years of growth, there was significant decline in consumption of bromides and bromide oxides, iodides and iodide oxides, when its volume decreased by -9.4% to 78K tons. In general, consumption, however, posted a buoyant expansion. The volume of consumption peaked at 86K tons in 2023, and then dropped in the following year.
The revenue of the market for bromides and bromide oxides, iodides and iodide oxides in GCC reduced rapidly to $194M in 2024, shrinking by -16.6% against the previous year. This figure reflects the total revenues of producers and importers (excluding logistics costs, retail marketing costs, and retailers' margins, which will be included in the final consumer price). Over the period under review, consumption, however, saw buoyant growth. The level of consumption peaked at $233M in 2023, and then shrank rapidly in the following year.
Consumption By Country
The countries with the highest volumes of consumption in 2024 were Saudi Arabia (49K tons), the United Arab Emirates (26K tons) and Qatar (1.3K tons), with a combined 98% share of total consumption.
From 2013 to 2024, the biggest increases were recorded for Qatar (with a CAGR of +15.6%), while consumption for the other leaders experienced more modest paces of growth.
In value terms, Saudi Arabia ($105M) led the market, alone. The second position in the ranking was held by the United Arab Emirates ($50M).
In Saudi Arabia, the bromides, iodides and oxids thereof market expanded at an average annual rate of +5.4% over the period from 2013-2024. The remaining consuming countries recorded the following average annual rates of market growth: the United Arab Emirates (+10.9% per year) and Qatar (+43.0% per year).
The countries with the highest levels of bromides, iodides and oxids thereof per capita consumption in 2024 were the United Arab Emirates (2.6 kg per person), Saudi Arabia (1.3 kg per person) and Qatar (0.4 kg per person).
From 2013 to 2024, the biggest increases were recorded for Qatar (with a CAGR of +12.8%), while consumption for the other leaders experienced more modest paces of growth.
Production
GCC's Production of Bromides And Bromide Oxides, Iodides And Iodide Oxides
In 2024, production of bromides and bromide oxides, iodides and iodide oxides decreased by -15.2% to 1.6K tons for the first time since 2021, thus ending a two-year rising trend. Over the period under review, production, however, posted a strong expansion. The pace of growth appeared the most rapid in 2019 with an increase of 113%. The volume of production peaked at 1.8K tons in 2023, and then contracted rapidly in the following year.
In value terms, bromides, iodides and oxids thereof production fell dramatically to $3.6M in 2024 estimated in export price. Overall, production, however, showed a buoyant expansion. The growth pace was the most rapid in 2019 when the production volume increased by 140%. The level of production peaked at $4.4M in 2023, and then shrank sharply in the following year.
Production By Country
The countries with the highest volumes of production in 2024 were Oman (1K tons) and Kuwait (548 tons).
From 2013 to 2024, the most notable rate of growth in terms of production, amongst the main producing countries, was attained by Oman (with a CAGR of +49.0%).
Imports
GCC's Imports of Bromides And Bromide Oxides, Iodides And Iodide Oxides
After two years of growth, purchases abroad of bromides and bromide oxides, iodides and iodide oxides decreased by -10.2% to 78K tons in 2024. In general, imports, however, continue to indicate a remarkable increase. The most prominent rate of growth was recorded in 2022 when imports increased by 78% against the previous year. Over the period under review, imports hit record highs at 87K tons in 2023, and then shrank in the following year.
In value terms, bromides, iodides and oxids thereof imports dropped dramatically to $203M in 2024. Overall, imports, however, recorded strong growth. The pace of growth was the most pronounced in 2022 when imports increased by 109%. Over the period under review, imports attained the maximum at $270M in 2023, and then reduced notably in the following year.
Imports By Country
In 2024, Saudi Arabia (49K tons) was the major importer of bromides and bromide oxides, iodides and iodide oxides, achieving 63% of total imports. It was distantly followed by the United Arab Emirates (27K tons), creating a 35% share of total imports. Qatar (1.3K tons) took a minor share of total imports.
From 2013 to 2024, the most notable rate of growth in terms of purchases, amongst the key importing countries, was attained by Qatar (with a CAGR of +15.6%), while imports for the other leaders experienced more modest paces of growth.
In value terms, Saudi Arabia ($109M), the United Arab Emirates ($56M) and Qatar ($37M) were the countries with the highest levels of imports in 2024, together comprising 99% of total imports.
Qatar, with a CAGR of +43.0%, recorded the highest rates of growth with regard to the value of imports, in terms of the main importing countries over the period under review, while purchases for the other leaders experienced more modest paces of growth.
Import Prices By Country
In 2024, the import price in GCC amounted to $2,586 per ton, with a decrease of -16.2% against the previous year. Import price indicated a moderate increase from 2013 to 2024: its price increased at an average annual rate of +3.2% over the last eleven years. The trend pattern, however, indicated some noticeable fluctuations being recorded throughout the analyzed period. Based on 2024 figures, bromides, iodides and oxids thereof import price increased by +33.4% against 2021 indices. The growth pace was the most rapid in 2023 when the import price increased by 36%. As a result, import price attained the peak level of $3,085 per ton, and then reduced notably in the following year.
There were significant differences in the average prices amongst the major importing countries. In 2024, amid the top importers, the country with the highest price was Qatar ($28,826 per ton), while the United Arab Emirates ($2,047 per ton) was amongst the lowest.
From 2013 to 2024, the most notable rate of growth in terms of prices was attained by Qatar (+23.6%), while the other leaders experienced more modest paces of growth.
Exports
GCC's Exports of Bromides And Bromide Oxides, Iodides And Iodide Oxides
In 2024, overseas shipments of bromides and bromide oxides, iodides and iodide oxides decreased by -39.7% to 1.7K tons for the first time since 2021, thus ending a two-year rising trend. In general, exports, however, enjoyed strong growth. The pace of growth was the most pronounced in 2020 when exports increased by 221%. The volume of export peaked at 2.9K tons in 2023, and then fell remarkably in the following year.
In value terms, bromides, iodides and oxids thereof exports declined rapidly to $3.3M in 2024. Over the period under review, exports, however, showed a resilient increase. The pace of growth appeared the most rapid in 2023 when exports increased by 163% against the previous year. As a result, the exports attained the peak of $6.5M, and then fell sharply in the following year.
Exports By Country
The United Arab Emirates represented the key exporting country with an export of about 1.2K tons, which resulted at 69% of total exports. It was distantly followed by Oman (368 tons) and Saudi Arabia (174 tons), together making up a 31% share of total exports.
From 2013 to 2024, average annual rates of growth with regard to bromides, iodides and oxids thereof exports from the United Arab Emirates stood at +4.7%. At the same time, Oman (+70.3%) displayed positive paces of growth. Moreover, Oman emerged as the fastest-growing exporter exported in GCC, with a CAGR of +70.3% from 2013-2024. By contrast, Saudi Arabia (-19.0%) illustrated a downward trend over the same period. Oman (+21 p.p.) and Saudi Arabia (+10 p.p.) significantly strengthened its position in terms of the total exports, while the United Arab Emirates saw its share reduced by -31% from 2013 to 2024, respectively.
In value terms, the United Arab Emirates ($2.2M) emerged as the largest bromides, iodides and oxids thereof supplier in GCC, comprising 66% of total exports. The second position in the ranking was taken by Oman ($683K), with a 21% share of total exports.
In the United Arab Emirates, bromides, iodides and oxids thereof exports expanded at an average annual rate of +2.3% over the period from 2013-2024. In the other countries, the average annual rates were as follows: Oman (+36.9% per year) and Saudi Arabia (-17.7% per year).
Export Prices By Country
The export price in GCC stood at $1,905 per ton in 2024, falling by -15.9% against the previous year. In general, the export price showed a pronounced reduction. The most prominent rate of growth was recorded in 2018 when the export price increased by 45%. As a result, the export price attained the peak level of $2,868 per ton. From 2019 to 2024, the export prices failed to regain momentum.
Average prices varied somewhat amongst the major exporting countries. In 2024, amid the top suppliers, the country with the highest price was Saudi Arabia ($2,501 per ton), while the United Arab Emirates ($1,828 per ton) was amongst the lowest.
From 2013 to 2024, the most notable rate of growth in terms of prices was attained by Saudi Arabia (+1.6%), while the other leaders experienced a decline in the export price figures.
This report provides a comprehensive view of the bromides, iodides and oxids thereof industry in GCC, tracking demand, supply, and trade flows across the regional value chain. It explains how demand across key channels and end-use segments shapes consumption patterns, while also mapping the role of input availability, production efficiency, and regulatory standards on supply.
Beyond headline metrics, the study benchmarks prices, margins, and trade routes so you can see where value is created and how it moves between exporters and importers within GCC. The analysis is designed to support strategic planning, market entry, portfolio prioritization, and risk management in the bromides, iodides and oxids thereof landscape in GCC.
Quick navigation
- Key findings
- Report scope
- Product coverage
- Country coverage
- Methodology
- Forecasts to 2035
- Price analysis
- Market participants
- Country profiles
- How to use this report
- FAQ
Key findings
- Regional demand is shaped by both household and industrial usage, with trade flows linking supply hubs to import-reliant countries.
- Pricing dynamics reflect unit values, freight costs, exchange rates, and regulatory shifts that affect sourcing decisions.
- Supply depends on input availability and production efficiency, creating distinct cost curves across GCC.
- Market concentration varies by country, creating different competitive landscapes and entry barriers.
- The 2035 outlook highlights where capacity investment and demand growth are most aligned within the region.
Report scope
The report combines market sizing with trade intelligence and price analytics for GCC. It covers both historical performance and the forward outlook to 2035, allowing you to compare cycles, structural shifts, and policy impacts across countries and sub-regions.
- Market size and growth in value and volume terms
- Consumption structure by end-use segments and countries
- Production capacity, output, and cost dynamics
- Regional trade flows, exporters, importers, and balances
- Price benchmarks, unit values, and margin signals
- Competitive context and market entry conditions
Product coverage
- Prodcom 20133170 - Bromides and bromide oxides, iodides and iodide oxides
Country coverage
Country profiles and benchmarks
For the regional report, country profiles provide a consistent view of market size, trade balance, prices, and per-capita indicators across GCC. The profiles highlight the largest consuming and producing markets and allow direct benchmarking across peers.
Methodology
The analysis is built on a multi-source framework that combines official statistics, trade records, company disclosures, and expert validation. Data are standardized, reconciled, and cross-checked to ensure consistency across time series.
- International trade data (exports, imports, and mirror statistics)
- National production and consumption statistics
- Company-level information from financial filings and public releases
- Price series and unit value benchmarks
- Analyst review, outlier checks, and time-series validation
All data are normalized to a common product definition and mapped to a consistent set of codes. This ensures that comparisons across time are aligned and actionable.
Forecasts to 2035
The forecast horizon extends to 2035 and is based on a structured model that links bromides, iodides and oxids thereof demand and supply to macroeconomic indicators, trade patterns, and sector-specific drivers. The model captures both cyclical and structural factors and reflects known policy and technology shifts within GCC.
- Historical baseline: 2012-2025
- Forecast horizon: 2026-2035
- Scenario-based sensitivity to income growth, substitution, and regulation
- Capacity and investment outlook for major producing countries
Each country projection is built from its own historical pattern and the regional context, allowing the report to show where growth is concentrated and where risks are elevated.
Price analysis and trade dynamics
Prices are analyzed in detail, including export and import unit values, regional spreads, and changes in trade costs. The report highlights how seasonality, freight rates, exchange rates, and supply disruptions influence pricing and margins.
- Price benchmarks by country and sub-region
- Export and import unit value trends
- Seasonality and calendar effects in trade flows
- Price outlook to 2035 under baseline assumptions
Profiles of market participants
Key producers, exporters, and distributors are profiled with a focus on their operational scale, geographic footprint, product mix, and market positioning. This helps identify competitive pressure points, partnership opportunities, and routes to differentiation.
- Business focus and production capabilities
- Geographic reach and distribution networks
- Cost structure and pricing strategy indicators
- Compliance, certification, and sustainability context
How to use this report
- Quantify regional demand and identify the most attractive country markets
- Evaluate export opportunities and prioritize target destinations
- Track price dynamics and protect margins
- Benchmark performance against regional competitors
- Build evidence-based forecasts for investment decisions
This report is designed for manufacturers, distributors, importers, wholesalers, investors, and advisors who need a clear, data-driven picture of bromides, iodides and oxids thereof dynamics in GCC.
FAQ
What is included in the bromides, iodides and oxids thereof market in GCC?
The market size aggregates consumption and trade data at country and sub-regional levels, presented in both value and volume terms.
How are the forecasts to 2035 built?
The projections combine historical trends with macroeconomic indicators, trade dynamics, and sector-specific drivers.
Does the report cover prices and margins?
Yes, it includes export and import unit values, regional spreads, and a pricing outlook to 2035.
Which countries are profiled in detail?
The report provides profiles for the largest consuming and producing countries in GCC.
Can this report support market entry decisions?
Yes, it highlights demand hotspots, trade routes, pricing trends, and competitive context.
1. INTRODUCTION
Making Data-Driven Decisions to Grow Your Business
- REPORT DESCRIPTION
- RESEARCH METHODOLOGY AND THE AI PLATFORM
- DATA-DRIVEN DECISIONS FOR YOUR BUSINESS
- GLOSSARY AND SPECIFIC TERMS
2. EXECUTIVE SUMMARY
A Quick Overview of Market Performance
- KEY FINDINGS
- MARKET TRENDS This Chapter is Available Only for the Professional EditionPRO
3. MARKET OVERVIEW
Understanding the Current State of The Market and its Prospects
- MARKET SIZE: HISTORICAL DATA (2012–2025) AND FORECAST (2026–2035)
- CONSUMPTION BY COUNTRY: HISTORICAL DATA (2012–2025) AND FORECAST (2026–2035)
- MARKET FORECAST TO 2035
4. MOST PROMISING PRODUCTS FOR DIVERSIFICATION
Finding New Products to Diversify Your Business
- TOP PRODUCTS TO DIVERSIFY YOUR BUSINESS
- BEST-SELLING PRODUCTS
- MOST CONSUMED PRODUCTS
- MOST TRADED PRODUCTS
- MOST PROFITABLE PRODUCTS FOR EXPORT
5. MOST PROMISING SUPPLYING COUNTRIES
Choosing the Best Countries to Establish Your Sustainable Supply Chain
- TOP COUNTRIES TO SOURCE YOUR PRODUCT
- TOP PRODUCING COUNTRIES
- TOP EXPORTING COUNTRIES
- LOW-COST EXPORTING COUNTRIES
6. MOST PROMISING OVERSEAS MARKETS
Choosing the Best Countries to Boost Your Export
- TOP OVERSEAS MARKETS FOR EXPORTING YOUR PRODUCT
- TOP CONSUMING MARKETS
- UNSATURATED MARKETS
- TOP IMPORTING MARKETS
- MOST PROFITABLE MARKETS
7. PRODUCTION
The Latest Trends and Insights into The Industry
- PRODUCTION VOLUME AND VALUE: HISTORICAL DATA (2012–2025) AND FORECAST (2026–2035)
- PRODUCTION BY COUNTRY: HISTORICAL DATA (2012–2025) AND FORECAST (2026–2035)
8. IMPORTS
The Largest Import Supplying Countries
- IMPORTS: HISTORICAL DATA (2012–2025) AND FORECAST (2026–2035)
- IMPORTS BY COUNTRY: HISTORICAL DATA (2012–2025) AND FORECAST (2026–2035)
- IMPORT PRICES BY COUNTRY: HISTORICAL DATA (2012–2025) AND FORECAST (2026–2035)
9. EXPORTS
The Largest Destinations for Exports
- EXPORTS: HISTORICAL DATA (2012–2025) AND FORECAST (2026–2035)
- EXPORTS BY COUNTRY: HISTORICAL DATA (2012–2025) AND FORECAST (2026–2035)
- EXPORT PRICES BY COUNTRY: HISTORICAL DATA (2012–2025) AND FORECAST (2026–2035)
10. PROFILES OF MAJOR PRODUCERS
The Largest Producers on The Market and Their Profiles
-
11. COUNTRY PROFILES
The Largest Markets And Their Profiles
This Chapter is Available Only for the Professional Edition PRO- 11.1Bahrain
- Market Size
- Production
- Imports
- Exports
- 11.2Kuwait
- Market Size
- Production
- Imports
- Exports
- 11.3Oman
- Market Size
- Production
- Imports
- Exports
- 11.4Qatar
- Market Size
- Production
- Imports
- Exports
- 11.5Saudi Arabia
- Market Size
- Production
- Imports
- Exports
- 11.6United Arab Emirates
- Market Size
- Production
- Imports
- Exports
LIST OF TABLES
- Key Findings In 2025
- Market Volume, In Physical Terms: Historical Data (2012–2025) and Forecast (2026–2035)
- Market Value: Historical Data (2012–2025) and Forecast (2026–2035)
- Per Capita Consumption, by Country, 2022–2025
- Production, In Physical Terms, By Country: Historical Data (2012–2025) and Forecast (2026–2035)
- Imports, In Physical Terms, By Country: Historical Data (2012–2025) and Forecast (2026–2035)
- Imports, In Value Terms, By Country: Historical Data (2012–2025) and Forecast (2026–2035)
- Import Prices, By Country: Historical Data (2012–2025) and Forecast (2026–2035)
- Exports, In Physical Terms, By Country: Historical Data (2012–2025) and Forecast (2026–2035)
- Exports, In Value Terms, By Country: Historical Data (2012–2025) and Forecast (2026–2035)
- Export Prices, By Country: Historical Data (2012–2025) and Forecast (2026–2035)
LIST OF FIGURES
- Market Volume, In Physical Terms: Historical Data (2012–2025) and Forecast (2026–2035)
- Market Value: Historical Data (2012–2025) and Forecast (2026–2035)
- Consumption, by Country, 2025
- Market Volume Forecast to 2035
- Market Value Forecast to 2035
- Market Size and Growth, By Product
- Average Per Capita Consumption, By Product
- Exports and Growth, By Product
- Export Prices and Growth, By Product
- Production Volume and Growth
- Exports and Growth
- Export Prices and Growth
- Market Size and Growth
- Per Capita Consumption
- Imports and Growth
- Import Prices
- Production, In Physical Terms: Historical Data (2012–2025) and Forecast (2026–2035)
- Production, In Value Terms: Historical Data (2012–2025) and Forecast (2026–2035)
- Production, by Country, 2025
- Production, In Physical Terms, by Country: Historical Data (2012–2025) and Forecast (2026–2035)
- Imports, In Physical Terms: Historical Data (2012–2025) and Forecast (2026–2035)
- Imports, In Value Terms: Historical Data (2012–2025) and Forecast (2026–2035)
- Imports, In Physical Terms, By Country, 2025
- Imports, In Physical Terms, By Country: Historical Data (2012–2025) and Forecast (2026–2035)
- Imports, In Value Terms, By Country: Historical Data (2012–2025) and Forecast (2026–2035)
- Import Prices, By Country: Historical Data (2012–2025) and Forecast (2026–2035)
- Exports, In Physical Terms: Historical Data (2012–2025) and Forecast (2026–2035)
- Exports, In Value Terms: Historical Data (2012–2025) and Forecast (2026–2035)
- Exports, In Physical Terms, By Country, 2025
- Exports, In Physical Terms, By Country: Historical Data (2012–2025) and Forecast (2026–2035)
- Exports, In Value Terms, By Country: Historical Data (2012–2025) and Forecast (2026–2035)
- Export Prices, By Country: Historical Data (2012–2025) and Forecast (2026–2035)
Recommended posts
Free Data: Bromides And Bromide Oxides, Iodides And Iodide Oxides - GCC
Instant access. No credit card needed.


