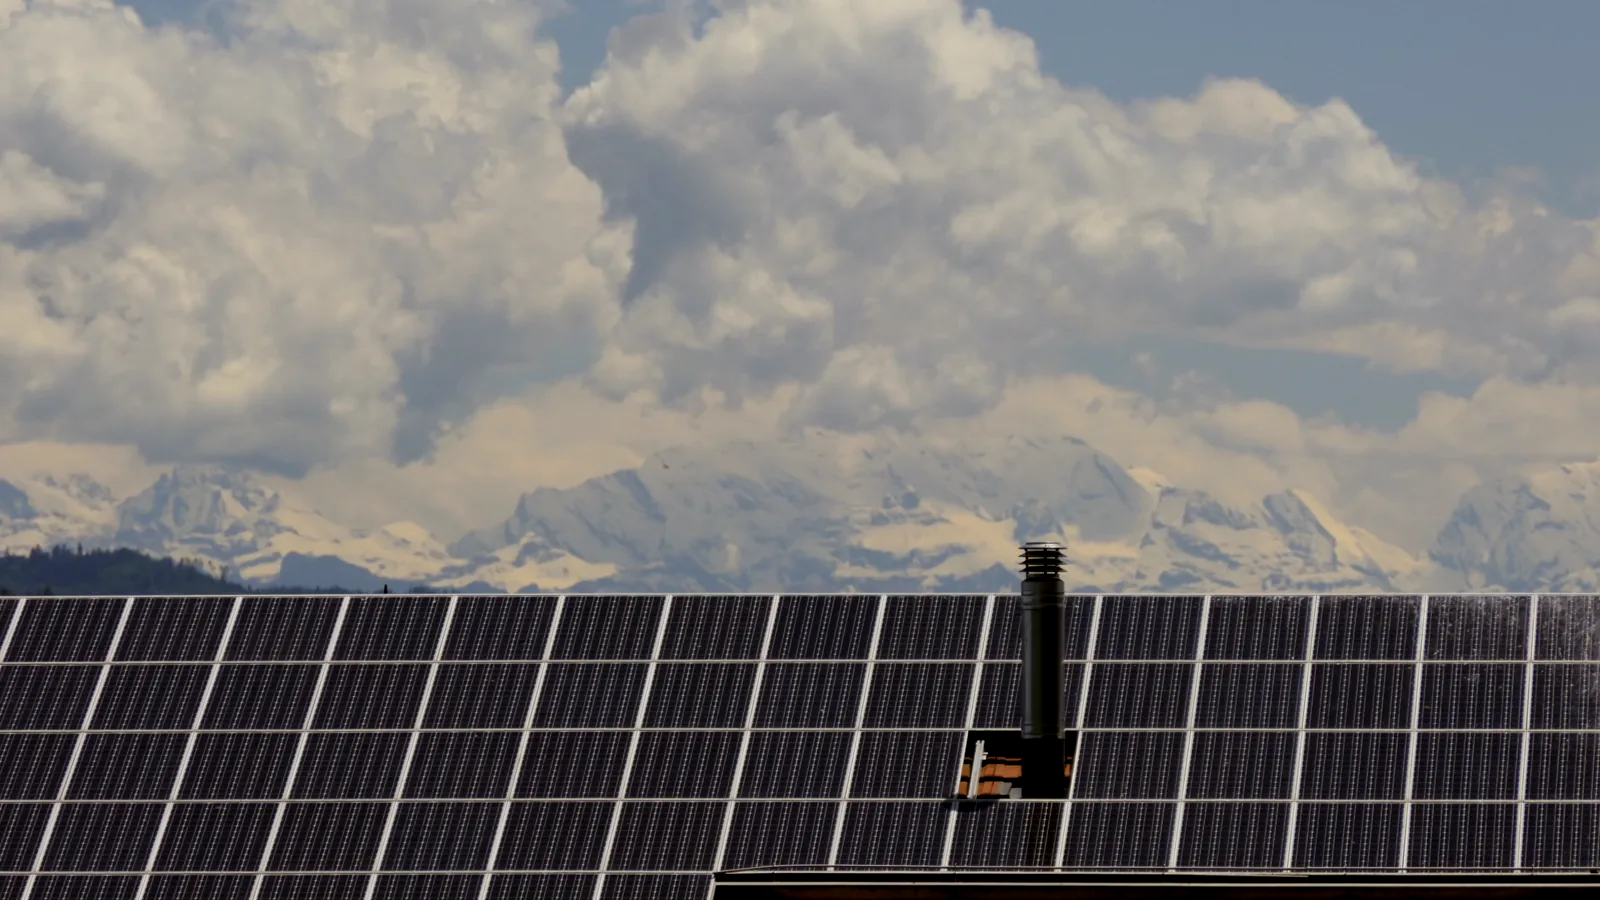
Austrian Study: Land Use for 90 TWh Solar Targets Requires 5-16% of Crop Area
An analysis from pv magazine examines the land use implications of meeting solar electricity goals through agricultural installations. Researchers from the University of Natural Resources and Life Sciences, Vienna, conducted a techno-economic assessment of agrivoltaic systems, which combine photovoltaic electricity generation with crop production.
The study created a simulation framework to model both power generation and agricultural output across the country, incorporating climate data from past decades and future projections. It evaluated different system designs, including elevated stilted configurations and vertical bifacial panel setups, under various cost conditions.
Findings indicate that ground-mounted photovoltaic systems produce the most electricity per hectare, followed by stilted agrivoltaic systems and then vertical agrivoltaic systems. The profit ratios for these solar installations, when compared to agricultural use alone, were found to be substantially higher.
To generate 90 terawatt-hours of solar electricity annually, a level referenced in climate neutrality planning, the research concluded that between 5% and 16% of Austria's total crop area would be needed. This expansion would result in an estimated reduction in national crop production of 2% to 6%. The study notes that agrivoltaic systems are associated with the lower end of this production loss range. Researchers characterized the climate change adaptation benefits of such systems as limited.
The complete findings are published in the journal Renewable Energy.
This report provides a comprehensive view of the solar cells and light-emitting diodes industry in Austria, tracking demand, supply, and trade flows across the national value chain. It explains how demand across key channels and end-use segments shapes consumption patterns, while also mapping the role of input availability, production efficiency, and regulatory standards on supply.
Beyond headline metrics, the study benchmarks prices, margins, and trade routes so you can see where value is created and how it moves between domestic suppliers and international partners. The analysis is designed to support strategic planning, market entry, portfolio prioritization, and risk management in the solar cells and light-emitting diodes landscape in Austria.
Quick navigation
- Key findings
- Report scope
- Product coverage
- Country coverage
- Methodology
- Forecasts to 2035
- Price analysis
- Market participants
- Country profiles
- How to use this report
- FAQ
Key findings
- Domestic demand is shaped by both household and industrial usage, with trade flows linking local supply to imports and exports.
- Pricing dynamics reflect unit values, freight costs, exchange rates, and regulatory shifts that affect sourcing decisions.
- Supply depends on input availability and production efficiency, creating a distinct national cost curve.
- Market concentration varies by segment, creating different competitive landscapes and entry barriers.
- The 2035 outlook highlights where capacity investment and demand growth are most aligned within the country.
Report scope
The report combines market sizing with trade intelligence and price analytics for Austria. It covers both historical performance and the forward outlook to 2035, allowing you to compare cycles, structural shifts, and policy impacts.
- Market size and growth in value and volume terms
- Consumption structure by end-use segments
- Production capacity, output, and cost dynamics
- Trade flows, exporters, importers, and balances
- Price benchmarks, unit values, and margin signals
- Competitive context and market entry conditions
Product coverage
- Prodcom 26112220 - Semiconductor light emitting diodes (LEDs)
- Prodcom 26112240 - Photosensitive semiconductor devices, solar cells, photodiodes, p hoto-transistors, etc.
Country coverage
- Austria
Country profile and benchmarks
This report provides a consistent view of market size, trade balance, prices, and per-capita indicators for Austria. The profile highlights demand structure and trade position, enabling benchmarking against regional and global peers.
Methodology
The analysis is built on a multi-source framework that combines official statistics, trade records, company disclosures, and expert validation. Data are standardized, reconciled, and cross-checked to ensure consistency across time series.
- International trade data (exports, imports, and mirror statistics)
- National production and consumption statistics
- Company-level information from financial filings and public releases
- Price series and unit value benchmarks
- Analyst review, outlier checks, and time-series validation
All data are normalized to a common product definition and mapped to a consistent set of codes. This ensures that comparisons across time are aligned and actionable.
Forecasts to 2035
The forecast horizon extends to 2035 and is based on a structured model that links solar cells and light-emitting diodes demand and supply to macroeconomic indicators, trade patterns, and sector-specific drivers. The model captures both cyclical and structural factors and reflects known policy and technology shifts in Austria.
- Historical baseline: 2012-2025
- Forecast horizon: 2026-2035
- Scenario-based sensitivity to income growth, substitution, and regulation
- Capacity and investment outlook for major producing companies
Each projection is built from national historical patterns and the broader regional context, allowing the report to show where growth is concentrated and where risks are elevated.
Price analysis and trade dynamics
Prices are analyzed in detail, including export and import unit values, regional spreads, and changes in trade costs. The report highlights how seasonality, freight rates, exchange rates, and supply disruptions influence pricing and margins.
- Price benchmarks by country and sub-region
- Export and import unit value trends
- Seasonality and calendar effects in trade flows
- Price outlook to 2035 under baseline assumptions
Profiles of market participants
Key producers, exporters, and distributors are profiled with a focus on their operational scale, geographic footprint, product mix, and market positioning. This helps identify competitive pressure points, partnership opportunities, and routes to differentiation.
- Business focus and production capabilities
- Geographic reach and distribution networks
- Cost structure and pricing strategy indicators
- Compliance, certification, and sustainability context
How to use this report
- Quantify domestic demand and identify the most attractive segments
- Evaluate export opportunities and prioritize target destinations
- Track price dynamics and protect margins
- Benchmark performance against leading competitors
- Build evidence-based forecasts for investment decisions
This report is designed for manufacturers, distributors, importers, wholesalers, investors, and advisors who need a clear, data-driven picture of solar cells and light-emitting diodes dynamics in Austria.
FAQ
What is included in the solar cells and light-emitting diodes market in Austria?
The market size aggregates consumption and trade data, presented in both value and volume terms.
How are the forecasts to 2035 built?
The projections combine historical trends with macroeconomic indicators, trade dynamics, and sector-specific drivers.
Does the report cover prices and margins?
Yes, it includes export and import unit values, regional spreads, and a pricing outlook to 2035.
Which benchmarks are included?
The report benchmarks market size, trade balance, prices, and per-capita indicators for Austria.
Can this report support market entry decisions?
Yes, it highlights demand hotspots, trade routes, pricing trends, and competitive context.
1. INTRODUCTION
Making Data-Driven Decisions to Grow Your Business
- REPORT DESCRIPTION
- RESEARCH METHODOLOGY AND THE AI PLATFORM
- DATA-DRIVEN DECISIONS FOR YOUR BUSINESS
- GLOSSARY AND SPECIFIC TERMS
2. EXECUTIVE SUMMARY
A Quick Overview of Market Performance
- KEY FINDINGS
- MARKET TRENDSThis Chapter is Available Only for the Professional EditionPRO
3. MARKET OVERVIEW
Understanding the Current State of The Market and its Prospects
- MARKET SIZE: HISTORICAL DATA (2012–2025) AND FORECAST (2026–2035)
- MARKET STRUCTURE: HISTORICAL DATA (2012–2025) AND FORECAST (2026–2035)
- TRADE BALANCE: HISTORICAL DATA (2012–2025) AND FORECAST (2026–2035)
- PER CAPITA CONSUMPTION: HISTORICAL DATA (2012–2025) AND FORECAST (2026–2035)
- MARKET FORECAST TO 2035
4. MOST PROMISING PRODUCTS FOR DIVERSIFICATION
Finding New Products to Diversify Your Business
- TOP PRODUCTS TO DIVERSIFY YOUR BUSINESS
- BEST-SELLING PRODUCTS
- MOST CONSUMED PRODUCTS
- MOST TRADED PRODUCTS
- MOST PROFITABLE PRODUCTS FOR EXPORTS
5. MOST PROMISING SUPPLYING COUNTRIES
Choosing the Best Countries to Establish Your Sustainable Supply Chain
- TOP COUNTRIES TO SOURCE YOUR PRODUCT
- TOP PRODUCING COUNTRIES
- TOP EXPORTING COUNTRIES
- LOW-COST EXPORTING COUNTRIES
6. MOST PROMISING OVERSEAS MARKETS
Choosing the Best Countries to Boost Your Export
- TOP OVERSEAS MARKETS FOR EXPORTING YOUR PRODUCT
- TOP CONSUMING MARKETS
- UNSATURATED MARKETS
- TOP IMPORTING MARKETS
- MOST PROFITABLE MARKETS
7. PRODUCTION
The Latest Trends and Insights into The Industry
- PRODUCTION VOLUME AND VALUE: HISTORICAL DATA (2012–2025) AND FORECAST (2026–2035)
8. IMPORTS
The Largest Import Supplying Countries
- IMPORTS: HISTORICAL DATA (2012–2025) AND FORECAST (2026–2035)
- IMPORTS BY COUNTRY: HISTORICAL DATA (2012–2025)
- IMPORT PRICES BY COUNTRY: HISTORICAL DATA (2012–2025)
9. EXPORTS
The Largest Destinations for Exports
- EXPORTS: HISTORICAL DATA (2012–2025) AND FORECAST (2026–2035)
- EXPORTS BY COUNTRY: HISTORICAL DATA (2012–2025)
- EXPORT PRICES BY COUNTRY: HISTORICAL DATA (2012–2025)
10. PROFILES OF MAJOR PRODUCERS
The Largest Producers on The Market and Their Profiles
LIST OF TABLES
- Key Findings In 2025
- Market Volume, In Physical Terms: Historical Data (2012–2025) and Forecast (2026–2035)
- Market Value: Historical Data (2012–2025) and Forecast (2026–2035)
- Per Capita Consumption: Historical Data (2012–2025) and Forecast (2026–2035)
- Imports, In Physical Terms, By Country, 2012–2025
- Imports, In Value Terms, By Country, 2012–2025
- Import Prices, By Country, 2012–2025
- Exports, In Physical Terms, By Country, 2012–2025
- Exports, In Value Terms, By Country, 2012–2025
- Export Prices, By Country, 2012–2025
LIST OF FIGURES
- Market Volume, In Physical Terms: Historical Data (2012–2025) and Forecast (2026–2035)
- Market Value: Historical Data (2012–2025) and Forecast (2026–2035)
- Market Structure – Domestic Supply vs. Imports, in Physical Terms: Historical Data (2012–2025) and Forecast (2026–2035)
- Market Structure – Domestic Supply vs. Imports, in Value Terms: Historical Data (2012–2025) and Forecast (2026–2035)
- Trade Balance, In Physical Terms: Historical Data (2012–2025) and Forecast (2026–2035)
- Trade Balance, In Value Terms: Historical Data (2012–2025) and Forecast (2026–2035)
- Per Capita Consumption: Historical Data (2012–2025) and Forecast (2026–2035)
- Market Volume Forecast to 2035
- Market Value Forecast to 2035
- Market Size and Growth, By Product
- Average Per Capita Consumption, By Product
- Exports and Growth, By Product
- Export Prices and Growth, By Product
- Production Volume and Growth
- Exports and Growth
- Export Prices and Growth
- Market Size and Growth
- Per Capita Consumption
- Imports and Growth
- Import Prices
- Production, In Physical Terms: Historical Data (2012–2025) and Forecast (2026–2035)
- Production, In Value Terms: Historical Data (2012–2025) and Forecast (2026–2035)
- Imports, In Physical Terms: Historical Data (2012–2025) and Forecast (2026–2035)
- Imports, In Value Terms: Historical Data (2012–2025) and Forecast (2026–2035)
- Imports, In Physical Terms, By Country, 2025
- Imports, In Physical Terms, By Country, 2012–2025
- Imports, In Value Terms, By Country, 2012–2025
- Import Prices, By Country, 2012–2025
- Exports, In Physical Terms: Historical Data (2012–2025) and Forecast (2026–2035)
- Exports, In Value Terms: Historical Data (2012–2025) and Forecast (2026–2035)
- Exports, In Physical Terms, By Country, 2025
- Exports, In Physical Terms, By Country, 2012–2025
- Exports, In Value Terms, By Country, 2012–2025
- Export Prices, By Country, 2012–2025
Recommended posts
Free Data: Solar Cells and Light-Emitting Diodes - Austria
Instant access. No credit card needed.


