
Australia - Video Monitors - Market Analysis, Forecast, Size, Trends and Insights
Get instant access to more than 2 million reports, dashboards, and datasets on the IndexBox Platform.
View PricingAustralia's July 2023 Video Monitor Imports Reach $69M
Australia Video Monitor Imports
In July 2023, after three months of decline, there was significant growth in supplies from abroad of video monitors, when their volume increased by 8.6% to 372K units. Over the period under review, imports continue to indicate a relatively flat trend pattern. The pace of growth was the most pronounced in March 2023 with an increase of 47% m-o-m. Over the period under review, imports hit record highs in July 2023.
In value terms, video monitor imports amounted to $69M (IndexBox estimates) in July 2023. Overall, imports, however, continue to indicate a relatively flat trend pattern. The most prominent rate of growth was recorded in March 2023 with an increase of 25% m-o-m. Over the period under review, imports reached the peak figure at 96M units in August 2022; however, from September 2022 to July 2023, imports failed to regain momentum. 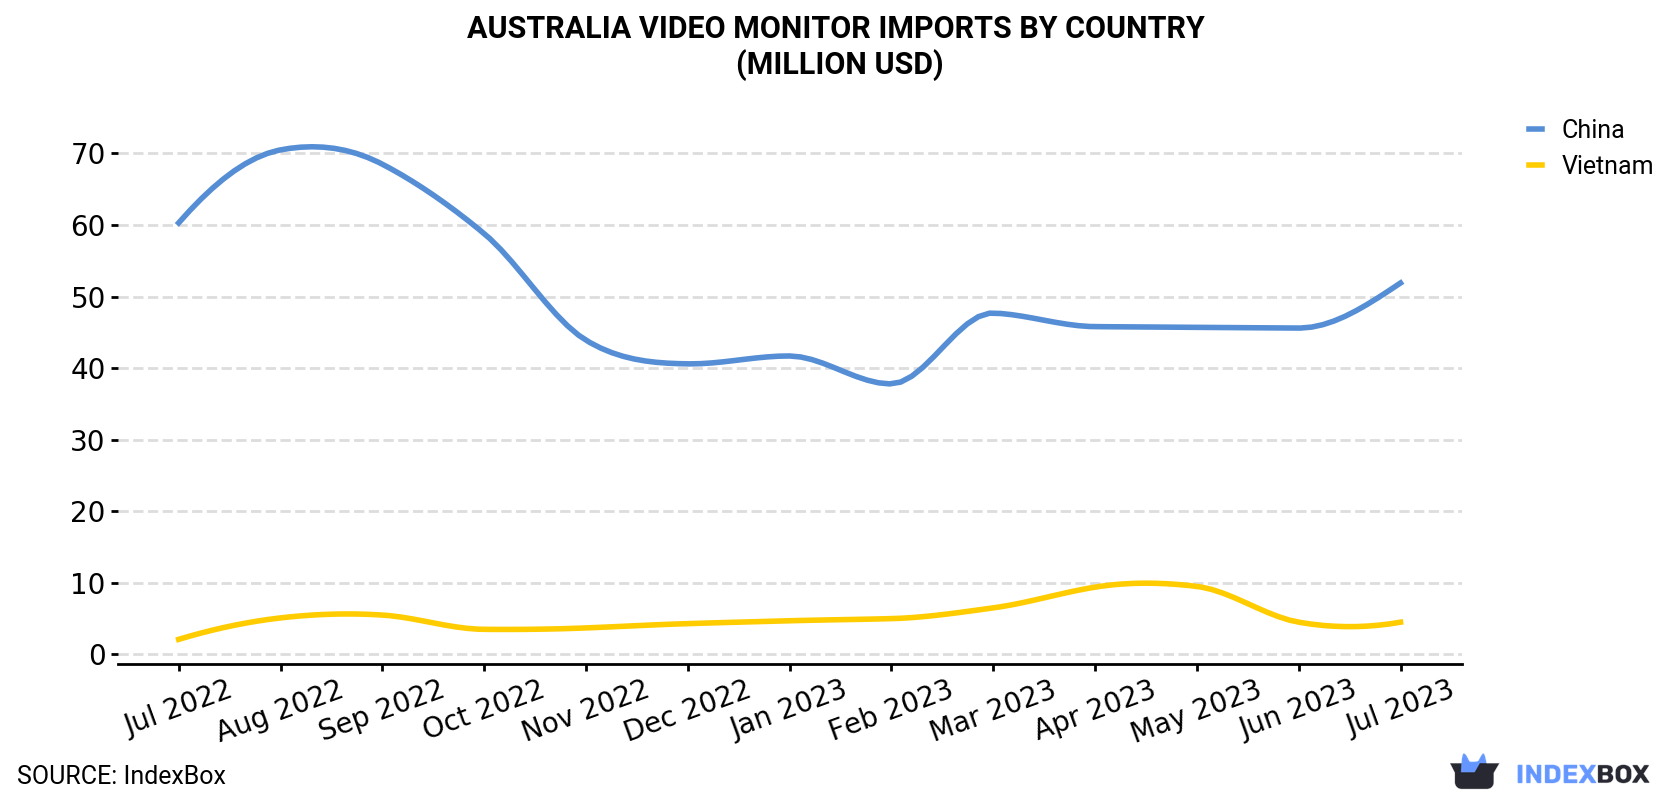
| COUNTRY | Import Value of Video Monitor in Australia (million USD) | ||||||||||||
|---|---|---|---|---|---|---|---|---|---|---|---|---|---|
| Jul 2022 | Aug 2022 | Sep 2022 | Oct 2022 | Nov 2022 | Dec 2022 | Jan 2023 | Feb 2023 | Mar 2023 | Apr 2023 | May 2023 | Jun 2023 | Jul 2023 | |
| China | 60.3 | 70.5 | 68.5 | 58.8 | 43.9 | 40.6 | 41.7 | 37.8 | 47.7 | 45.8 | 45.7 | 45.6 | 51.9 |
| Vietnam | 2.1 | 5.1 | 5.5 | 3.5 | 3.7 | 4.3 | 4.7 | 5.0 | 6.5 | 9.4 | 9.5 | 4.5 | 4.5 |
| Others | 15.0 | 20.6 | 16.9 | 20.0 | 19.5 | 15.1 | 17.2 | 13.7 | 16.6 | 15.3 | 21.5 | 18.8 | 12.9 |
| Total | 77.3 | 96.2 | 90.9 | 82.4 | 67.1 | 60.0 | 63.7 | 56.5 | 70.8 | 70.5 | 76.7 | 69.0 | 69.2 |
Imports by Country
In July 2023, China (327K units) constituted the largest supplier of video monitor to Australia, accounting for a 88% share of total imports. Moreover, video monitor imports from China exceeded the figures recorded by the second-largest supplier, Vietnam (29K units), more than tenfold.
From July 2022 to July 2023, the average monthly growth rate of volume from China was relatively modest.
In value terms, China ($52M) constituted the largest supplier of video monitor to Australia, comprising 75% of total imports. The second position in the ranking was taken by Vietnam ($4.5M), with a 6.5% share of total imports.
From July 2022 to July 2023, the average monthly growth rate of value from China amounted to -1.2%.
Import Prices by Country
In July 2023, the video monitor price amounted to $186 per unit (CIF, Australia), dropping by -7.6% against the previous month. In general, the import price continues to indicate a slight downturn. The most prominent rate of growth was recorded in August 2022 an increase of 19% m-o-m. Over the period under review, average import prices reached the maximum at $286 per unit in September 2022; however, from October 2022 to July 2023, import prices remained at a lower figure.
Average prices varied noticeably amongst the major supplying countries. In July 2023, the country with the highest price was China ($159 per unit), while the price for Vietnam totaled $157 per unit.
From July 2022 to July 2023, the most notable rate of growth in terms of prices was attained by China (-1.3%).
This report provides an in-depth analysis of the video monitor market in Australia. Within it, you will discover the latest data on market trends and opportunities by country, consumption, production and price developments, as well as the global trade (imports and exports). The forecast exhibits the market prospects through 2030.
Product coverage:
- Prodcom 26403420 - Video projectors
- Prodcom 26403440 - Colour video monitors with cathode-ray tube
- Prodcom 26403460 - Flat panel video monitor, LCD or plasma, etc., without tuner (colour video monitors) (excluding with cathode-ray tube)
- Prodcom 26403480 - Black and white or other monochrome video monitors
- Prodcom 26403400 -
- Prodcom 26201700 - Monitors and projectors, principally used in an automatic data processing system
Country coverage:
- Australia
Data coverage:
- Market volume and value
- Per Capita consumption
- Forecast of the market dynamics in the medium term
- Trade (exports and imports) in Australia
- Export and import prices
- Market trends, drivers and restraints
- Key market players and their profiles
Reasons to buy this report:
- Take advantage of the latest data
- Find deeper insights into current market developments
- Discover vital success factors affecting the market
This report is designed for manufacturers, distributors, importers, and wholesalers, as well as for investors, consultants and advisors.
In this report, you can find information that helps you to make informed decisions on the following issues:
- How to diversify your business and benefit from new market opportunities
- How to load your idle production capacity
- How to boost your sales on overseas markets
- How to increase your profit margins
- How to make your supply chain more sustainable
- How to reduce your production and supply chain costs
- How to outsource production to other countries
- How to prepare your business for global expansion
While doing this research, we combine the accumulated expertise of our analysts and the capabilities of artificial intelligence. The AI-based platform, developed by our data scientists, constitutes the key working tool for business analysts, empowering them to discover deep insights and ideas from the marketing data.
-
1. INTRODUCTION
Making Data-Driven Decisions to Grow Your Business
- REPORT DESCRIPTION
- RESEARCH METHODOLOGY AND AI PLATFORM
- DATA-DRIVEN DECISIONS FOR YOUR BUSINESS
- GLOSSARY AND SPECIFIC TERMS
-
2. EXECUTIVE SUMMARY
A Quick Overview of Market Performance
- KEY FINDINGS
- MARKET TRENDS This Chapter is Available Only for the Professional Edition PRO
-
3. MARKET OVERVIEW
Understanding the Current State of The Market and Its Prospects
- MARKET SIZE
- MARKET STRUCTURE
- TRADE BALANCE
- PER CAPITA CONSUMPTION
- MARKET FORECAST TO 2030
-
4. MOST PROMISING PRODUCT
Finding New Products to Diversify Your Business
This Chapter is Available Only for the Professional Edition PRO- TOP PRODUCTS TO DIVERSIFY YOUR BUSINESS
- BEST-SELLING PRODUCTS
- MOST CONSUMED PRODUCT
- MOST TRADED PRODUCT
- MOST PROFITABLE PRODUCT FOR EXPORT
-
5. MOST PROMISING SUPPLYING COUNTRIES
Choosing the Best Countries to Establish Your Sustainable Supply Chain
This Chapter is Available Only for the Professional Edition PRO- TOP COUNTRIES TO SOURCE YOUR PRODUCT
- TOP PRODUCING COUNTRIES
- TOP EXPORTING COUNTRIES
- LOW-COST EXPORTING COUNTRIES
-
6. MOST PROMISING OVERSEAS MARKETS
Choosing the Best Countries to Boost Your Exports
This Chapter is Available Only for the Professional Edition PRO- TOP OVERSEAS MARKETS FOR EXPORTING YOUR PRODUCT
- TOP CONSUMING MARKETS
- UNSATURATED MARKETS
- TOP IMPORTING MARKETS
- MOST PROFITABLE MARKETS
7. PRODUCTION
The Latest Trends and Insights into The Industry
- PRODUCTION VOLUME AND VALUE
8. IMPORTS
The Largest Import Supplying Countries
- IMPORTS FROM 2012–2023
- IMPORTS BY COUNTRY
- IMPORT PRICES BY COUNTRY
9. EXPORTS
The Largest Destinations for Exports
- EXPORTS FROM 2012–2023
- EXPORTS BY COUNTRY
- EXPORT PRICES BY COUNTRY
-
10. PROFILES OF MAJOR PRODUCERS
The Largest Producers on The Market and Their Profiles
This Chapter is Available Only for the Professional Edition PRO -
LIST OF TABLES
- Key Findings In 2023
- Market Volume, In Physical Terms, 2012–2023
- Market Value, 2012–2023
- Per Capita Consumption In 2012-2023
- Imports, In Physical Terms, By Country, 2012–2023
- Imports, In Value Terms, By Country, 2012–2023
- Import Prices, By Country Of Origin, 2012–2023
- Exports, In Physical Terms, By Country, 2012–2023
- Exports, In Value Terms, By Country, 2012–2023
- Export Prices, By Country Of Destination, 2012–2023
-
LIST OF FIGURES
- Market Volume, In Physical Terms, 2012–2023
- Market Value, 2012–2023
- Market Structure – Domestic Supply vs. Imports, In Physical Terms, 2012-2023
- Market Structure – Domestic Supply vs. Imports, In Value Terms, 2012-2023
- Trade Balance, In Physical Terms, 2012-2023
- Trade Balance, In Value Terms, 2012-2023
- Per Capita Consumption, 2012-2023
- Market Volume Forecast to 2030
- Market Value Forecast to 2030
- Products: Market Size And Growth, By Type
- Products: Average Per Capita Consumption, By Type
- Products: Exports And Growth, By Type
- Products: Export Prices And Growth, By Type
- Production Volume And Growth
- Exports And Growth
- Export Prices And Growth
- Market Size And Growth
- Per Capita Consumption
- Imports And Growth
- Import Prices
- Production, In Physical Terms, 2012–2023
- Production, In Value Terms, 2012–2023
- Imports, In Physical Terms, 2012–2023
- Imports, In Value Terms, 2012–2023
- Imports, In Physical Terms, By Country, 2023
- Imports, In Physical Terms, By Country, 2012–2023
- Imports, In Value Terms, By Country, 2012–2023
- Import Prices, By Country Of Origin, 2012–2023
- Exports, In Physical Terms, 2012–2023
- Exports, In Value Terms, 2012–2023
- Exports, In Physical Terms, By Country, 2023
- Exports, In Physical Terms, By Country, 2012–2023
- Exports, In Value Terms, By Country, 2012–2023
- Export Prices, By Country Of Destination, 2012–2023


