World - Apricots - Market Analysis, Forecast, Size, Trends and Insights
Get instant access to more than 2 million reports, dashboards, and datasets on the IndexBox Platform.
View PricingWorldwide Apricot Market Expected to Experience 2.3% CAGR Growth Over Next Seven Years
IndexBox has just published a new report: World - Apricots - Market Analysis, Forecast, Size, Trends and Insights.
Driven by rising demand for apricots worldwide, the market is forecasted to show a slight increase in performance, with a projected CAGR of +2.3% in volume and +4.2% in value from 2023 to 2030.
Market Forecast
Driven by rising demand for apricot worldwide, the market is expected to start an upward consumption trend over the next seven years. The performance of the market is forecast to increase slightly, with an anticipated CAGR of +2.3% for the period from 2023 to 2030, which is projected to bring the market volume to 4.4M tons by the end of 2030.
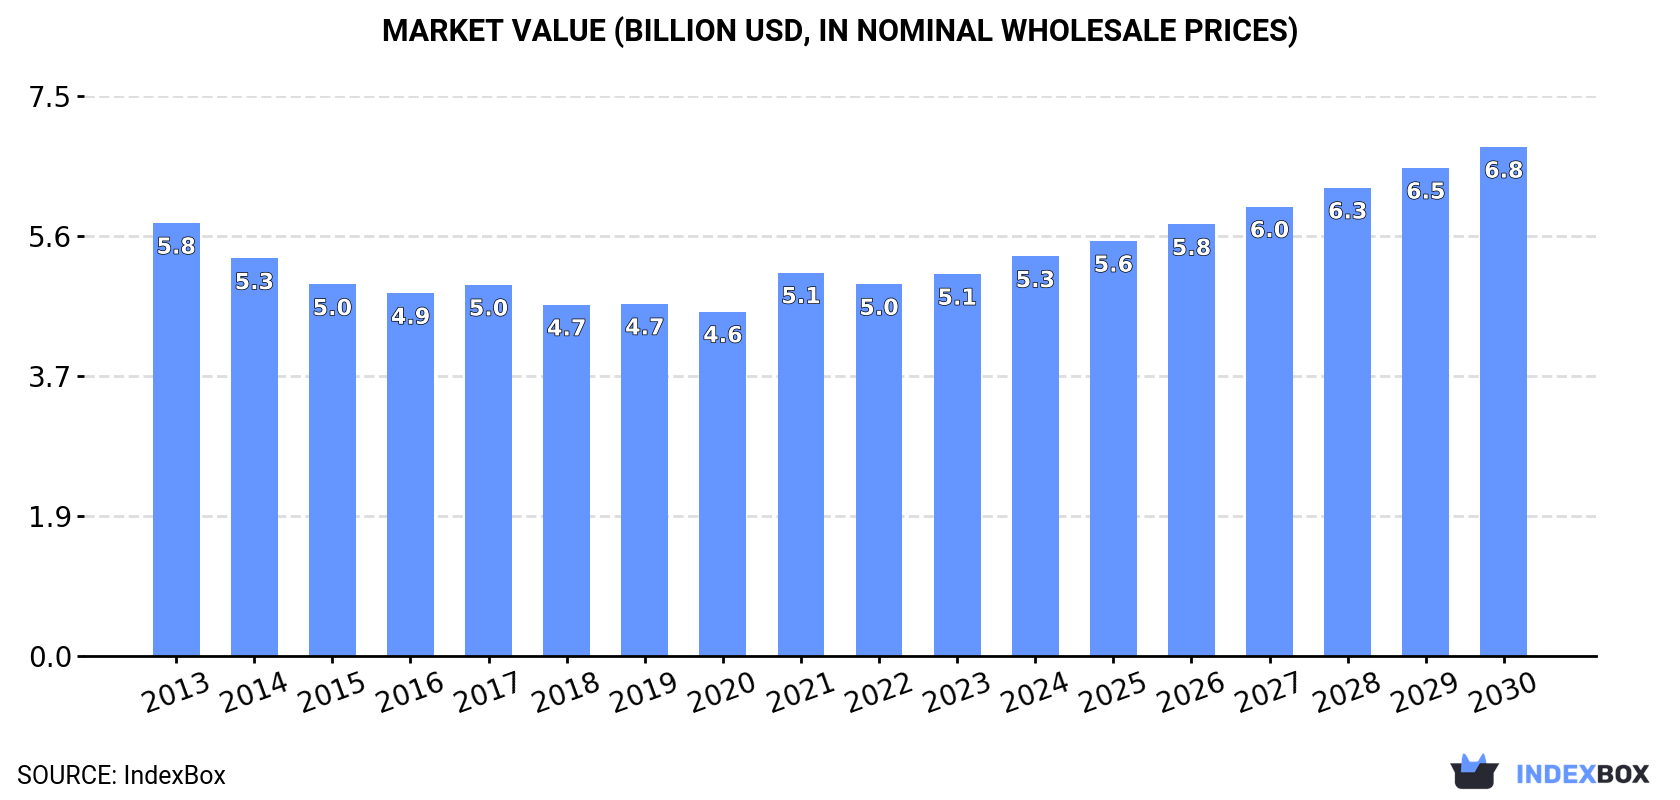
In value terms, the market is forecast to increase with an anticipated CAGR of +4.2% for the period from 2023 to 2030, which is projected to bring the market value to $6.8B (in in nominal wholesale prices) by the end of 2030.
Consumption
World Consumption of Apricots
In 2023, approx. 3.8M tons of apricots were consumed worldwide; dropping by -1.9% against the previous year's figure. Over the period under review, consumption recorded a relatively flat trend pattern. As a result, consumption attained the peak volume of 4.3M tons. From 2018 to 2023, the growth of the global consumption remained at a somewhat lower figure.
The global apricot market size reached $5.1B in 2023, rising by 2.7% against the previous year. This figure reflects the total revenues of producers and importers (excluding logistics costs, retail marketing costs, and retailers' margins, which will be included in the final consumer price). In general, consumption recorded a mild shrinkage. Global consumption peaked at $5.8B in 2013; however, from 2014 to 2023, consumption failed to regain momentum.
Consumption By Country
The countries with the highest volumes of consumption in 2023 were Turkey (730K tons), Uzbekistan (432K tons) and Iran (277K tons), together comprising 38% of global consumption. Italy, Pakistan, Algeria, Afghanistan, Russia, Japan, Armenia, France, Morocco and Greece lagged somewhat behind, together comprising a further 35%.
From 2013 to 2023, the biggest increases were recorded for Afghanistan (with a CAGR of +6.9%), while consumption for the other global leaders experienced more modest paces of growth.
In value terms, the largest apricot markets worldwide were Uzbekistan ($655M), Turkey ($647M) and Japan ($549M), with a combined 36% share of the global market. Italy, Pakistan, Iran, Algeria, Russia, France, Morocco, Afghanistan, Greece and Armenia lagged somewhat behind, together comprising a further 36%.
In terms of the main consuming countries, Armenia, with a CAGR of +4.0%, recorded the highest growth rate of market size over the period under review, while market for the other global leaders experienced more modest paces of growth.
In 2023, the highest levels of apricot per capita consumption was registered in Armenia (32 kg per person), followed by Uzbekistan (12 kg per person), Turkey (8.5 kg per person) and Greece (6.7 kg per person), while the world average per capita consumption of apricot was estimated at 0.5 kg per person.
From 2013 to 2023, the average annual growth rate of the apricot per capita consumption in Armenia stood at +3.0%. The remaining consuming countries recorded the following average annual rates of per capita consumption growth: Uzbekistan (-2.7% per year) and Turkey (-1.3% per year).
Production
World Production of Apricots
Global apricot production fell modestly to 3.7M tons in 2023, waning by -3.2% on 2022 figures. Overall, production continues to indicate a relatively flat trend pattern. The most prominent rate of growth was recorded in 2017 when the production volume increased by 15% against the previous year. As a result, production attained the peak volume of 4.3M tons. From 2018 to 2023, global production growth remained at a lower figure. The general negative trend in terms output was largely conditioned by a relatively flat trend pattern of the harvested area and a relatively flat trend pattern in yield figures.
In value terms, apricot production rose significantly to $5.3B in 2023 estimated in export price. Over the period under review, production saw a slight reduction. The pace of growth was the most pronounced in 2021 when the production volume increased by 24%. Over the period under review, global production reached the peak level at $6B in 2013; however, from 2014 to 2023, production remained at a lower figure.
Production By Country
The countries with the highest volumes of production in 2023 were Turkey (802K tons), Uzbekistan (438K tons) and Iran (282K tons), with a combined 41% share of global production. Italy, Algeria, Afghanistan, Pakistan, Japan, Armenia, Spain, Greece, France and Russia lagged somewhat behind, together comprising a further 35%.
From 2013 to 2023, the most notable rate of growth in terms of production, amongst the key producing countries, was attained by Afghanistan (with a CAGR of +7.7%), while production for the other global leaders experienced more modest paces of growth.
Yield
In 2023, the global average yield of apricots fell slightly to 6.8 tons per ha, which is down by -2.2% on 2022. Over the period under review, the yield continues to indicate a relatively flat trend pattern. The pace of growth was the most pronounced in 2017 with an increase of 11% against the previous year. As a result, the yield attained the peak level of 7.7 tons per ha. From 2018 to 2023, the growth of the average apricot yield failed to regain momentum.
Harvested Area
The global apricot harvested area fell modestly to 553K ha in 2023, remaining stable against 2022 figures. Over the period under review, the harvested area showed a relatively flat trend pattern. The growth pace was the most rapid in 2017 with an increase of 3.5%. The global harvested area peaked at 561K ha in 2015; however, from 2016 to 2023, the harvested area remained at a lower figure.
Imports
World Imports of Apricots
In 2023, overseas purchases of apricots increased by 9.5% to 344K tons, rising for the second year in a row after two years of decline. The total import volume increased at an average annual rate of +2.1% from 2013 to 2023; however, the trend pattern indicated some noticeable fluctuations being recorded in certain years. The most prominent rate of growth was recorded in 2017 with an increase of 44% against the previous year. Over the period under review, global imports reached the maximum at 386K tons in 2019; however, from 2020 to 2023, imports remained at a lower figure.
In value terms, apricot imports expanded significantly to $519M in 2023. Overall, imports showed a relatively flat trend pattern. As a result, imports attained the peak and are likely to continue growth in the immediate term.
Imports By Country
The purchases of the three major importers of apricots, namely Russia, Germany and Pakistan, represented more than third of total import. It was distantly followed by Italy (20K tons), comprising a 5.8% share of total imports. Austria (15K tons), Iraq (15K tons), France (12K tons), Romania (11K tons), Poland (11K tons), Ukraine (9.3K tons), Switzerland (8K tons), the Czech Republic (6.9K tons) and the UK (6.4K tons) held a little share of total imports.
From 2013 to 2023, the biggest increases were recorded for Pakistan (with a CAGR of +27.6%), while purchases for the other global leaders experienced more modest paces of growth.
In value terms, the largest apricot importing markets worldwide were Germany ($118M), Russia ($65M) and Austria ($37M), with a combined 42% share of global imports. Italy, France, Switzerland, Poland, the UK, Romania, the Czech Republic, Ukraine, Iraq and Pakistan lagged somewhat behind, together accounting for a further 33%.
In terms of the main importing countries, Romania, with a CAGR of +21.3%, saw the highest growth rate of the value of imports, over the period under review, while purchases for the other global leaders experienced more modest paces of growth.
Import Prices By Country
The average apricot import price stood at $1,508 per ton in 2023, increasing by 3.4% against the previous year. In general, the import price, however, continues to indicate a slight shrinkage. The most prominent rate of growth was recorded in 2021 when the average import price increased by 21%. Global import price peaked at $1,774 per ton in 2013; however, from 2014 to 2023, import prices failed to regain momentum.
Prices varied noticeably by country of destination: amid the top importers, the country with the highest price was Switzerland ($2,781 per ton), while Pakistan ($169 per ton) was amongst the lowest.
From 2013 to 2023, the most notable rate of growth in terms of prices was attained by Romania (+5.2%), while the other global leaders experienced more modest paces of growth.
Exports
World Exports of Apricots
In 2023, the amount of apricots exported worldwide reduced to 332K tons, shrinking by -6.1% against 2022. The total export volume increased at an average annual rate of +1.2% over the period from 2013 to 2023; however, the trend pattern indicated some noticeable fluctuations being recorded throughout the analyzed period. The pace of growth appeared the most rapid in 2017 with an increase of 48%. The global exports peaked at 427K tons in 2019; however, from 2020 to 2023, the exports remained at a lower figure.
In value terms, apricot exports skyrocketed to $543M in 2023. The total export value increased at an average annual rate of +1.2% over the period from 2013 to 2023; however, the trend pattern remained consistent, with somewhat noticeable fluctuations being observed in certain years. As a result, the exports reached the peak and are likely to continue growth in the immediate term.
Exports By Country
In 2023, Spain (78K tons) and Turkey (71K tons) represented the key exporters of apricotsin the world, together recording approx. 45% of total exports. France (28K tons) took an 8.3% share (based on physical terms) of total exports, which put it in second place, followed by Italy (8.2%), Greece (7.8%) and Afghanistan (5.9%). The following exporters - Jordan (11K tons), Serbia (8.4K tons), Uzbekistan (6.5K tons), the United States (5.3K tons) and Armenia (5.3K tons) - together made up 11% of total exports.
From 2013 to 2023, the most notable rate of growth in terms of shipments, amongst the leading exporting countries, was attained by Afghanistan (with a CAGR of +19.8%), while the other global leaders experienced more modest paces of growth.
In value terms, Spain ($166M) remains the largest apricot supplier worldwide, comprising 31% of global exports. The second position in the ranking was taken by Italy ($60M), with an 11% share of global exports. It was followed by Turkey, with an 11% share.
From 2013 to 2023, the average annual rate of growth in terms of value in Spain amounted to +2.8%. In the other countries, the average annual rates were as follows: Italy (+4.9% per year) and Turkey (+3.3% per year).
Export Prices By Country
The average apricot export price stood at $1,636 per ton in 2023, rising by 25% against the previous year. In general, the export price, however, showed a relatively flat trend pattern. The pace of growth appeared the most rapid in 2021 when the average export price increased by 26%. Over the period under review, the average export prices reached the maximum at $1,647 per ton in 2013; afterwards, it flattened through to 2023.
There were significant differences in the average prices amongst the major exporting countries. In 2023, amid the top suppliers, the country with the highest price was Uzbekistan ($6,945 per ton), while Afghanistan ($411 per ton) was amongst the lowest.
From 2013 to 2023, the most notable rate of growth in terms of prices was attained by Uzbekistan (+40.8%), while the other global leaders experienced more modest paces of growth.
This report provides an in-depth analysis of the global apricot market. Within it, you will discover the latest data on market trends and opportunities by country, consumption, production and price developments, as well as the global trade (imports and exports). The forecast exhibits the market prospects through 2030.
Product coverage:
- FCL 526 - Apricots
Country coverage:
Worldwide - the report contains statistical data for 200 countries and includes detailed profiles of the 50 largest consuming countries:
- USA
- China
- Japan
- Germany
- United Kingdom
- France
- Brazil
- Italy
- Russian Federation
- India
- Canada
- Australia
- Republic of Korea
- Spain
- Mexico
- Indonesia
- Netherlands
- Turkey
- Saudi Arabia
- Switzerland
- Sweden
- Nigeria
- Poland
- Belgium
- Argentina
- Norway
- Austria
- Thailand
- United Arab Emirates
- Colombia
- Denmark
- South Africa
- Malaysia
- Israel
- Singapore
- Egypt
- Philippines
- Finland
- Chile
- Ireland
- Pakistan
- Greece
- Portugal
- Kazakhstan
- Algeria
- Czech Republic
- Qatar
- Peru
- Romania
- Vietnam
+ the largest producing countries
Data coverage:
- Global market volume and value
- Per Capita consumption
- Forecast of the market dynamics in the medium term
- Global production, split by region and country
- Global trade (exports and imports)
- Export and import prices
- Market trends, drivers and restraints
- Key market players and their profiles
Company coverage:
Reasons to buy this report:
- Take advantage of the latest data
- Find deeper insights into current market developments
- Discover vital success factors affecting the market
This report is designed for manufacturers, distributors, importers, and wholesalers, as well as for investors, consultants and advisors.
In this report, you can find information that helps you to make informed decisions on the following issues:
- How to diversify your business and benefit from new market opportunities
- How to load your idle production capacity
- How to boost your sales on overseas markets
- How to increase your profit margins
- How to make your supply chain more sustainable
- How to reduce your production and supply chain costs
- How to outsource production to other countries
- How to prepare your business for global expansion
While doing this research, we combine the accumulated expertise of our analysts and the capabilities of artificial intelligence. The AI-based platform, developed by our data scientists, constitutes the key working tool for business analysts, empowering them to discover deep insights and ideas from the marketing data.
-
1. INTRODUCTION
Making Data-Driven Decisions to Grow Your Business
- REPORT DESCRIPTION
- RESEARCH METHODOLOGY AND AI PLATFORM
- DATA-DRIVEN DECISIONS FOR YOUR BUSINESS
- GLOSSARY AND SPECIFIC TERMS
-
2. EXECUTIVE SUMMARY
A Quick Overview of Market Performance
- KEY FINDINGS
- MARKET TRENDS This Chapter is Available Only for the Professional Edition PRO
-
3. MARKET OVERVIEW
Understanding the Current State of The Market and Its Prospects
- MARKET SIZE
- CONSUMPTION BY COUNTRY
- MARKET FORECAST TO 2030
-
4. MOST PROMISING PRODUCT
Finding New Products to Diversify Your Business
This Chapter is Available Only for the Professional Edition PRO- TOP PRODUCTS TO DIVERSIFY YOUR BUSINESS
- BEST-SELLING PRODUCTS
- MOST CONSUMED PRODUCT
- MOST TRADED PRODUCT
- MOST PROFITABLE PRODUCT FOR EXPORT
-
5. MOST PROMISING SUPPLYING COUNTRIES
Choosing the Best Countries to Establish Your Sustainable Supply Chain
This Chapter is Available Only for the Professional Edition PRO- TOP COUNTRIES TO SOURCE YOUR PRODUCT
- TOP PRODUCING COUNTRIES
- COUNTRIES WITH TOP YIELDS
- TOP EXPORTING COUNTRIES
- LOW-COST EXPORTING COUNTRIES
-
6. MOST PROMISING OVERSEAS MARKETS
Choosing the Best Countries to Boost Your Exports
This Chapter is Available Only for the Professional Edition PRO- TOP OVERSEAS MARKETS FOR EXPORTING YOUR PRODUCT
- TOP CONSUMING MARKETS
- UNSATURATED MARKETS
- TOP IMPORTING MARKETS
- MOST PROFITABLE MARKETS
7. GLOBAL PRODUCTION
The Latest Trends and Insights into The Industry
- PRODUCTION VOLUME AND VALUE
- PRODUCTION BY COUNTRY
- HARVESTED AREA AND YIELD BY COUNTRY
8. GLOBAL IMPORTS
The Largest Importers on The Market and How They Succeed
- IMPORTS FROM 2012–2023
- IMPORTS BY COUNTRY
- IMPORT PRICES BY COUNTRY
9. GLOBAL EXPORTS
The Largest Exporters on The Market and How They Succeed
- EXPORTS FROM 2012–2023
- EXPORTS BY COUNTRY
- EXPORT PRICES BY COUNTRY
-
10. PROFILES OF MAJOR PRODUCERS
The Largest Producers on The Market and Their Profiles
This Chapter is Available Only for the Professional Edition PRO -
11. COUNTRY PROFILES
The Largest Markets And Their Profiles
This Chapter is Available Only for the Professional Edition PRO- United States
- China
- Japan
- Germany
- United Kingdom
- France
- Brazil
- Italy
- Russian Federation
- India
- Canada
- Australia
- Republic of Korea
- Spain
- Mexico
- Indonesia
- Netherlands
- Turkey
- Saudi Arabia
- Switzerland
- Sweden
- Nigeria
- Poland
- Belgium
- Argentina
- Norway
- Austria
- Thailand
- United Arab Emirates
- Colombia
- Denmark
- South Africa
- Malaysia
- Israel
- Singapore
- Egypt
- Philippines
- Finland
- Chile
- Ireland
- Pakistan
- Greece
- Portugal
- Kazakhstan
- Algeria
- Czech Republic
- Qatar
- Peru
- Romania
- Vietnam
-
LIST OF TABLES
- Key Findings In 2023
- Market Volume, In Physical Terms, 2012–2023
- Market Value, 2012–2023
- Per Capita Consumption, By Country, 2018–2023
- Production, In Physical Terms, By Country, 2012–2023
- Harvested Area, By Country, 2012-2023
- Yield, By Country, 2012-2023
- Imports, In Physical Terms, By Country, 2012–2023
- Imports, In Value Terms, By Country, 2012–2023
- Import Prices, By Country Of Destination, 2012–2023
- Exports, In Physical Terms, By Country, 2012–2023
- Exports, In Value Terms, By Country, 2012–2023
- Export Prices, By Country Of Origin, 2012–2023
-
LIST OF FIGURES
- Market Volume, In Physical Terms, 2012–2023
- Market Value, 2012–2023
- Consumption, By Country, 2023
- Market Volume Forecast to 2030
- Market Value Forecast to 2030
- Products: Market Size And Growth, By Type
- Products: Average Per Capita Consumption, By Type
- Products: Exports And Growth, By Type
- Products: Export Prices And Growth, By Type
- Production Volume And Growth
- Yield And Growth
- Exports And Growth
- Export Prices And Growth
- Market Size And Growth
- Per Capita Consumption
- Imports And Growth
- Import Prices
- Production, In Physical Terms, 2012–2023
- Production, In Value Terms, 2012–2023
- Area Harvested, 2012–2023
- Yield, 2012–2023
- Production, By Country, 2023
- Production, In Physical Terms, By Country, 2012–2023
- Harvested Area, By Country, 2023
- Harvested Area, By Country, 2012-2023
- Yield, By Country, 2012-2023
- Imports, In Physical Terms, 2012–2023
- Imports, In Value Terms, 2012–2023
- Imports, In Physical Terms, By Country, 2023
- Imports, In Physical Terms, By Country, 2012–2023
- Imports, In Value Terms, By Country, 2012–2023
- Import Prices, By Country, 2012–2023
- Exports, In Physical Terms, 2012–2023
- Exports, In Value Terms, 2012–2023
- Exports, In Physical Terms, By Country, 2023
- Exports, In Physical Terms, By Country, 2012–2023
- Exports, In Value Terms, By Country, 2012–2023
- Export Prices, 2012–2023


