
U.S. - Aluminium Plates, Sheets and Strip of Thickness over 0.2 mm - Market Analysis, Forecast, Size, Trends And Insights
Get instant access to more than 2 million reports, dashboards, and datasets on the IndexBox Platform.
View PricingUnited States' Aluminium Plate and Sheet Market Set to Reach 832K Tons and $5.6B by 2035
IndexBox has just published a new report: U.S. - Aluminium Plates, Sheets and Strip of Thickness over 0.2 mm - Market Analysis, Forecast, Size, Trends And Insights.
The US market for aluminium plates, sheets, and strip over 0.2mm thick saw consumption of 764K tons valued at $4.6B in 2024. Driven by domestic demand, the market is forecast to grow to 832K tons ($5.6B) by 2035. Domestic production (746K tons, $4.7B) closely meets consumption, with imports declining to 30K tons and exports at 12K tons. Oman is the leading import source, while Mexico is the primary export destination. The market exhibits a long-term growth trend in value, though recent years show some volatility.
Key Findings
- Market forecast to reach 832K tons ($5.6B) by 2035, continuing a long-term upward trend
- Domestic production nearly meets consumption, with a small net import position
- Imports have sharply declined, with Oman emerging as the dominant supplier
- Exports are concentrated to Mexico, but overall export volumes are contracting
- Average import prices are significantly lower than average export prices
Market Forecast
Driven by increasing demand for aluminium plates, sheets and strip of thickness over 0.2 mm in the United States, the market is expected to continue an upward consumption trend over the next decade. Market performance is forecast to decelerate, expanding with an anticipated CAGR of +0.8% for the period from 2024 to 2035, which is projected to bring the market volume to 832K tons by the end of 2035.
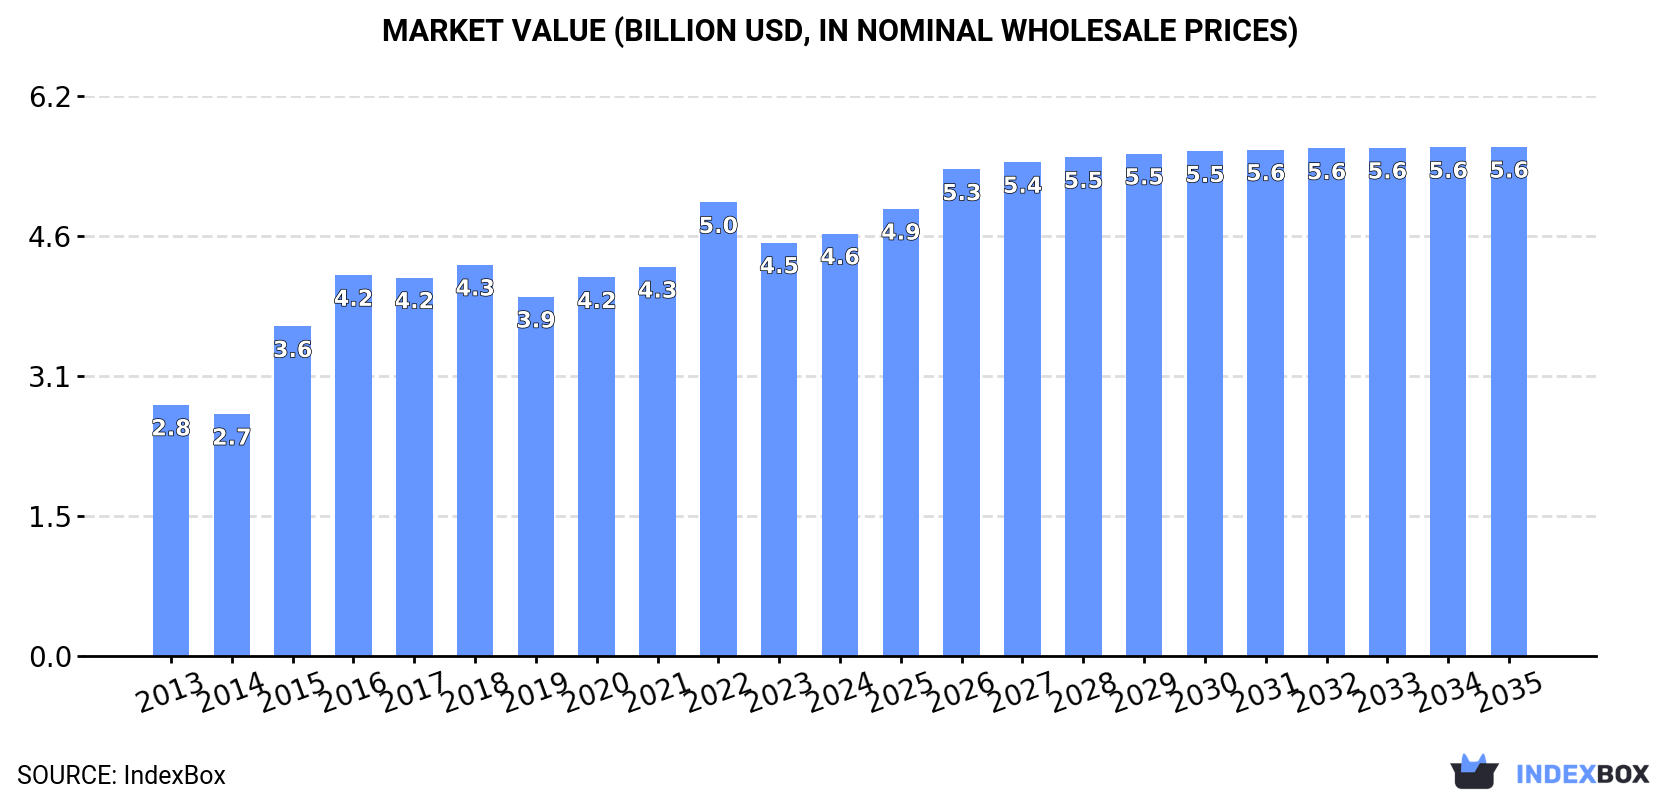
In value terms, the market is forecast to increase with an anticipated CAGR of +1.7% for the period from 2024 to 2035, which is projected to bring the market value to $5.6B (in nominal wholesale prices) by the end of 2035.
Consumption
United States's Consumption of Aluminium Plates, Sheets and Strip
In 2024, the amount of aluminium plates, sheets and strip of thickness over 0.2 mm consumed in the United States fell slightly to 764K tons, with a decrease of -3.5% on the previous year's figure. The total consumption volume increased at an average annual rate of +2.8% over the period from 2013 to 2024; however, the trend pattern indicated some noticeable fluctuations being recorded in certain years. Over the period under review, consumption of reached the maximum volume at 912K tons in 2016; however, from 2017 to 2024, consumption stood at a somewhat lower figure.
The value of the market for aluminium plates, sheets and strip of thickness over 0.2 mm in the United States rose modestly to $4.6B in 2024, increasing by 2.2% against the previous year. This figure reflects the total revenues of producers and importers (excluding logistics costs, retail marketing costs, and retailers' margins, which will be included in the final consumer price). In general, the total consumption indicated a temperate increase from 2013 to 2024: its value increased at an average annual rate of +4.8% over the last eleven years. The trend pattern, however, indicated some noticeable fluctuations being recorded throughout the analyzed period. Based on 2024 figures, consumption decreased by -6.9% against 2022 indices. Over the period under review, the market hit record highs at $5B in 2022; however, from 2023 to 2024, consumption stood at a somewhat lower figure.
Production
United States's Production of Aluminium Plates, Sheets and Strip
In 2024, production of aluminium plates, sheets and strip of thickness over 0.2 mm in the United States declined slightly to 746K tons, dropping by -3.2% compared with the previous year's figure. The total output volume increased at an average annual rate of +2.9% over the period from 2013 to 2024; however, the trend pattern indicated some noticeable fluctuations being recorded in certain years. The pace of growth appeared the most rapid in 2015 when the production volume increased by 40% against the previous year. Production of peaked at 919K tons in 2016; however, from 2017 to 2024, production stood at a somewhat lower figure.
In value terms, production of aluminium plates, sheets and strip of thickness over 0.2 mm rose to $4.7B in 2024. Over the period under review, the total production indicated a strong expansion from 2013 to 2024: its value increased at an average annual rate of +5.4% over the last eleven years. The trend pattern, however, indicated some noticeable fluctuations being recorded throughout the analyzed period. Based on 2024 figures, production decreased by -3.5% against 2022 indices. The most prominent rate of growth was recorded in 2015 when the production volume increased by 38%. Production of peaked at $4.9B in 2022; however, from 2023 to 2024, production failed to regain momentum.
Imports
United States's Imports of Aluminium Plates, Sheets and Strip
In 2024, overseas purchases of aluminium plates, sheets and strip of thickness over 0.2 mm decreased by -12.6% to 30K tons, falling for the second year in a row after two years of growth. Over the period under review, imports saw a pronounced curtailment. The pace of growth was the most pronounced in 2022 when imports increased by 91%. Over the period under review, imports of reached the peak figure at 71K tons in 2014; however, from 2015 to 2024, imports failed to regain momentum.
In value terms, imports of aluminium plates, sheets and strip of thickness over 0.2 mm shrank to $117M in 2024. Overall, imports continue to indicate a noticeable downturn. The most prominent rate of growth was recorded in 2022 with an increase of 103% against the previous year. As a result, imports attained the peak of $265M. From 2023 to 2024, the growth of imports of remained at a lower figure.
Imports By Country
In 2023, Oman (17K tons) constituted the largest aluminium plate, sheet and strip of thickness over 0.2 mm supplier to the United States, with a 51% share of total imports. Moreover, imports of aluminium plates, sheets and strip of thickness over 0.2 mm from Oman exceeded the figures recorded by the second-largest supplier, the UK (8.6K tons), twofold. The third position in this ranking was held by China (2.1K tons), with a 6.2% share.
From 2013 to 2023, the average annual rate of growth in terms of volume from Oman amounted to +48.2%. The remaining supplying countries recorded the following average annual rates of imports growth: the UK (+0.3% per year) and China (-19.4% per year).
In value terms, the largest aluminium plate, sheet and strip of thickness over 0.2 mm suppliers to the United States were Oman ($53M), the UK ($35M) and China ($8.7M), together comprising 74% of total imports. Canada, Poland, Germany and Italy lagged somewhat behind, together comprising a further 15%.
Poland, with a CAGR of +99.4%, recorded the highest growth rate of the value of imports, in terms of the main suppliers over the period under review, while purchases for the other leaders experienced more modest paces of growth.
Imports By Type
In 2024, aluminium; plates, sheets and strip, thickness exceeding 0.2mm, not alloyed, (not rectangular or square) (3.3K tons) was the main type of aluminium plates, sheets and strip of thickness over 0.2 mm supplied to the United States, accounting for a approx. 100% share of total imports.
From 2013 to 2024, the average annual growth rate of the volume of aluminium; plates, sheets and strip, thickness exceeding 0.2mm, not alloyed, (not rectangular or square) imports stood at -14.7%.
In value terms, aluminium; plates, sheets and strip, thickness exceeding 0.2mm, not alloyed, (not rectangular or square) ($14M) constituted the largest type of aluminium plates, sheets and strip of thickness over 0.2 mm supplied to the United States.
From 2013 to 2024, the average annual rate of growth in terms of the value of aluminium; plates, sheets and strip, thickness exceeding 0.2mm, not alloyed, (not rectangular or square) imports totaled -13.7%.
Import Prices By Type
In 2024, the average import price for aluminium plates, sheets and strip of thickness over 0.2 mm amounted to $3,920 per ton, increasing by 3.1% against the previous year. In general, the import price saw a relatively flat trend pattern. The most prominent rate of growth was recorded in 2016 an increase of 27%. The import price peaked at $4,061 per ton in 2022; however, from 2023 to 2024, import prices remained at a lower figure.
As there is only one major imported type of aluminium plate, sheet and strip of thickness over 0.2 mm, the average price level is determined by prices for aluminium; plates, sheets and strip, thickness exceeding 0.2mm, not alloyed, (not rectangular or square).
From 2013 to 2024, the rate of growth in terms of prices for aluminium; plates, sheets and strip, thickness exceeding 0.2mm, not alloyed, (not rectangular or square) amounted to +1.2% per year.
Import Prices By Country
In 2023, the average import price for aluminium plates, sheets and strip of thickness over 0.2 mm amounted to $3,802 per ton, with a decrease of -6.4% against the previous year. Over the period under review, the import price, however, continues to indicate a relatively flat trend pattern. The growth pace was the most rapid in 2016 an increase of 27% against the previous year. The import price peaked at $4,061 per ton in 2022, and then contracted in the following year.
Prices varied noticeably by country of origin: amid the top importers, the country with the highest price was Italy ($9,224 per ton), while the price for Oman ($3,029 per ton) was amongst the lowest.
From 2013 to 2023, the most notable rate of growth in terms of prices was attained by China (+6.3%), while the prices for the other major suppliers experienced more modest paces of growth.
Exports
United States's Exports of Aluminium Plates, Sheets and Strip
Exports of aluminium plates, sheets and strip of thickness over 0.2 mm from the United States dropped to 12K tons in 2024, waning by -7.3% on the previous year's figure. Overall, exports continue to indicate a abrupt slump. The most prominent rate of growth was recorded in 2014 when exports increased by 53% against the previous year. As a result, the exports attained the peak of 42K tons. From 2015 to 2024, the growth of the exports of failed to regain momentum.
In value terms, exports of aluminium plates, sheets and strip of thickness over 0.2 mm shrank to $78M in 2024. In general, exports recorded a perceptible reduction. The most prominent rate of growth was recorded in 2014 with an increase of 41% against the previous year. As a result, the exports reached the peak of $186M. From 2015 to 2024, the growth of the exports of remained at a somewhat lower figure.
Exports By Country
Mexico (7K tons) was the main destination for exports of aluminium plates, sheets and strip of thickness over 0.2 mm from the United States, with a 53% share of total exports. Moreover, exports of aluminium plates, sheets and strip of thickness over 0.2 mm to Mexico exceeded the volume sent to the second major destination, Canada (2.7K tons), threefold. The third position in this ranking was taken by Israel (1.2K tons), with a 9.2% share.
From 2013 to 2023, the average annual growth rate of volume to Mexico totaled -7.0%. Exports to the other major destinations recorded the following average annual rates of exports growth: Canada (-5.6% per year) and Israel (+5.3% per year).
In value terms, Mexico ($43M) remains the key foreign market for aluminium plates, sheets and strip of thickness over 0.2 mm exports from the United States, comprising 50% of total exports. The second position in the ranking was taken by Canada ($16M), with a 19% share of total exports. It was followed by Israel, with a 5.9% share.
From 2013 to 2023, the average annual growth rate of value to Mexico stood at -3.1%. Exports to the other major destinations recorded the following average annual rates of exports growth: Canada (-3.7% per year) and Israel (+6.3% per year).
Exports By Type
Aluminium; plates, sheets and strip, thickness exceeding 0.2mm, not alloyed, (not rectangular or square) (2.8K tons) was the largest type of aluminium plates, sheets and strip of thickness over 0.2 mm exported from the United States, with a approx. 100% share of total exports.
From 2013 to 2024, the average annual rate of growth in terms of the volume of aluminium; plates, sheets and strip, thickness exceeding 0.2mm, not alloyed, (not rectangular or square) exports amounted to -16.0%.
In value terms, aluminium; plates, sheets and strip, thickness exceeding 0.2mm, not alloyed, (not rectangular or square) ($16M) also remains the largest type of aluminium plates, sheets and strip of thickness over 0.2 mm exported from the United States.
From 2013 to 2024, the average annual growth rate of the value of aluminium; plates, sheets and strip, thickness exceeding 0.2mm, not alloyed, (not rectangular or square) exports stood at -14.5%.
Export Prices By Type
The average export price for aluminium plates, sheets and strip of thickness over 0.2 mm stood at $6,351 per ton in 2024, with a decrease of -1.8% against the previous year. Over the period under review, export price indicated notable growth from 2013 to 2024: its price increased at an average annual rate of +2.6% over the last eleven years. The trend pattern, however, indicated some noticeable fluctuations being recorded throughout the analyzed period. Based on 2024 figures, export price for aluminium plates, sheets and strip of thickness over 0.2 mm decreased by -14.3% against 2022 indices. The pace of growth was the most pronounced in 2022 when the average export price increased by 44%. As a result, the export price attained the peak level of $7,408 per ton. From 2023 to 2024, the average export prices remained at a somewhat lower figure.
As there is only one major exported type of aluminium plate, sheet and strip of thickness over 0.2 mm, the average price level is determined by prices for aluminium; plates, sheets and strip, thickness exceeding 0.2mm, not alloyed, (not rectangular or square).
From 2013 to 2024, the rate of growth in terms of prices for aluminium; plates, sheets and strip, thickness exceeding 0.2mm, not alloyed, (not rectangular or square) amounted to +1.9% per year.
Export Prices By Country
The average export price for aluminium plates, sheets and strip of thickness over 0.2 mm stood at $6,465 per ton in 2023, shrinking by -12.7% against the previous year. Over the period under review, export price indicated a perceptible increase from 2013 to 2023: its price increased at an average annual rate of +3.1% over the last decade. The trend pattern, however, indicated some noticeable fluctuations being recorded throughout the analyzed period. Based on 2023 figures, export price for aluminium plates, sheets and strip of thickness over 0.2 mm increased by +29.5% against 2020 indices. The growth pace was the most rapid in 2022 an increase of 44% against the previous year. As a result, the export price reached the peak level of $7,408 per ton, and then contracted in the following year.
Prices varied noticeably by country of destination: amid the top suppliers, the country with the highest price was China ($11,614 per ton), while the average price for exports to Israel ($4,160 per ton) was amongst the lowest.
From 2013 to 2023, the most notable rate of growth in terms of prices was recorded for supplies to the Dominican Republic (+8.5%), while the prices for the other major destinations experienced more modest paces of growth.
This report provides a comprehensive view of the aluminium plate, sheet and strip of thickness over 0.2 mm industry in the United States, tracking demand, supply, and trade flows across the national value chain. It explains how demand across key channels and end-use segments shapes consumption patterns, while also mapping the role of input availability, production efficiency, and regulatory standards on supply.
Beyond headline metrics, the study benchmarks prices, margins, and trade routes so you can see where value is created and how it moves between domestic suppliers and international partners. The analysis is designed to support strategic planning, market entry, portfolio prioritization, and risk management in the aluminium plate, sheet and strip of thickness over 0.2 mm landscape in the United States.
Quick navigation
- Key findings
- Report scope
- Product coverage
- Country coverage
- Methodology
- Forecasts to 2035
- Price analysis
- Market participants
- Country profiles
- How to use this report
- FAQ
Key findings
- Domestic demand is shaped by both household and industrial usage, with trade flows linking local supply to imports and exports.
- Pricing dynamics reflect unit values, freight costs, exchange rates, and regulatory shifts that affect sourcing decisions.
- Supply depends on input availability and production efficiency, creating a distinct national cost curve.
- Market concentration varies by segment, creating different competitive landscapes and entry barriers.
- The 2035 outlook highlights where capacity investment and demand growth are most aligned within the country.
Report scope
The report combines market sizing with trade intelligence and price analytics for the United States. It covers both historical performance and the forward outlook to 2035, allowing you to compare cycles, structural shifts, and policy impacts.
- Market size and growth in value and volume terms
- Consumption structure by end-use segments
- Production capacity, output, and cost dynamics
- Trade flows, exporters, importers, and balances
- Price benchmarks, unit values, and margin signals
- Competitive context and market entry conditions
Product coverage
- Prodcom 24422430 - Aluminium plates, sheets and strips > 0,2 mm thick
Country coverage
- United States
Country profile and benchmarks
This report provides a consistent view of market size, trade balance, prices, and per-capita indicators for the United States. The profile highlights demand structure and trade position, enabling benchmarking against regional and global peers.
Methodology
The analysis is built on a multi-source framework that combines official statistics, trade records, company disclosures, and expert validation. Data are standardized, reconciled, and cross-checked to ensure consistency across time series.
- International trade data (exports, imports, and mirror statistics)
- National production and consumption statistics
- Company-level information from financial filings and public releases
- Price series and unit value benchmarks
- Analyst review, outlier checks, and time-series validation
All data are normalized to a common product definition and mapped to a consistent set of codes. This ensures that comparisons across time are aligned and actionable.
Forecasts to 2035
The forecast horizon extends to 2035 and is based on a structured model that links aluminium plate, sheet and strip of thickness over 0.2 mm demand and supply to macroeconomic indicators, trade patterns, and sector-specific drivers. The model captures both cyclical and structural factors and reflects known policy and technology shifts in the United States.
- Historical baseline: 2012-2025
- Forecast horizon: 2026-2035
- Scenario-based sensitivity to income growth, substitution, and regulation
- Capacity and investment outlook for major producing companies
Each projection is built from national historical patterns and the broader regional context, allowing the report to show where growth is concentrated and where risks are elevated.
Price analysis and trade dynamics
Prices are analyzed in detail, including export and import unit values, regional spreads, and changes in trade costs. The report highlights how seasonality, freight rates, exchange rates, and supply disruptions influence pricing and margins.
- Price benchmarks by country and sub-region
- Export and import unit value trends
- Seasonality and calendar effects in trade flows
- Price outlook to 2035 under baseline assumptions
Profiles of market participants
Key producers, exporters, and distributors are profiled with a focus on their operational scale, geographic footprint, product mix, and market positioning. This helps identify competitive pressure points, partnership opportunities, and routes to differentiation.
- Business focus and production capabilities
- Geographic reach and distribution networks
- Cost structure and pricing strategy indicators
- Compliance, certification, and sustainability context
How to use this report
- Quantify domestic demand and identify the most attractive segments
- Evaluate export opportunities and prioritize target destinations
- Track price dynamics and protect margins
- Benchmark performance against leading competitors
- Build evidence-based forecasts for investment decisions
This report is designed for manufacturers, distributors, importers, wholesalers, investors, and advisors who need a clear, data-driven picture of aluminium plate, sheet and strip of thickness over 0.2 mm dynamics in the United States.
FAQ
What is included in the aluminium plate, sheet and strip of thickness over 0.2 mm market in the United States?
The market size aggregates consumption and trade data, presented in both value and volume terms.
How are the forecasts to 2035 built?
The projections combine historical trends with macroeconomic indicators, trade dynamics, and sector-specific drivers.
Does the report cover prices and margins?
Yes, it includes export and import unit values, regional spreads, and a pricing outlook to 2035.
Which benchmarks are included?
The report benchmarks market size, trade balance, prices, and per-capita indicators for the United States.
Can this report support market entry decisions?
Yes, it highlights demand hotspots, trade routes, pricing trends, and competitive context.
1. INTRODUCTION
Making Data-Driven Decisions to Grow Your Business
- REPORT DESCRIPTION
- RESEARCH METHODOLOGY AND THE AI PLATFORM
- DATA-DRIVEN DECISIONS FOR YOUR BUSINESS
- GLOSSARY AND SPECIFIC TERMS
2. EXECUTIVE SUMMARY
A Quick Overview of Market Performance
- KEY FINDINGS
- MARKET TRENDSThis Chapter is Available Only for the Professional EditionPRO
3. MARKET OVERVIEW
Understanding the Current State of The Market and its Prospects
- MARKET SIZE: HISTORICAL DATA (2012–2025) AND FORECAST (2026–2035)
- MARKET STRUCTURE: HISTORICAL DATA (2012–2025) AND FORECAST (2026–2035)
- TRADE BALANCE: HISTORICAL DATA (2012–2025) AND FORECAST (2026–2035)
- PER CAPITA CONSUMPTION: HISTORICAL DATA (2012–2025) AND FORECAST (2026–2035)
- MARKET FORECAST TO 2035
4. MOST PROMISING PRODUCTS FOR DIVERSIFICATION
Finding New Products to Diversify Your Business
- TOP PRODUCTS TO DIVERSIFY YOUR BUSINESS
- BEST-SELLING PRODUCTS
- MOST CONSUMED PRODUCTS
- MOST TRADED PRODUCTS
- MOST PROFITABLE PRODUCTS FOR EXPORTS
5. MOST PROMISING SUPPLYING COUNTRIES
Choosing the Best Countries to Establish Your Sustainable Supply Chain
- TOP COUNTRIES TO SOURCE YOUR PRODUCT
- TOP PRODUCING COUNTRIES
- TOP EXPORTING COUNTRIES
- LOW-COST EXPORTING COUNTRIES
6. MOST PROMISING OVERSEAS MARKETS
Choosing the Best Countries to Boost Your Export
- TOP OVERSEAS MARKETS FOR EXPORTING YOUR PRODUCT
- TOP CONSUMING MARKETS
- UNSATURATED MARKETS
- TOP IMPORTING MARKETS
- MOST PROFITABLE MARKETS
7. PRODUCTION
The Latest Trends and Insights into The Industry
- PRODUCTION VOLUME AND VALUE: HISTORICAL DATA (2012–2025) AND FORECAST (2026–2035)
8. IMPORTS
The Largest Import Supplying Countries
- IMPORTS: HISTORICAL DATA (2012–2025) AND FORECAST (2026–2035)
- IMPORTS BY COUNTRY: HISTORICAL DATA (2012–2025)
- IMPORT PRICES BY COUNTRY: HISTORICAL DATA (2012–2025)
9. EXPORTS
The Largest Destinations for Exports
- EXPORTS: HISTORICAL DATA (2012–2025) AND FORECAST (2026–2035)
- EXPORTS BY COUNTRY: HISTORICAL DATA (2012–2025)
- EXPORT PRICES BY COUNTRY: HISTORICAL DATA (2012–2025)
10. PROFILES OF MAJOR PRODUCERS
The Largest Producers on The Market and Their Profiles
LIST OF TABLES
- Key Findings In 2025
- Market Volume, In Physical Terms: Historical Data (2012–2025) and Forecast (2026–2035)
- Market Value: Historical Data (2012–2025) and Forecast (2026–2035)
- Per Capita Consumption: Historical Data (2012–2025) and Forecast (2026–2035)
- Imports, In Physical Terms, By Country, 2012–2025
- Imports, In Value Terms, By Country, 2012–2025
- Import Prices, By Country, 2012–2025
- Exports, In Physical Terms, By Country, 2012–2025
- Exports, In Value Terms, By Country, 2012–2025
- Export Prices, By Country, 2012–2025
LIST OF FIGURES
- Market Volume, In Physical Terms: Historical Data (2012–2025) and Forecast (2026–2035)
- Market Value: Historical Data (2012–2025) and Forecast (2026–2035)
- Market Structure – Domestic Supply vs. Imports, in Physical Terms: Historical Data (2012–2025) and Forecast (2026–2035)
- Market Structure – Domestic Supply vs. Imports, in Value Terms: Historical Data (2012–2025) and Forecast (2026–2035)
- Trade Balance, In Physical Terms: Historical Data (2012–2025) and Forecast (2026–2035)
- Trade Balance, In Value Terms: Historical Data (2012–2025) and Forecast (2026–2035)
- Per Capita Consumption: Historical Data (2012–2025) and Forecast (2026–2035)
- Market Volume Forecast to 2035
- Market Value Forecast to 2035
- Market Size and Growth, By Product
- Average Per Capita Consumption, By Product
- Exports and Growth, By Product
- Export Prices and Growth, By Product
- Production Volume and Growth
- Exports and Growth
- Export Prices and Growth
- Market Size and Growth
- Per Capita Consumption
- Imports and Growth
- Import Prices
- Production, In Physical Terms: Historical Data (2012–2025) and Forecast (2026–2035)
- Production, In Value Terms: Historical Data (2012–2025) and Forecast (2026–2035)
- Imports, In Physical Terms: Historical Data (2012–2025) and Forecast (2026–2035)
- Imports, In Value Terms: Historical Data (2012–2025) and Forecast (2026–2035)
- Imports, In Physical Terms, By Country, 2025
- Imports, In Physical Terms, By Country, 2012–2025
- Imports, In Value Terms, By Country, 2012–2025
- Import Prices, By Country, 2012–2025
- Exports, In Physical Terms: Historical Data (2012–2025) and Forecast (2026–2035)
- Exports, In Value Terms: Historical Data (2012–2025) and Forecast (2026–2035)
- Exports, In Physical Terms, By Country, 2025
- Exports, In Physical Terms, By Country, 2012–2025
- Exports, In Value Terms, By Country, 2012–2025
- Export Prices, By Country, 2012–2025
Recommended posts
Free Data: Aluminium Plates, Sheets and Strip - United States
Instant access. No credit card needed.


