World - Aluminium Alloy Wire - Market Analysis, Forecast, Size, Trends And Insights
Get instant access to more than 2 million reports, dashboards, and datasets on the IndexBox Platform.
View PricingWorld's Aluminium Alloy Wire Market Set for Growth to 1.4M Tons and $6B
IndexBox has just published a new report: World - Aluminium Alloy Wire - Market Analysis, Forecast, Size, Trends And Insights.
The global aluminium alloy wire market is on an upward trajectory, with consumption reaching 1.2 million tons in 2024, marking the fifth consecutive year of growth. The market value stood at $4.8 billion. Forecasts predict continued expansion, with the market volume expected to reach 1.4 million tons and the value to hit $6 billion by 2035. China is the dominant player, accounting for 27% of global consumption and 28% of production. International trade remains active, with global imports at 276,000 tons and exports at 334,000 tons in 2024. The United States and Germany are the leading importers, while the Netherlands and Canada are the top exporters. Price trends show a slight decline in both import and export prices in 2024, settling at $4,152 and $3,948 per ton, respectively.
Key Findings
- Market forecast to grow to 1.4M tons in volume and $6B in value by 2035
- China leads global consumption and production with 27% and 28% shares respectively
- Global import and export volumes in 2024 were 276K tons and 334K tons
- United States and Germany are the top importers by value
- Netherlands and Canada are the leading exporters worldwide
Market Forecast
Driven by increasing demand for aluminium alloy wire worldwide, the market is expected to continue an upward consumption trend over the next decade. Market performance is forecast to accelerate, expanding with an anticipated CAGR of +1.1% for the period from 2024 to 2035, which is projected to bring the market volume to 1.4M tons by the end of 2035.
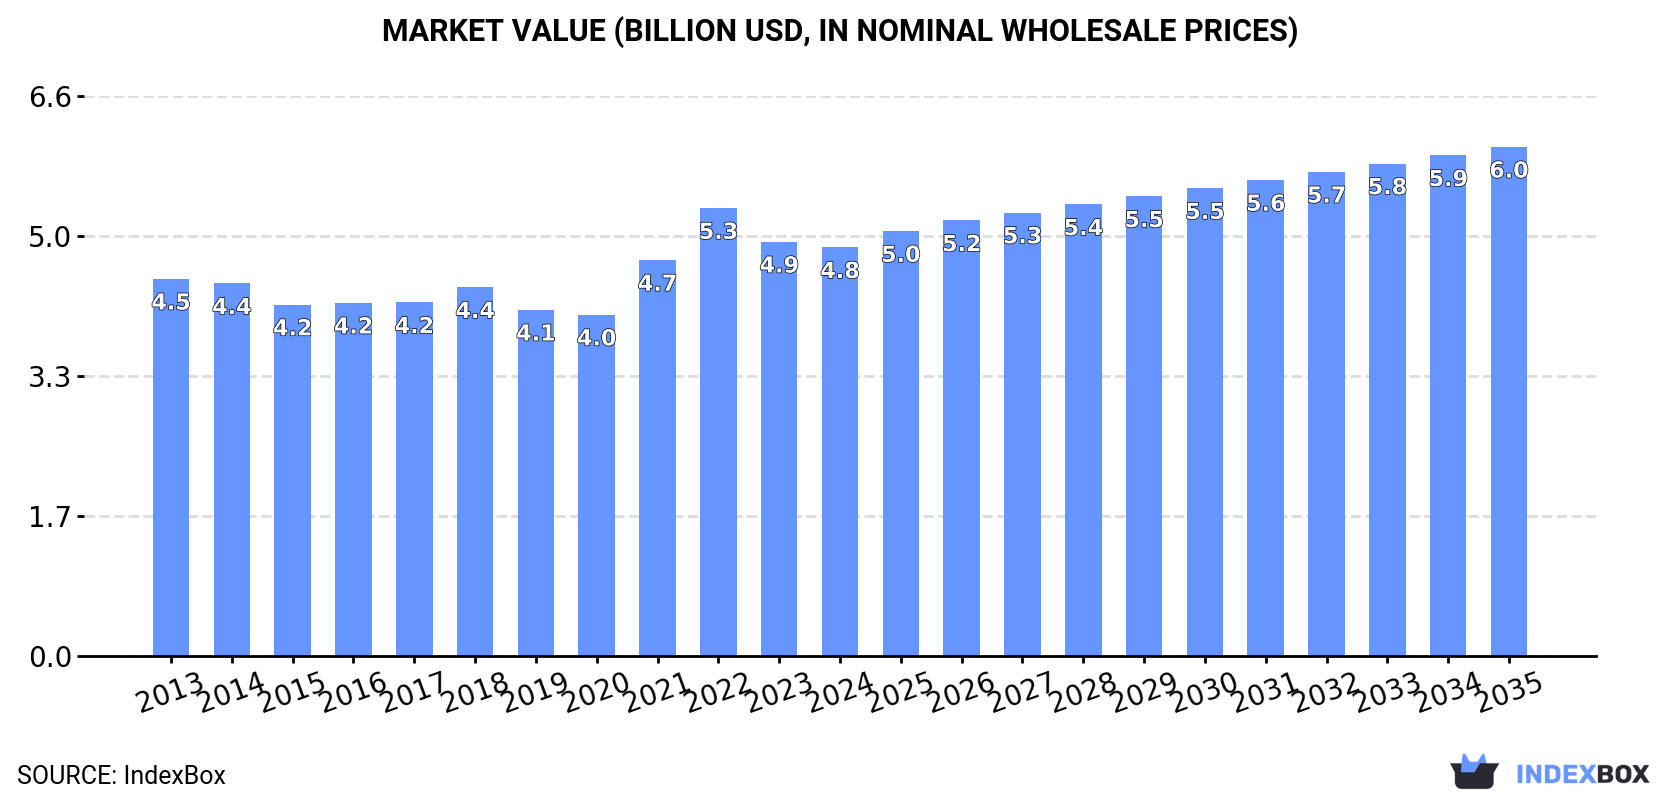
In value terms, the market is forecast to increase with an anticipated CAGR of +2.0% for the period from 2024 to 2035, which is projected to bring the market value to $6B (in nominal wholesale prices) by the end of 2035.
Consumption
World's Consumption of Aluminium Alloy Wire
In 2024, consumption of aluminium alloy wire increased by 2.2% to 1.2M tons, rising for the fifth year in a row after three years of decline. Over the period under review, consumption recorded a relatively flat trend pattern. The growth pace was the most rapid in 2016 when the consumption volume increased by 2.7%. Global consumption peaked in 2024 and is likely to see steady growth in the near future.
The global aluminium alloy wire market value dropped to $4.8B in 2024, approximately reflecting the previous year. This figure reflects the total revenues of producers and importers (excluding logistics costs, retail marketing costs, and retailers' margins, which will be included in the final consumer price). Overall, consumption showed a relatively flat trend pattern. Over the period under review, the global market attained the maximum level at $5.3B in 2022; however, from 2023 to 2024, consumption failed to regain momentum.
Consumption By Country
The country with the largest volume of aluminium alloy wire consumption was China (331K tons), accounting for 27% of total volume. Moreover, aluminium alloy wire consumption in China exceeded the figures recorded by the second-largest consumer, the United States (148K tons), twofold. The third position in this ranking was held by India (131K tons), with an 11% share.
From 2013 to 2024, the average annual growth rate of volume in China was relatively modest. The remaining consuming countries recorded the following average annual rates of consumption growth: the United States (-0.4% per year) and India (+0.5% per year).
In value terms, China ($1.3B), the United States ($742M) and India ($399M) constituted the countries with the highest levels of market value in 2024, together comprising 51% of the global market. Brazil, Germany, Indonesia, the UK, Japan, Russia and Vietnam lagged somewhat behind, together comprising a further 26%.
The UK, with a CAGR of +2.5%, saw the highest rates of growth with regard to market size among the main consuming countries over the period under review, while market for the other global leaders experienced more modest paces of growth.
The countries with the highest levels of aluminium alloy wire per capita consumption in 2024 were Germany (572 kg per 1000 persons), the UK (488 kg per 1000 persons) and the United States (436 kg per 1000 persons).
From 2013 to 2024, the most notable rate of growth in terms of consumption, amongst the key consuming countries, was attained by Russia (with a CAGR of +0.3%), while consumption for the other global leaders experienced more modest paces of growth.
Production
World's Production of Aluminium Alloy Wire
In 2024, the amount of aluminium alloy wire produced worldwide reached 1.3M tons, surging by 2.1% on the previous year. In general, production continues to indicate a relatively flat trend pattern. The most prominent rate of growth was recorded in 2014 when the production volume increased by 7.9% against the previous year. As a result, production attained the peak volume of 1.3M tons; afterwards, it flattened through to 2024.
In value terms, aluminium alloy wire production fell modestly to $5.1B in 2024 estimated in export price. The total output value increased at an average annual rate of +1.1% over the period from 2013 to 2024; the trend pattern remained consistent, with only minor fluctuations being observed throughout the analyzed period. The most prominent rate of growth was recorded in 2021 with an increase of 23%. Global production peaked at $5.7B in 2022; however, from 2023 to 2024, production remained at a lower figure.
Production By Country
The country with the largest volume of aluminium alloy wire production was China (357K tons), accounting for 28% of total volume. Moreover, aluminium alloy wire production in China exceeded the figures recorded by the second-largest producer, India (142K tons), threefold. The third position in this ranking was taken by the United States (114K tons), with an 8.9% share.
From 2013 to 2024, the average annual growth rate of volume in China amounted to +1.1%. The remaining producing countries recorded the following average annual rates of production growth: India (+1.2% per year) and the United States (+0.2% per year).
Imports
World's Imports of Aluminium Alloy Wire
Global aluminium alloy wire imports expanded rapidly to 276K tons in 2024, picking up by 5.6% on the year before. Over the period under review, imports, however, recorded a relatively flat trend pattern. The pace of growth appeared the most rapid in 2021 with an increase of 14% against the previous year. Over the period under review, global imports hit record highs at 290K tons in 2013; however, from 2014 to 2024, imports failed to regain momentum.
In value terms, aluminium alloy wire imports declined slightly to $1.1B in 2024. Overall, total imports indicated mild growth from 2013 to 2024: its value increased at an average annual rate of +1.7% over the last eleven years. The trend pattern, however, indicated some noticeable fluctuations being recorded throughout the analyzed period. Based on 2024 figures, imports decreased by -16.6% against 2022 indices. The growth pace was the most rapid in 2021 with an increase of 41% against the previous year. Global imports peaked at $1.4B in 2022; however, from 2023 to 2024, imports remained at a lower figure.
Imports By Country
In 2024, the United States (43K tons), followed by Germany (26K tons), Vietnam (14K tons) and Italy (13K tons) represented the largest importers of aluminium alloy wire, together committing 35% of total imports. Spain (12K tons), Algeria (9.6K tons), Finland (9.1K tons), India (7.9K tons), South Korea (7.2K tons) and South Africa (6.7K tons) followed a long way behind the leaders.
From 2013 to 2024, the biggest increases were recorded for Finland (with a CAGR of +19.4%), while purchases for the other global leaders experienced more modest paces of growth.
In value terms, the United States ($163M), Germany ($116M) and Italy ($56M) constituted the countries with the highest levels of imports in 2024, with a combined 29% share of global imports. Vietnam, Spain, Algeria, South Korea, Finland, India and South Africa lagged somewhat behind, together comprising a further 22%.
Finland, with a CAGR of +19.0%, saw the highest growth rate of the value of imports, among the main importing countries over the period under review, while purchases for the other global leaders experienced more modest paces of growth.
Import Prices By Country
The average aluminium alloy wire import price stood at $4,152 per ton in 2024, falling by -7.3% against the previous year. Over the last eleven years, it increased at an average annual rate of +2.1%. The growth pace was the most rapid in 2021 an increase of 24%. Global import price peaked at $4,784 per ton in 2022; however, from 2023 to 2024, import prices failed to regain momentum.
Average prices varied somewhat amongst the major importing countries. In 2024, major importing countries recorded the following prices: in Germany ($4,439 per ton) and South Korea ($4,257 per ton), while Finland ($3,318 per ton) and South Africa ($3,364 per ton) were amongst the lowest.
From 2013 to 2024, the most notable rate of growth in terms of prices was attained by Algeria (+3.5%), while the other global leaders experienced more modest paces of growth.
Exports
World's Exports of Aluminium Alloy Wire
In 2024, the amount of aluminium alloy wire exported worldwide expanded slightly to 334K tons, with an increase of 4.6% against 2023 figures. The total export volume increased at an average annual rate of +1.2% from 2013 to 2024; however, the trend pattern indicated some noticeable fluctuations being recorded throughout the analyzed period. The growth pace was the most rapid in 2014 with an increase of 44% against the previous year. As a result, the exports reached the peak of 422K tons. From 2015 to 2024, the growth of the global exports failed to regain momentum.
In value terms, aluminium alloy wire exports totaled $1.3B in 2024. Over the period under review, total exports indicated a measured expansion from 2013 to 2024: its value increased at an average annual rate of +2.4% over the last eleven years. The trend pattern, however, indicated some noticeable fluctuations being recorded throughout the analyzed period. Based on 2024 figures, exports decreased by -13.5% against 2022 indices. The growth pace was the most rapid in 2021 when exports increased by 53% against the previous year. Over the period under review, the global exports reached the maximum at $1.5B in 2022; however, from 2023 to 2024, the exports failed to regain momentum.
Exports By Country
In 2024, the Netherlands (65K tons), distantly followed by Canada (38K tons), China (31K tons), Spain (25K tons), Malaysia (21K tons), India (20K tons), France (18K tons) and Bahrain (18K tons) represented the largest exporters of aluminium alloy wire, together comprising 71% of total exports. The following exporters - Austria (10K tons) and the United States (8.9K tons) - each amounted to a 5.8% share of total exports.
From 2013 to 2024, the most notable rate of growth in terms of shipments, amongst the main exporting countries, was attained by Austria (with a CAGR of +36.7%), while the other global leaders experienced more modest paces of growth.
In value terms, the largest aluminium alloy wire supplying countries worldwide were the Netherlands ($226M), Canada ($141M) and China ($121M), with a combined 37% share of global exports. Spain, Bahrain, France, India, Malaysia, the United States and Austria lagged somewhat behind, together comprising a further 35%.
Austria, with a CAGR of +21.4%, recorded the highest growth rate of the value of exports, in terms of the main exporting countries over the period under review, while shipments for the other global leaders experienced more modest paces of growth.
Export Prices By Country
In 2024, the average aluminium alloy wire export price amounted to $3,948 per ton, reducing by -1.7% against the previous year. Over the last eleven years, it increased at an average annual rate of +1.2%. The most prominent rate of growth was recorded in 2021 when the average export price increased by 24% against the previous year. Over the period under review, the average export prices reached the maximum at $4,190 per ton in 2022; however, from 2023 to 2024, the export prices failed to regain momentum.
Prices varied noticeably by country of origin: amid the top suppliers, the country with the highest price was the United States ($5,785 per ton), while Austria ($949 per ton) was amongst the lowest.
From 2013 to 2024, the most notable rate of growth in terms of prices was attained by Bahrain (+5.5%), while the other global leaders experienced more modest paces of growth.
This report provides a comprehensive view of the global aluminium alloy wire industry, tracking demand, supply, and trade flows across the worldwide value chain. It explains how demand across key channels and end-use segments shapes consumption patterns, while also mapping the role of input availability, production efficiency, and regulatory standards on supply.
Beyond headline metrics, the study benchmarks prices, margins, and trade routes so you can see where value is created and how it moves between exporters and importers worldwide. The analysis is designed to support strategic planning, market entry, portfolio prioritization, and risk management in the global aluminium alloy wire landscape.
Quick navigation
- Key findings
- Report scope
- Product coverage
- Country coverage
- Methodology
- Forecasts to 2035
- Price analysis
- Market participants
- Country profiles
- How to use this report
- FAQ
Key findings
- Global demand is shaped by both household and industrial usage, with trade flows linking cost-competitive producers to import-reliant markets.
- Pricing dynamics reflect unit values, freight costs, exchange rates, and regulatory shifts that affect sourcing decisions.
- Supply depends on input availability and production efficiency, creating distinct cost curves across regions.
- Market concentration varies by country, creating different competitive landscapes and entry barriers.
- The 2035 outlook highlights where capacity investment and demand growth are most aligned globally.
Report scope
The report combines market sizing with trade intelligence and price analytics. It covers both historical performance and the forward outlook to 2035, allowing you to compare cycles, structural shifts, and policy impacts across countries and regions.
- Market size and growth in value and volume terms
- Consumption structure by end-use segments and regions
- Production capacity, output, and cost dynamics
- Global trade flows, exporters, importers, and balances
- Price benchmarks, unit values, and margin signals
- Competitive context and market entry conditions
Product coverage
- Prodcom 24422350 - Aluminium alloy wire (excluding insulated electric wire and cable, twine and cordage reinforced with aluminium wire, s tranded wire and cables)
Country coverage
- Worldwide - the report contains statistical data for 200 countries and includes detailed profiles of the 50 largest consuming countries + the largest producing countries
- USA
- China
- Japan
- Germany
- United Kingdom
- France
- Brazil
- Italy
- Russian Federation
- India
- Canada
- Australia
- Republic of Korea
- Spain
- Mexico
- Indonesia
- Netherlands
- Turkey
- Saudi Arabia
- Switzerland
- Sweden
- Nigeria
- Poland
- Belgium
- Argentina
- Norway
- Austria
- Thailand
- United Arab Emirates
- Colombia
- Denmark
- South Africa
- Malaysia
- Israel
- Singapore
- Egypt
- Philippines
- Finland
- Chile
- Ireland
- Pakistan
- Greece
- Portugal
- Kazakhstan
- Algeria
- Czech Republic
- Qatar
- Peru
- Romania
- Vietnam
Country profiles and benchmarks
For the global report, country profiles provide a consistent view of market size, trade balance, prices, and per-capita indicators. The profiles highlight the largest consuming and producing markets and allow direct benchmarking across peers.
Methodology
The analysis is built on a multi-source framework that combines official statistics, trade records, company disclosures, and expert validation. Data are standardized, reconciled, and cross-checked to ensure consistency across time series.
- International trade data (exports, imports, and mirror statistics)
- National production and consumption statistics
- Company-level information from financial filings and public releases
- Price series and unit value benchmarks
- Analyst review, outlier checks, and time-series validation
All data are normalized to a common product definition and mapped to a consistent set of codes. This ensures that comparisons across time are aligned and actionable.
Forecasts to 2035
The forecast horizon extends to 2035 and is based on a structured model that links aluminium alloy wire demand and supply to macroeconomic indicators, trade patterns, and sector-specific drivers. The model captures both cyclical and structural factors and reflects known policy and technology shifts.
- Historical baseline: 2012-2025
- Forecast horizon: 2026-2035
- Scenario-based sensitivity to income growth, substitution, and regulation
- Capacity and investment outlook for major producing countries
Each country projection is built from its own historical pattern and the regional context, allowing the report to show where growth is concentrated and where risks are elevated.
Price analysis and trade dynamics
Prices are analyzed in detail, including export and import unit values, regional spreads, and changes in trade costs. The report highlights how seasonality, freight rates, exchange rates, and supply disruptions influence pricing and margins.
- Price benchmarks by country and sub-region
- Export and import unit value trends
- Seasonality and calendar effects in trade flows
- Price outlook to 2035 under baseline assumptions
Profiles of market participants
Key producers, exporters, and distributors are profiled with a focus on their operational scale, geographic footprint, product mix, and market positioning. This helps identify competitive pressure points, partnership opportunities, and routes to differentiation.
- Business focus and production capabilities
- Geographic reach and distribution networks
- Cost structure and pricing strategy indicators
- Compliance, certification, and sustainability context
How to use this report
- Quantify global demand and identify the most attractive markets
- Evaluate export opportunities and prioritize target countries
- Track price dynamics and protect margins
- Benchmark performance against major competitors
- Build evidence-based forecasts for investment decisions
This report is designed for manufacturers, distributors, importers, wholesalers, investors, and advisors who need a clear, data-driven picture of global aluminium alloy wire dynamics.
FAQ
What is included in the global aluminium alloy wire market?
The market size aggregates consumption and trade data at country and regional levels, presented in both value and volume terms.
How are the forecasts to 2035 built?
The projections combine historical trends with macroeconomic indicators, trade dynamics, and sector-specific drivers.
Does the report cover prices and margins?
Yes, it includes export and import unit values, regional spreads, and a pricing outlook to 2035.
Which countries are profiled in detail?
The report provides profiles for the largest consuming and producing countries, enabling benchmarking across peers.
Can this report support market entry decisions?
Yes, it highlights demand hotspots, trade routes, pricing trends, and competitive context.
1. INTRODUCTION
Making Data-Driven Decisions to Grow Your Business
- REPORT DESCRIPTION
- RESEARCH METHODOLOGY AND THE AI PLATFORM
- DATA-DRIVEN DECISIONS FOR YOUR BUSINESS
- GLOSSARY AND SPECIFIC TERMS
2. EXECUTIVE SUMMARY
A Quick Overview of Market Performance
- KEY FINDINGS
- MARKET TRENDS This Chapter is Available Only for the Professional EditionPRO
3. MARKET OVERVIEW
Understanding the Current State of The Market and its Prospects
- MARKET SIZE: HISTORICAL DATA (2012–2025) AND FORECAST (2026–2035)
- CONSUMPTION BY COUNTRY: HISTORICAL DATA (2012–2025) AND FORECAST (2026–2035)
- MARKET FORECAST TO 2035
4. MOST PROMISING PRODUCTS FOR DIVERSIFICATION
Finding New Products to Diversify Your Business
- TOP PRODUCTS TO DIVERSIFY YOUR BUSINESS
- BEST-SELLING PRODUCTS
- MOST CONSUMED PRODUCTS
- MOST TRADED PRODUCTS
- MOST PROFITABLE PRODUCTS FOR EXPORT
5. MOST PROMISING SUPPLYING COUNTRIES
Choosing the Best Countries to Establish Your Sustainable Supply Chain
- TOP COUNTRIES TO SOURCE YOUR PRODUCT
- TOP PRODUCING COUNTRIES
- TOP EXPORTING COUNTRIES
- LOW-COST EXPORTING COUNTRIES
6. MOST PROMISING OVERSEAS MARKETS
Choosing the Best Countries to Boost Your Export
- TOP OVERSEAS MARKETS FOR EXPORTING YOUR PRODUCT
- TOP CONSUMING MARKETS
- UNSATURATED MARKETS
- TOP IMPORTING MARKETS
- MOST PROFITABLE MARKETS
7. PRODUCTION
The Latest Trends and Insights into The Industry
- PRODUCTION VOLUME AND VALUE: HISTORICAL DATA (2012–2025) AND FORECAST (2026–2035)
- PRODUCTION BY COUNTRY: HISTORICAL DATA (2012–2025) AND FORECAST (2026–2035)
8. IMPORTS
The Largest Import Supplying Countries
- IMPORTS: HISTORICAL DATA (2012–2025) AND FORECAST (2026–2035)
- IMPORTS BY COUNTRY: HISTORICAL DATA (2012–2025) AND FORECAST (2026–2035)
- IMPORT PRICES BY COUNTRY: HISTORICAL DATA (2012–2025) AND FORECAST (2026–2035)
9. EXPORTS
The Largest Destinations for Exports
- EXPORTS: HISTORICAL DATA (2012–2025) AND FORECAST (2026–2035)
- EXPORTS BY COUNTRY: HISTORICAL DATA (2012–2025) AND FORECAST (2026–2035)
- EXPORT PRICES BY COUNTRY: HISTORICAL DATA (2012–2025) AND FORECAST (2026–2035)
10. PROFILES OF MAJOR PRODUCERS
The Largest Producers on The Market and Their Profiles
-
11. COUNTRY PROFILES
The Largest Markets And Their Profiles
This Chapter is Available Only for the Professional Edition PRO- 11.1United States
- Market Size
- Production
- Imports
- Exports
- 11.2China
- Market Size
- Production
- Imports
- Exports
- 11.3Japan
- Market Size
- Production
- Imports
- Exports
- 11.4Germany
- Market Size
- Production
- Imports
- Exports
- 11.5United Kingdom
- Market Size
- Production
- Imports
- Exports
- 11.6France
- Market Size
- Production
- Imports
- Exports
- 11.7Brazil
- Market Size
- Production
- Imports
- Exports
- 11.8Italy
- Market Size
- Production
- Imports
- Exports
- 11.9Russian Federation
- Market Size
- Production
- Imports
- Exports
- 11.10India
- Market Size
- Production
- Imports
- Exports
- 11.11Canada
- Market Size
- Production
- Imports
- Exports
- 11.12Australia
- Market Size
- Production
- Imports
- Exports
- 11.13Republic of Korea
- Market Size
- Production
- Imports
- Exports
- 11.14Spain
- Market Size
- Production
- Imports
- Exports
- 11.15Mexico
- Market Size
- Production
- Imports
- Exports
- 11.16Indonesia
- Market Size
- Production
- Imports
- Exports
- 11.17Netherlands
- Market Size
- Production
- Imports
- Exports
- 11.18Turkey
- Market Size
- Production
- Imports
- Exports
- 11.19Saudi Arabia
- Market Size
- Production
- Imports
- Exports
- 11.20Switzerland
- Market Size
- Production
- Imports
- Exports
- 11.21Sweden
- Market Size
- Production
- Imports
- Exports
- 11.22Nigeria
- Market Size
- Production
- Imports
- Exports
- 11.23Poland
- Market Size
- Production
- Imports
- Exports
- 11.24Belgium
- Market Size
- Production
- Imports
- Exports
- 11.25Argentina
- Market Size
- Production
- Imports
- Exports
- 11.26Norway
- Market Size
- Production
- Imports
- Exports
- 11.27Austria
- Market Size
- Production
- Imports
- Exports
- 11.28Thailand
- Market Size
- Production
- Imports
- Exports
- 11.29United Arab Emirates
- Market Size
- Production
- Imports
- Exports
- 11.30Colombia
- Market Size
- Production
- Imports
- Exports
- 11.31Denmark
- Market Size
- Production
- Imports
- Exports
- 11.32South Africa
- Market Size
- Production
- Imports
- Exports
- 11.33Malaysia
- Market Size
- Production
- Imports
- Exports
- 11.34Israel
- Market Size
- Production
- Imports
- Exports
- 11.35Singapore
- Market Size
- Production
- Imports
- Exports
- 11.36Egypt
- Market Size
- Production
- Imports
- Exports
- 11.37Philippines
- Market Size
- Production
- Imports
- Exports
- 11.38Finland
- Market Size
- Production
- Imports
- Exports
- 11.39Chile
- Market Size
- Production
- Imports
- Exports
- 11.40Ireland
- Market Size
- Production
- Imports
- Exports
- 11.41Pakistan
- Market Size
- Production
- Imports
- Exports
- 11.42Greece
- Market Size
- Production
- Imports
- Exports
- 11.43Portugal
- Market Size
- Production
- Imports
- Exports
- 11.44Kazakhstan
- Market Size
- Production
- Imports
- Exports
- 11.45Algeria
- Market Size
- Production
- Imports
- Exports
- 11.46Czech Republic
- Market Size
- Production
- Imports
- Exports
- 11.47Qatar
- Market Size
- Production
- Imports
- Exports
- 11.48Peru
- Market Size
- Production
- Imports
- Exports
- 11.49Romania
- Market Size
- Production
- Imports
- Exports
- 11.50Vietnam
- Market Size
- Production
- Imports
- Exports
LIST OF TABLES
- Key Findings In 2025
- Market Volume, In Physical Terms: Historical Data (2012–2025) and Forecast (2026–2035)
- Market Value: Historical Data (2012–2025) and Forecast (2026–2035)
- Per Capita Consumption, by Country, 2022–2025
- Production, In Physical Terms, By Country: Historical Data (2012–2025) and Forecast (2026–2035)
- Imports, In Physical Terms, By Country: Historical Data (2012–2025) and Forecast (2026–2035)
- Imports, In Value Terms, By Country: Historical Data (2012–2025) and Forecast (2026–2035)
- Import Prices, By Country: Historical Data (2012–2025) and Forecast (2026–2035)
- Exports, In Physical Terms, By Country: Historical Data (2012–2025) and Forecast (2026–2035)
- Exports, In Value Terms, By Country: Historical Data (2012–2025) and Forecast (2026–2035)
- Export Prices, By Country: Historical Data (2012–2025) and Forecast (2026–2035)
LIST OF FIGURES
- Market Volume, In Physical Terms: Historical Data (2012–2025) and Forecast (2026–2035)
- Market Value: Historical Data (2012–2025) and Forecast (2026–2035)
- Consumption, by Country, 2025
- Market Volume Forecast to 2035
- Market Value Forecast to 2035
- Market Size and Growth, By Product
- Average Per Capita Consumption, By Product
- Exports and Growth, By Product
- Export Prices and Growth, By Product
- Production Volume and Growth
- Exports and Growth
- Export Prices and Growth
- Market Size and Growth
- Per Capita Consumption
- Imports and Growth
- Import Prices
- Production, In Physical Terms: Historical Data (2012–2025) and Forecast (2026–2035)
- Production, In Value Terms: Historical Data (2012–2025) and Forecast (2026–2035)
- Production, by Country, 2025
- Production, In Physical Terms, by Country: Historical Data (2012–2025) and Forecast (2026–2035)
- Imports, In Physical Terms: Historical Data (2012–2025) and Forecast (2026–2035)
- Imports, In Value Terms: Historical Data (2012–2025) and Forecast (2026–2035)
- Imports, In Physical Terms, By Country, 2025
- Imports, In Physical Terms, By Country: Historical Data (2012–2025) and Forecast (2026–2035)
- Imports, In Value Terms, By Country: Historical Data (2012–2025) and Forecast (2026–2035)
- Import Prices, By Country: Historical Data (2012–2025) and Forecast (2026–2035)
- Exports, In Physical Terms: Historical Data (2012–2025) and Forecast (2026–2035)
- Exports, In Value Terms: Historical Data (2012–2025) and Forecast (2026–2035)
- Exports, In Physical Terms, By Country, 2025
- Exports, In Physical Terms, By Country: Historical Data (2012–2025) and Forecast (2026–2035)
- Exports, In Value Terms, By Country: Historical Data (2012–2025) and Forecast (2026–2035)
- Export Prices, By Country: Historical Data (2012–2025) and Forecast (2026–2035)
Recommended posts
Free Data: Aluminium Alloy Wire - World
Instant access. No credit card needed.


