
Australia - Electrical Musical Or Keyboard Instruments - Market Analysis, Forecast, Size, Trends And Insights
Get instant access to more than 2 million reports, dashboards, and datasets on the IndexBox Platform.
View PricingAustralian Imports of Musical Instruments Reach $70 Million in 2023
Australia Electrical Musical Instrument Imports
In 2023, overseas purchases of electrical musical or keyboard instruments decreased by -28.4% to 212K units, falling for the second year in a row after four years of growth. Overall, imports continue to indicate a relatively flat trend pattern. The most prominent rate of growth was recorded in 2016 when imports increased by 28% against the previous year. Imports peaked at 360K units in 2021; however, from 2022 to 2023, imports failed to regain momentum.
In value terms, electrical musical instrument imports dropped sharply to $70M (IndexBox estimates) in 2023. Over the period under review, imports, however, recorded tangible growth. The most prominent rate of growth was recorded in 2021 when imports increased by 40%. Imports peaked at $96M in 2022, and then declined sharply in the following year.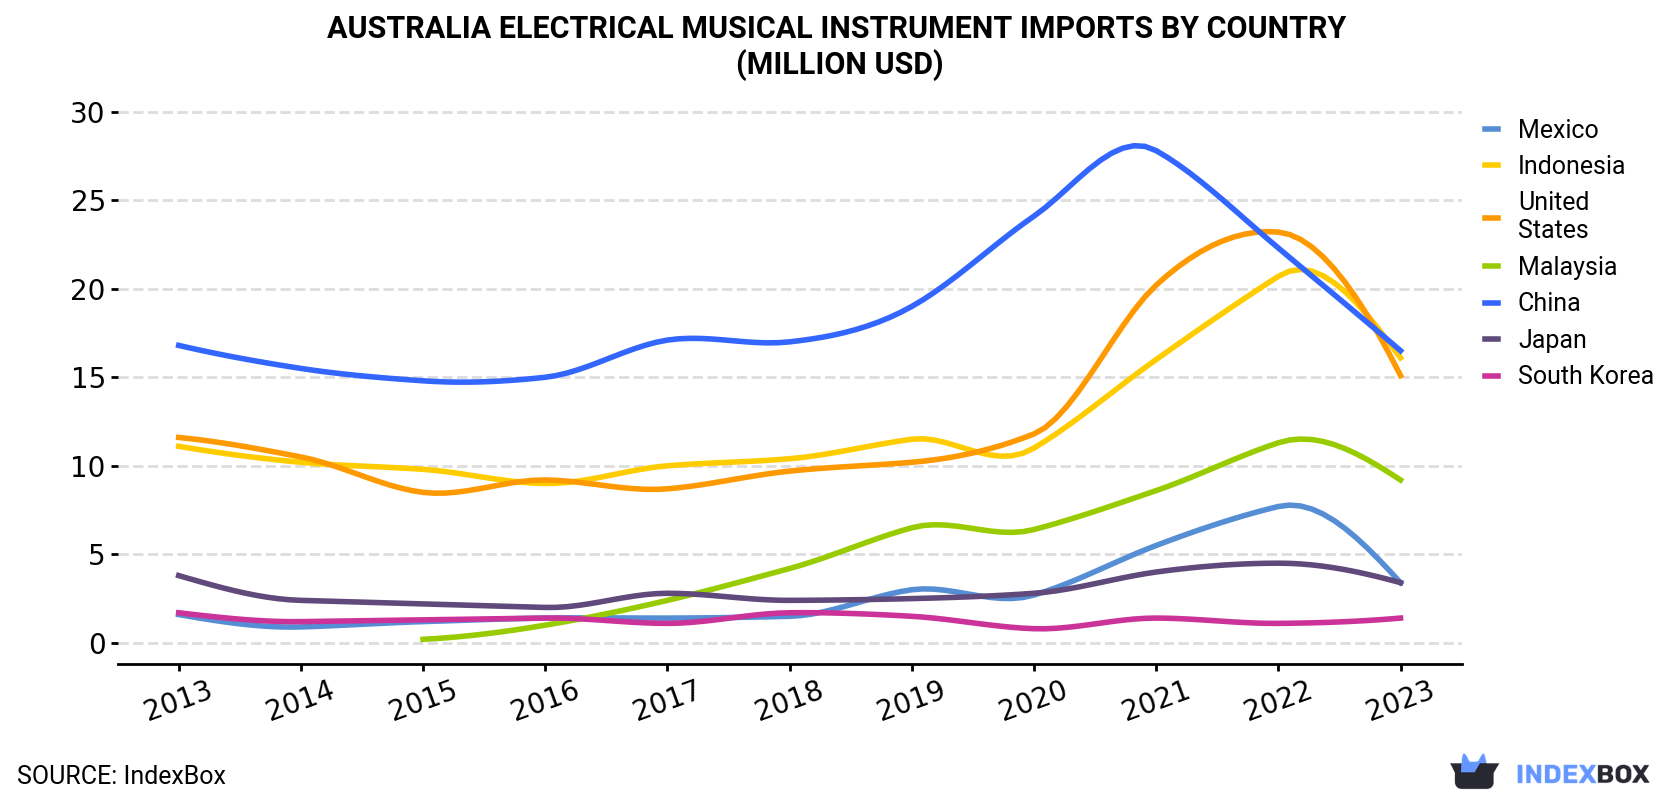
| COUNTRY | Import Value of Electrical Musical Instrument in Australia (million USD) | ||||||||||
|---|---|---|---|---|---|---|---|---|---|---|---|
| 2013 | 2014 | 2015 | 2016 | 2017 | 2018 | 2019 | 2020 | 2021 | 2022 | 2023 | |
| China | 16.8 | 15.5 | 14.8 | 15.0 | 17.1 | 17.0 | 19.0 | 24.1 | 27.8 | 22.3 | 16.5 |
| Indonesia | 11.1 | 10.2 | 9.8 | 9.0 | 10.0 | 10.4 | 11.5 | 11.0 | 16.0 | 20.7 | 16.1 |
| United States | 11.6 | 10.5 | 8.5 | 9.2 | 8.7 | 9.7 | 10.2 | 11.8 | 20.2 | 23.2 | 15.1 |
| Malaysia | N/A | N/A | 0.2 | 1.0 | 2.4 | 4.2 | 6.5 | 6.4 | 8.6 | 11.3 | 9.2 |
| Mexico | 1.6 | 0.9 | 1.2 | 1.4 | 1.4 | 1.5 | 3.0 | 2.7 | 5.5 | 7.7 | 3.4 |
| Japan | 3.8 | 2.4 | 2.2 | 2.0 | 2.8 | 2.4 | 2.5 | 2.8 | 4.0 | 4.5 | 3.4 |
| South Korea | 1.7 | 1.2 | 1.3 | 1.4 | 1.1 | 1.7 | 1.5 | 0.8 | 1.4 | 1.1 | 1.4 |
| Others | 2.8 | 2.7 | 2.5 | 3.0 | 2.9 | 4.1 | 3.4 | 3.4 | 4.9 | 4.7 | 5.0 |
| Total | 49.4 | 43.5 | 40.6 | 42.0 | 46.4 | 51.1 | 57.5 | 63.0 | 88.5 | 95.6 | 70.0 |
Imports by Country
In 2023, China (128K units) constituted the largest electrical musical instrument supplier to Australia, accounting for a 60% share of total imports. Moreover, electrical musical instrument imports from China exceeded the figures recorded by the second-largest supplier, Indonesia (32K units), fourfold. The third position in this ranking was taken by Malaysia (16K units), with a 7.7% share.
From 2013 to 2023, the average annual growth rate of volume from China totaled -1.8%. The remaining supplying countries recorded the following average annual rates of imports growth: Indonesia (+1.0% per year) and Malaysia (+99.2% per year).
In value terms, the largest electrical musical instrument suppliers to Australia were China ($17M), Indonesia ($16M) and the United States ($15M), with a combined 68% share of total imports. Malaysia, Mexico, Japan and South Korea lagged somewhat behind, together accounting for a further 25%.
Malaysia, with a CAGR of +95.6%, saw the highest rates of growth with regard to the value of imports, in terms of the main suppliers over the period under review, while purchases for the other leaders experienced more modest paces of growth.
Imports by Type
Non-keyboard electrical musical instruments (108K units) and keyboard electrical musical instruments, other than accordions (102K units) were the main products of electrical musical instrument imports to Australia.
From 2013 to 2023, the most notable rate of growth in terms of purchases, amongst the major product types, was attained by keyboard electrical musical instruments, other than accordions (with a CAGR of +0.4%).
In value terms, non-keyboard electrical musical instruments ($40M) and keyboard electrical musical instruments, other than accordions ($30M) appeared to be the most imported types of electrical musical or keyboard instruments in Australia.
Import Prices by Country
In 2023, the electrical musical instrument price stood at $331 per unit (CIF, Australia), increasing by 2.3% against the previous year. Over the period under review, import price indicated a noticeable expansion from 2013 to 2023: its price increased at an average annual rate of +3.8% over the last decade. The trend pattern, however, indicated some noticeable fluctuations being recorded throughout the analyzed period. Based on 2023 figures, electrical musical instrument import price increased by +74.0% against 2020 indices. The pace of growth appeared the most rapid in 2022 when the average import price increased by 32%. The import price peaked in 2023 and is expected to retain growth in the near future.
Prices varied noticeably by country of origin: amid the top importers, the country with the highest price was the United States ($1,395 per unit), while the price for China ($129 per unit) was amongst the lowest.
From 2013 to 2023, the most notable rate of growth in terms of prices was attained by Mexico (+6.6%), while the prices for the other major suppliers experienced more modest paces of growth.
This report provides an in-depth analysis of the electrical musical instrument market in Australia. Within it, you will discover the latest data on market trends and opportunities by country, consumption, production and price developments, as well as the global trade (imports and exports). The forecast exhibits the market prospects through 2030.
Product coverage:
- Prodcom 32201400 - Musical or keyboard instruments, the sound of which is produced, or must be amplified, electrically
Country coverage:
- Australia
Data coverage:
- Market volume and value
- Per Capita consumption
- Forecast of the market dynamics in the medium term
- Trade (exports and imports) in Australia
- Export and import prices
- Market trends, drivers and restraints
- Key market players and their profiles
Reasons to buy this report:
- Take advantage of the latest data
- Find deeper insights into current market developments
- Discover vital success factors affecting the market
This report is designed for manufacturers, distributors, importers, and wholesalers, as well as for investors, consultants and advisors.
In this report, you can find information that helps you to make informed decisions on the following issues:
- How to diversify your business and benefit from new market opportunities
- How to load your idle production capacity
- How to boost your sales on overseas markets
- How to increase your profit margins
- How to make your supply chain more sustainable
- How to reduce your production and supply chain costs
- How to outsource production to other countries
- How to prepare your business for global expansion
While doing this research, we combine the accumulated expertise of our analysts and the capabilities of artificial intelligence. The AI-based platform, developed by our data scientists, constitutes the key working tool for business analysts, empowering them to discover deep insights and ideas from the marketing data.
-
1. INTRODUCTION
Making Data-Driven Decisions to Grow Your Business
- REPORT DESCRIPTION
- RESEARCH METHODOLOGY AND AI PLATFORM
- DATA-DRIVEN DECISIONS FOR YOUR BUSINESS
- GLOSSARY AND SPECIFIC TERMS
-
2. EXECUTIVE SUMMARY
A Quick Overview of Market Performance
- KEY FINDINGS
- MARKET TRENDS This Chapter is Available Only for the Professional Edition PRO
-
3. MARKET OVERVIEW
Understanding the Current State of The Market and Its Prospects
- MARKET SIZE
- MARKET STRUCTURE
- TRADE BALANCE
- PER CAPITA CONSUMPTION
- MARKET FORECAST TO 2030
-
4. MOST PROMISING PRODUCT
Finding New Products to Diversify Your Business
This Chapter is Available Only for the Professional Edition PRO- TOP PRODUCTS TO DIVERSIFY YOUR BUSINESS
- BEST-SELLING PRODUCTS
- MOST CONSUMED PRODUCT
- MOST TRADED PRODUCT
- MOST PROFITABLE PRODUCT FOR EXPORT
-
5. MOST PROMISING SUPPLYING COUNTRIES
Choosing the Best Countries to Establish Your Sustainable Supply Chain
This Chapter is Available Only for the Professional Edition PRO- TOP COUNTRIES TO SOURCE YOUR PRODUCT
- TOP PRODUCING COUNTRIES
- TOP EXPORTING COUNTRIES
- LOW-COST EXPORTING COUNTRIES
-
6. MOST PROMISING OVERSEAS MARKETS
Choosing the Best Countries to Boost Your Exports
This Chapter is Available Only for the Professional Edition PRO- TOP OVERSEAS MARKETS FOR EXPORTING YOUR PRODUCT
- TOP CONSUMING MARKETS
- UNSATURATED MARKETS
- TOP IMPORTING MARKETS
- MOST PROFITABLE MARKETS
7. PRODUCTION
The Latest Trends and Insights into The Industry
- PRODUCTION VOLUME AND VALUE
8. IMPORTS
The Largest Import Supplying Countries
- IMPORTS FROM 2012–2023
- IMPORTS BY COUNTRY
- IMPORT PRICES BY COUNTRY
9. EXPORTS
The Largest Destinations for Exports
- EXPORTS FROM 2012–2023
- EXPORTS BY COUNTRY
- EXPORT PRICES BY COUNTRY
-
10. PROFILES OF MAJOR PRODUCERS
The Largest Producers on The Market and Their Profiles
This Chapter is Available Only for the Professional Edition PRO -
LIST OF TABLES
- Key Findings In 2023
- Market Volume, In Physical Terms, 2012–2023
- Market Value, 2012–2023
- Per Capita Consumption In 2012-2023
- Imports, In Physical Terms, By Country, 2012–2023
- Imports, In Value Terms, By Country, 2012–2023
- Import Prices, By Country Of Origin, 2012–2023
- Exports, In Physical Terms, By Country, 2012–2023
- Exports, In Value Terms, By Country, 2012–2023
- Export Prices, By Country Of Destination, 2012–2023
-
LIST OF FIGURES
- Market Volume, In Physical Terms, 2012–2023
- Market Value, 2012–2023
- Market Structure – Domestic Supply vs. Imports, In Physical Terms, 2012-2023
- Market Structure – Domestic Supply vs. Imports, In Value Terms, 2012-2023
- Trade Balance, In Physical Terms, 2012-2023
- Trade Balance, In Value Terms, 2012-2023
- Per Capita Consumption, 2012-2023
- Market Volume Forecast to 2030
- Market Value Forecast to 2030
- Products: Market Size And Growth, By Type
- Products: Average Per Capita Consumption, By Type
- Products: Exports And Growth, By Type
- Products: Export Prices And Growth, By Type
- Production Volume And Growth
- Exports And Growth
- Export Prices And Growth
- Market Size And Growth
- Per Capita Consumption
- Imports And Growth
- Import Prices
- Production, In Physical Terms, 2012–2023
- Production, In Value Terms, 2012–2023
- Imports, In Physical Terms, 2012–2023
- Imports, In Value Terms, 2012–2023
- Imports, In Physical Terms, By Country, 2023
- Imports, In Physical Terms, By Country, 2012–2023
- Imports, In Value Terms, By Country, 2012–2023
- Import Prices, By Country Of Origin, 2012–2023
- Exports, In Physical Terms, 2012–2023
- Exports, In Value Terms, 2012–2023
- Exports, In Physical Terms, By Country, 2023
- Exports, In Physical Terms, By Country, 2012–2023
- Exports, In Value Terms, By Country, 2012–2023
- Export Prices, By Country Of Destination, 2012–2023


