Australia - Cereals - Market Analysis, Forecast, Size, Trends and Insights
Get instant access to more than 2 million reports, dashboards, and datasets on the IndexBox Platform.
View PricingAustralia's Export of Breakfast Grains Decreases to $12.6 Billion in 2023
Australia Cereals Exports
In 2023, shipments abroad of cereals increased by 2.4% to 41M tons, rising for the fourth year in a row after two years of decline. Over the period under review, exports continue to indicate resilient growth. The most prominent rate of growth was recorded in 2021 with an increase of 142% against the previous year. The exports peaked in 2023 and are expected to retain growth in the near future.
In value terms, cereal exports declined to $12.6B (IndexBox estimates) in 2023. In general, exports enjoyed a prominent expansion. The most prominent rate of growth was recorded in 2021 with an increase of 162% against the previous year. Over the period under review, the exports hit record highs at $13.3B in 2022, and then contracted in the following year.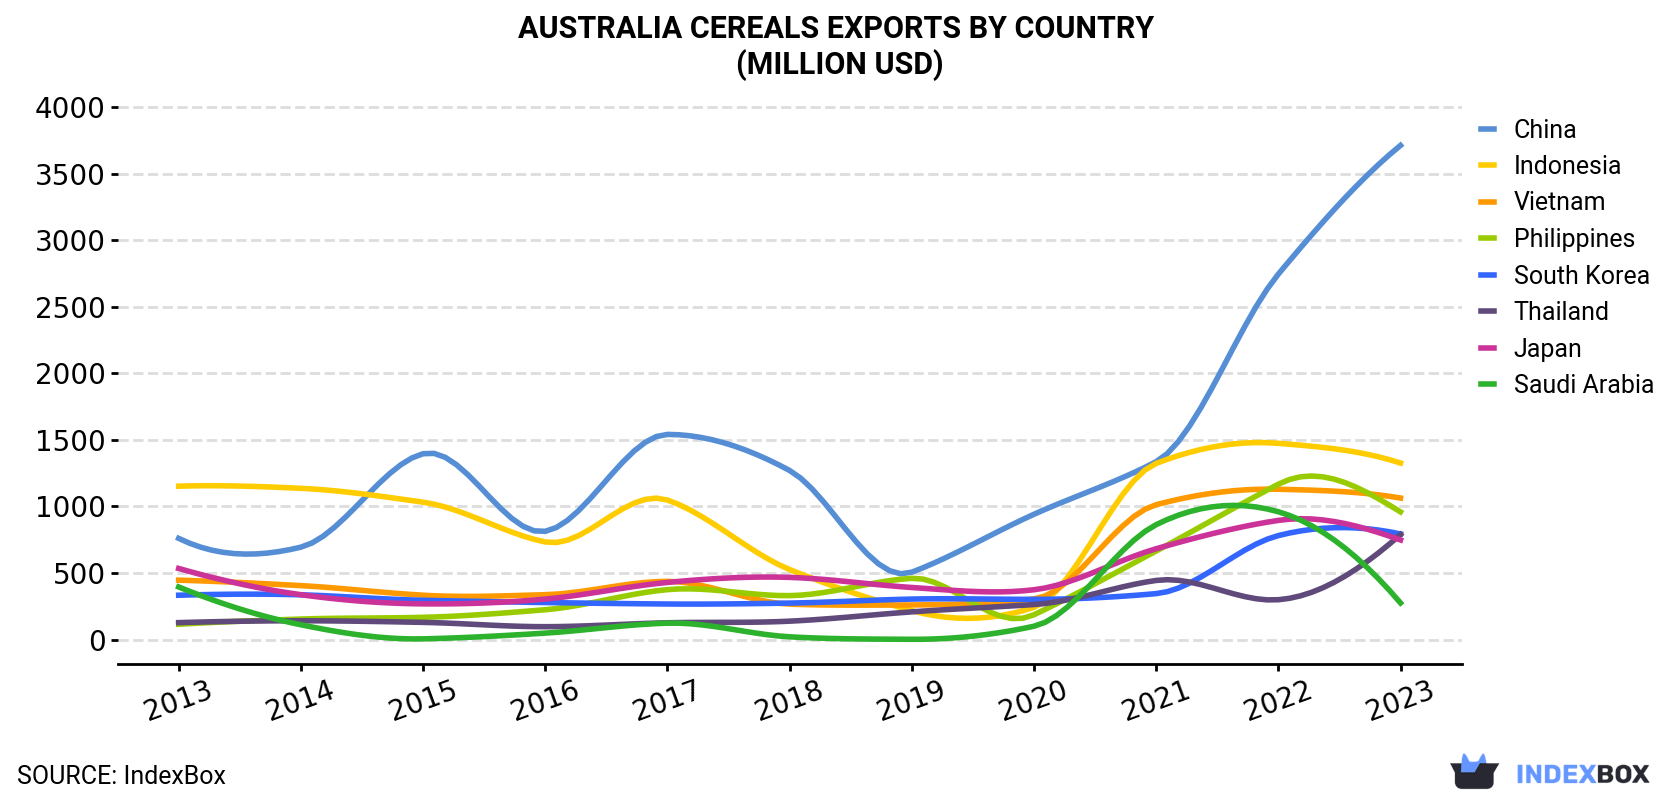
| COUNTRY | Export Value of Cereals in Australia (million USD) | ||||||||||
|---|---|---|---|---|---|---|---|---|---|---|---|
| 2013 | 2014 | 2015 | 2016 | 2017 | 2018 | 2019 | 2020 | 2021 | 2022 | 2023 | |
| China | 760 | 694 | 1,396 | 813 | 1,541 | 1,270 | 506 | 941 | 1,336 | 2,745 | 3,712 |
| Indonesia | 1,152 | 1,136 | 1,032 | 733 | 1,048 | 526 | 217 | 242 | 1,323 | 1,474 | 1,326 |
| Vietnam | 446 | 405 | 333 | 337 | 437 | 266 | 260 | 305 | 1,013 | 1,129 | 1,063 |
| Philippines | 115 | 154 | 167 | 224 | 375 | 330 | 460 | 186 | 665 | 1,167 | 959 |
| South Korea | 333 | 336 | 295 | 278 | 267 | 274 | 304 | 302 | 345 | 781 | 793 |
| Thailand | 127 | 141 | 129 | 96.6 | 126 | 138 | 208 | 263 | 444 | 299 | 789 |
| Japan | 534 | 337 | 268 | 304 | 429 | 467 | 391 | 374 | 682 | 895 | 748 |
| Saudi Arabia | 395 | 111 | 5.2 | 48.3 | 123 | 20.5 | 1.8 | 100 | 863 | 960 | 275 |
| Others | 3,817 | 3,764 | 2,504 | 2,108 | 2,030 | 1,288 | 921 | 999 | 3,073 | 3,835 | 2,926 |
| Total | 7,678 | 7,076 | 6,129 | 4,941 | 6,376 | 4,579 | 3,268 | 3,712 | 9,744 | 13,284 | 12,590 |
Exports by Country
China (12M tons) was the main destination for cereal exports from Australia, with a 29% share of total exports. Moreover, cereal exports to China exceeded the volume sent to the second major destination, Indonesia (4.3M tons), threefold. The third position in this ranking was taken by Vietnam (3.4M tons), with an 8.4% share.
From 2013 to 2023, the average annual growth rate of volume to China totaled +17.3%. Exports to the other major destinations recorded the following average annual rates of exports growth: Indonesia (+1.7% per year) and Vietnam (+9.6% per year).
In value terms, China ($3.7B) remains the key foreign market for cereals exports from Australia, comprising 29% of total exports. The second position in the ranking was taken by Indonesia ($1.3B), with an 11% share of total exports. It was followed by Vietnam, with an 8.4% share.
From 2013 to 2023, the average annual growth rate of value to China amounted to +17.2%. Exports to the other major destinations recorded the following average annual rates of exports growth: Indonesia (+1.4% per year) and Vietnam (+9.1% per year).
Exports by Type
Wheat (29M tons) was the largest type of cereals exported from Australia, accounting for a 72% share of total exports. Moreover, wheat exceeded the volume of the second product type, barley (8.3M tons), fourfold. Sorghum (2.4M tons) ranked third in terms of total exports with a 6% share.
From 2013 to 2023, the average annual rate of growth in terms of the volume of wheat exports totaled +5.0%. With regard to the other exported products, the following average annual rates of growth were recorded: barley (+4.9% per year) and sorghum (+11.8% per year).
In value terms, wheat ($9.3B) remains the largest type of cereals exported from Australia, comprising 74% of total exports. The second position in the ranking was held by barley ($2.3B), with an 18% share of total exports. It was followed by sorghum, with a 6.7% share.
From 2013 to 2023, the average annual growth rate of the value of wheat exports amounted to +4.7%. With regard to the other exported products, the following average annual rates of growth were recorded: barley (+4.3% per year) and sorghum (+12.2% per year).
Export Prices by Country
In 2023, the cereals price amounted to $310 per ton (FOB, Australia), with a decrease of -7.4% against the previous year. In general, the export price saw a relatively flat trend pattern. The most prominent rate of growth was recorded in 2022 when the average export price increased by 25%. As a result, the export price attained the peak level of $335 per ton, and then contracted in the following year.
Average prices varied noticeably for the major external markets. In 2023, amid the top suppliers, the countries with the highest prices were South Korea ($330 per ton) and Iraq ($324 per ton), while the average price for exports to Saudi Arabia ($265 per ton) and Japan ($296 per ton) were amongst the lowest.
From 2013 to 2023, the most notable rate of growth in terms of prices was recorded for supplies to Iraq (-0.1%), while the prices for the other major destinations experienced a decline.
This report provides an in-depth analysis of the cereal market in Australia. Within it, you will discover the latest data on market trends and opportunities by country, consumption, production and price developments, as well as the global trade (imports and exports). The forecast exhibits the market prospects through 2030.
Product coverage:
- FCL 108 - Cereals, nes
- FCL 103 - Mixed grain
- FCL 92 - Quinoa
- FCL 15 - Wheat
- FCL 71 - Rye
- FCL 44 - Barley
- FCL 75 - Oats
- FCL 56 - Maize
- FCL 27 - Rice, paddy
- FCL 83 - Sorghum
- FCL 89 - Buckwheat
- FCL 101 - Canary seed
- FCL 94 - Fonio
- FCL 97 - Triticale
- FCL 79 - Millet
Country coverage:
- Australia
Data coverage:
- Market volume and value
- Per Capita consumption
- Forecast of the market dynamics in the medium term
- Trade (exports and imports) in Australia
- Export and import prices
- Market trends, drivers and restraints
- Key market players and their profiles
Reasons to buy this report:
- Take advantage of the latest data
- Find deeper insights into current market developments
- Discover vital success factors affecting the market
This report is designed for manufacturers, distributors, importers, and wholesalers, as well as for investors, consultants and advisors.
In this report, you can find information that helps you to make informed decisions on the following issues:
- How to diversify your business and benefit from new market opportunities
- How to load your idle production capacity
- How to boost your sales on overseas markets
- How to increase your profit margins
- How to make your supply chain more sustainable
- How to reduce your production and supply chain costs
- How to outsource production to other countries
- How to prepare your business for global expansion
While doing this research, we combine the accumulated expertise of our analysts and the capabilities of artificial intelligence. The AI-based platform, developed by our data scientists, constitutes the key working tool for business analysts, empowering them to discover deep insights and ideas from the marketing data.
-
1. INTRODUCTION
Making Data-Driven Decisions to Grow Your Business
- REPORT DESCRIPTION
- RESEARCH METHODOLOGY AND AI PLATFORM
- DATA-DRIVEN DECISIONS FOR YOUR BUSINESS
- GLOSSARY AND SPECIFIC TERMS
-
2. EXECUTIVE SUMMARY
A Quick Overview of Market Performance
- KEY FINDINGS
- MARKET TRENDS This Chapter is Available Only for the Professional Edition PRO
-
3. MARKET OVERVIEW
Understanding the Current State of The Market and Its Prospects
- MARKET SIZE
- MARKET STRUCTURE
- TRADE BALANCE
- PER CAPITA CONSUMPTION
- MARKET FORECAST TO 2030
-
4. MOST PROMISING PRODUCT
Finding New Products to Diversify Your Business
This Chapter is Available Only for the Professional Edition PRO- TOP PRODUCTS TO DIVERSIFY YOUR BUSINESS
- BEST-SELLING PRODUCTS
- MOST CONSUMED PRODUCT
- MOST TRADED PRODUCT
- MOST PROFITABLE PRODUCT FOR EXPORT
-
5. MOST PROMISING SUPPLYING COUNTRIES
Choosing the Best Countries to Establish Your Sustainable Supply Chain
This Chapter is Available Only for the Professional Edition PRO- TOP COUNTRIES TO SOURCE YOUR PRODUCT
- TOP PRODUCING COUNTRIES
- COUNTRIES WITH TOP YIELDS
- TOP EXPORTING COUNTRIES
- LOW-COST EXPORTING COUNTRIES
-
6. MOST PROMISING OVERSEAS MARKETS
Choosing the Best Countries to Boost Your Exports
This Chapter is Available Only for the Professional Edition PRO- TOP OVERSEAS MARKETS FOR EXPORTING YOUR PRODUCT
- TOP CONSUMING MARKETS
- UNSATURATED MARKETS
- TOP IMPORTING MARKETS
- MOST PROFITABLE MARKETS
7. PRODUCTION
The Latest Trends and Insights into The Industry
- PRODUCTION, HARVESTED AREA AND YIELD
8. IMPORTS
The Largest Import Supplying Countries
- IMPORTS FROM 2012–2023
- IMPORTS BY COUNTRY
- IMPORT PRICES BY COUNTRY
9. EXPORTS
The Largest Destinations for Exports
- EXPORTS FROM 2012–2023
- EXPORTS BY COUNTRY
- EXPORT PRICES BY COUNTRY
-
10. PROFILES OF MAJOR PRODUCERS
The Largest Producers on The Market and Their Profiles
This Chapter is Available Only for the Professional Edition PRO -
LIST OF TABLES
- Key Findings In 2023
- Market Volume, In Physical Terms, 2012–2023
- Market Value, 2012–2023
- Per Capita Consumption In 2012-2023
- Imports, In Physical Terms, By Country, 2012–2023
- Imports, In Value Terms, By Country, 2012–2023
- Import Prices, By Country Of Origin, 2012–2023
- Exports, In Physical Terms, By Country, 2012–2023
- Exports, In Value Terms, By Country, 2012–2023
- Export Prices, By Country Of Destination, 2012–2023
-
LIST OF FIGURES
- Market Volume, In Physical Terms, 2012–2023
- Market Value, 2012–2023
- Market Structure – Domestic Supply vs. Imports, In Physical Terms, 2012-2023
- Market Structure – Domestic Supply vs. Imports, In Value Terms, 2012-2023
- Trade Balance, In Physical Terms, 2012-2023
- Trade Balance, In Value Terms, 2012-2023
- Per Capita Consumption, 2012-2023
- Market Volume Forecast to 2030
- Market Value Forecast to 2030
- Products: Market Size And Growth, By Type
- Products: Average Per Capita Consumption, By Type
- Products: Exports And Growth, By Type
- Products: Export Prices And Growth, By Type
- Production Volume And Growth
- Yield And Growth
- Exports And Growth
- Export Prices And Growth
- Market Size And Growth
- Per Capita Consumption
- Imports And Growth
- Import Prices
- Production, In Physical Terms, 2012–2023
- Production, In Value Terms, 2012–2023
- Area Harvested, 2012–2023
- Yield, 2012–2023
- Imports, In Physical Terms, 2012–2023
- Imports, In Value Terms, 2012–2023
- Imports, In Physical Terms, By Country, 2023
- Imports, In Physical Terms, By Country, 2012–2023
- Imports, In Value Terms, By Country, 2012–2023
- Import Prices, By Country Of Origin, 2012–2023
- Exports, In Physical Terms, 2012–2023
- Exports, In Value Terms, 2012–2023
- Exports, In Physical Terms, By Country, 2023
- Exports, In Physical Terms, By Country, 2012–2023
- Exports, In Value Terms, By Country, 2012–2023
- Export Prices, By Country Of Destination, 2012–2023


