U.S. - Vegetable - Market Analysis, Forecast, Size, Trends and Insights
Get instant access to more than 2 million reports, dashboards, and datasets on the IndexBox Platform.
View PricingWhat's the Trend in U.S. Vegetable Market?
The U.S. vegetable market is seeing a trend towards healthy and organic options. Consumers are becoming more aware of the importance of eating healthy, and are willing to pay more for vegetables that are free of pesticides and other harmful chemicals. This trend is good news for farmers who are able to sell their vegetables at a higher price, but it means that consumers need to be prepared to spend more on their grocery bills.
In 2021, after three years of growth, there was decline in the U.S. vegetable market, when its value decreased by -3.1% to $60B. Overall, consumption saw a relatively flat trend pattern. As a result, consumption attained the peak level of $62.6B. From 2015 to 2021, the growth of the market remained at a lower figure.
The Trend in U.S. Vegetable Consumption
There's no denying that vegetables are good for you. They're packed with nutrients and fiber, and they're low in calories. But despite all of these health benefits, many Americans still don't consume enough vegetables. In fact, according to the CDC, only about one-third of adults eat the recommended amount of vegetables each day.
So what's the trend in U.S. vegetable consumption? Are Americans eating more or less vegetables than they were in the past?
It turns out that the answer is a little bit of both. According to the USDA, total vegetable consumption in the U.S. has actually declined slightly in recent years. However, this decline is due mostly to a decrease in processed vegetable consumption, such as canned or frozen vegetables. Fresh vegetable consumption, on the other hand, has actually increased slightly during this same time period.
This trend is likely due to a combination of factors, including an increased focus on healthy eating and an increase in the availability of fresh vegetables at supermarkets and farmers markets. Whatever the reasons, it's clear that more Americans are making an effort to incorporate fresh vegetables into their diets.
Vegetables are an important part of a healthy diet, and the USDA recommends that adults consume 2-3 cups of vegetables per day. However, many Americans fall short of this goal, consuming an average of just 1.6 cups of vegetables per day. The good news is that there is room for improvement, and the trend in U.S. vegetable production suggests that consumers are becoming more interested in eating their veggies.
The Future of the U.S. Vegetable Market
As we move into the future, the U.S. vegetable market is likely to continue to trend upward. This is due to a number of factors, including a growing population and an increased awareness of the importance of healthy eating.
There are a few trends that are particularly worth watching in the coming years. First, we're likely to see more growth in organic and locally grown vegetables. Consumers are becoming more interested in knowing where their food comes from and supporting sustainable farming practices.
We're also likely to see more demand for convenience foods, such as pre-cut vegetables and ready-to-eat meals. As our lives get busier, we'll increasingly value products that save us time and effort in the kitchen.
Finally, we can expect to see more innovative vegetable products hitting the market. With advances in food technology, we're likely to see new and exciting ways to enjoy our veggies!
Vegetable Production in the United States
In 2021, after four years of decline, there was growth in production of vegetables, when its volume increased by 0.1% to 48M tons. Over the period under review, production, however, showed a relatively flat trend pattern. The pace of growth was the most pronounced in 2014 when the production volume increased by 5%. Vegetable production peaked at 51M tons in 2012; however, from 2013 to 2021, production remained at a lower figure. Vegetable output in the United States indicated a relatively flat trend pattern, which was largely conditioned by a relatively flat trend pattern of the harvested area and a mild expansion in yield figures.
In value terms, vegetable production contracted modestly to $54.1B in 2021.
Exports from the U.S.
Vegetable exports from the United States rose significantly to 2.6M tons in 2021, surging by 7.5% against 2020 figures. In general, exports continue to indicate a relatively flat trend pattern. As a result, the exports reached the peak and are likely to continue growth in the immediate term.
In value terms, vegetable exports expanded markedly to $3.3B (IndexBox estimates) in 2021. The total export value increased at an average annual rate of +2.5% over the period from 2012 to 2021; the trend pattern remained consistent, with only minor fluctuations being observed throughout the analyzed period. The pace of growth appeared the most rapid in 2013 with an increase of 11% against the previous year. Over the period under review, the exports attained the maximum in 2021 and are expected to retain growth in years to come.
Vegetable Imports into the United States
After nine years of growth, supplies from abroad of vegetables decreased by -0.7% to 8M tons in 2021. The total import volume increased at an average annual rate of +4.2% over the period from 2012 to 2021; however, the trend pattern indicated some noticeable fluctuations being recorded in certain years. The growth pace was the most rapid in 2016 when imports increased by 11% against the previous year. Imports peaked at 8.1M tons in 2020, and then declined in the following year.
In value terms, vegetable imports reduced to $9.5B (IndexBox estimates) in 2021. The total import value increased at an average annual rate of +5.0% from 2012 to 2021; however, the trend pattern indicated some noticeable fluctuations being recorded throughout the analyzed period. The pace of growth was the most pronounced in 2013 with an increase of 15%. Imports peaked at $10B in 2020, and then reduced in the following year.
Imports by Country
In 2021, Mexico (6M tons) constituted the largest supplier of vegetable to the United States, with a 75% share of total imports. Moreover, vegetable imports from Mexico exceeded the figures recorded by the second-largest supplier, Canada (1.3M tons), fivefold.
From 2012 to 2021, the average annual rate of growth in terms of volume from Mexico amounted to +4.4%. The remaining supplying countries recorded the following average annual rates of imports growth: Canada (+3.5% per year) and Peru (+5.5% per year).
In value terms, Mexico ($6.6B) constituted the largest supplier of vegetable to the United States, comprising 70% of total imports. The second position in the ranking was occupied by Canada ($1.8B), with a 19% share of total imports.
From 2012 to 2021, the average annual rate of growth in terms of value from Mexico stood at +5.2%. The remaining supplying countries recorded the following average annual rates of imports growth: Canada (+6.1% per year) and Peru (+2.1% per year).
Import Prices by Country
In 2021, the average vegetable import price amounted to $1,183 per ton, with a decrease of -4.6% against the previous year. Over the period under review, the import price, however, showed a relatively flat trend pattern. The most prominent rate of growth was recorded in 2013 when the average import price increased by 7.9%. The import price peaked at $1,241 per ton in 2020, and then contracted modestly in the following year.
Average prices varied somewhat amongst the major supplying countries. In 2021, the country with the highest price was Peru ($1,542 per ton), while the price for Mexico ($1,100 per ton) was amongst the lowest.
From 2012 to 2021, the most notable rate of growth in terms of prices was attained by Canada (+2.5%), while the prices for the other major suppliers experienced mixed trend patterns.
Conclusion
It's clear that the trend in the U.S. vegetable market is towards organic, locally sourced produce. This is likely due to a combination of factors, including an increasing awareness of the benefits of organic food and a growing preference for fresh, healthy ingredients. Whatever the reasons, it's good news for farmers and consumers alike. Organic produce is generally more expensive than conventional produce, so farmers who can make the switch to organic production are likely to see a boost in profits. And consumers will have access to healthier, tastier vegetables that were grown using sustainable methods.
Join Us at HANNOVER MESSE 2024
Don’t miss your chance to connect with us directly. Schedule a personal meeting to dive deeper into how solutions.
Hall 002, Stand C10. 22 - 26 April 2024 | Hannover, Germany

This report provides an in-depth analysis of the vegetable market in the U.S.. Within it, you will discover the latest data on market trends and opportunities by country, consumption, production and price developments, as well as the global trade (imports and exports). The forecast exhibits the market prospects through 2030.
Product coverage:
- FCL 116 - Potatoes
- FCL 388 - Tomatoes, fresh
- FCL 402 - Onions, shallots (green)
- FCL 403 - Onions, dry
- FCL 406 - Garlic
- FCL 407 - Leeks and other alliaceous vegetables
- FCL 393 - Cauliflowers and broccoli
- FCL 372 - Lettuce and chicory
- FCL 426 - Carrot
- FCL 397 - Cucumbers and gherkins
- FCL 417 - Peas, green
- FCL 414 - Beans, green
- FCL 423 - String Beans
- FCL 367 - Asparagus
- FCL 399 - Eggplants
- FCL 401 - Chillies and peppers (green)
- FCL 373 - Spinach
- FCL 260 - Olives
- FCL 394 - Pumpkins, squash and gourds
- FCL 463 - Vegetables, Fresh n.e.s.
- FCL 446 - Green Corn (Maize)
- FCL 430 - Okra
- FCL 394 - Pumpkins, squash and gourds
- FCL 378 - Cassava leaves
- FCL 366 - Artichokes
- FCL 260 - Olives
- FCL 358 - Cabbages
- FCL 449 - Mushrooms
- FCL 366 - Artichokes
Country coverage:
- United States
Data coverage:
- Market volume and value
- Per Capita consumption
- Forecast of the market dynamics in the medium term
- Trade (exports and imports) in the U.S.
- Export and import prices
- Market trends, drivers and restraints
- Key market players and their profiles
Reasons to buy this report:
- Take advantage of the latest data
- Find deeper insights into current market developments
- Discover vital success factors affecting the market
This report is designed for manufacturers, distributors, importers, and wholesalers, as well as for investors, consultants and advisors.
In this report, you can find information that helps you to make informed decisions on the following issues:
- How to diversify your business and benefit from new market opportunities
- How to load your idle production capacity
- How to boost your sales on overseas markets
- How to increase your profit margins
- How to make your supply chain more sustainable
- How to reduce your production and supply chain costs
- How to outsource production to other countries
- How to prepare your business for global expansion
While doing this research, we combine the accumulated expertise of our analysts and the capabilities of artificial intelligence. The AI-based platform, developed by our data scientists, constitutes the key working tool for business analysts, empowering them to discover deep insights and ideas from the marketing data.
-
1. INTRODUCTION
Making Data-Driven Decisions to Grow Your Business
- REPORT DESCRIPTION
- RESEARCH METHODOLOGY AND AI PLATFORM
- DATA-DRIVEN DECISIONS FOR YOUR BUSINESS
- GLOSSARY AND SPECIFIC TERMS
-
2. EXECUTIVE SUMMARY
A Quick Overview of Market Performance
- KEY FINDINGS
- MARKET TRENDS This Chapter is Available Only for the Professional Edition PRO
-
3. MARKET OVERVIEW
Understanding the Current State of The Market and Its Prospects
- MARKET SIZE
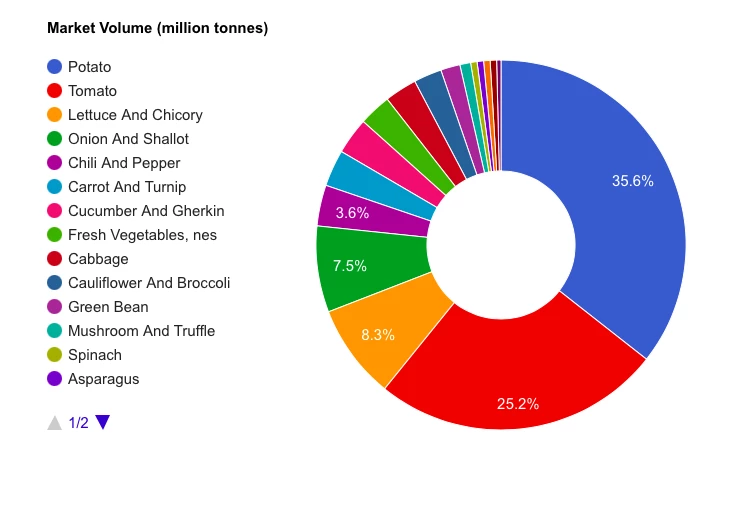
- MARKET STRUCTURE
- TRADE BALANCE
- PER CAPITA CONSUMPTION
- MARKET FORECAST TO 2030
-
4. MOST PROMISING PRODUCT
Finding New Products to Diversify Your Business
This Chapter is Available Only for the Professional Edition PRO- TOP PRODUCTS TO DIVERSIFY YOUR BUSINESS
- BEST-SELLING PRODUCTS
- MOST CONSUMED PRODUCT
- MOST TRADED PRODUCT
- MOST PROFITABLE PRODUCT FOR EXPORT
-
5. MOST PROMISING SUPPLYING COUNTRIES
Choosing the Best Countries to Establish Your Sustainable Supply Chain
This Chapter is Available Only for the Professional Edition PRO- TOP COUNTRIES TO SOURCE YOUR PRODUCT
- TOP PRODUCING COUNTRIES
- COUNTRIES WITH TOP YIELDS
- TOP EXPORTING COUNTRIES
- LOW-COST EXPORTING COUNTRIES
-
6. MOST PROMISING OVERSEAS MARKETS
Choosing the Best Countries to Boost Your Exports
This Chapter is Available Only for the Professional Edition PRO- TOP OVERSEAS MARKETS FOR EXPORTING YOUR PRODUCT
- TOP CONSUMING MARKETS
- UNSATURATED MARKETS
- TOP IMPORTING MARKETS
- MOST PROFITABLE MARKETS
7. PRODUCTION
The Latest Trends and Insights into The Industry
- PRODUCTION, HARVESTED AREA AND YIELD
8. IMPORTS
The Largest Import Supplying Countries
- IMPORTS FROM 2012–2023
- IMPORTS BY COUNTRY
- IMPORT PRICES BY COUNTRY
9. EXPORTS
The Largest Destinations for Exports
- EXPORTS FROM 2012–2023
- EXPORTS BY COUNTRY
- EXPORT PRICES BY COUNTRY
-
10. PROFILES OF MAJOR PRODUCERS
The Largest Producers on The Market and Their Profiles
This Chapter is Available Only for the Professional Edition PRO -
LIST OF TABLES
- Key Findings In 2023
- Market Volume, In Physical Terms, 2012–2023
- Market Value, 2012–2023
- Per Capita Consumption In 2012-2023
- Imports, In Physical Terms, By Country, 2012–2023
- Imports, In Value Terms, By Country, 2012–2023
- Import Prices, By Country Of Origin, 2012–2023
- Exports, In Physical Terms, By Country, 2012–2023
- Exports, In Value Terms, By Country, 2012–2023
- Export Prices, By Country Of Destination, 2012–2023
-
LIST OF FIGURES
- Market Volume, In Physical Terms, 2012–2023
- Market Value, 2012–2023
- Market Structure – Domestic Supply vs. Imports, In Physical Terms, 2012-2023
- Market Structure – Domestic Supply vs. Imports, In Value Terms, 2012-2023
- Trade Balance, In Physical Terms, 2012-2023
- Trade Balance, In Value Terms, 2012-2023
- Per Capita Consumption, 2012-2023
- Market Volume Forecast to 2030
- Market Value Forecast to 2030
- Products: Market Size And Growth, By Type
- Products: Average Per Capita Consumption, By Type
- Products: Exports And Growth, By Type
- Products: Export Prices And Growth, By Type
- Production Volume And Growth
- Yield And Growth
- Exports And Growth
- Export Prices And Growth
- Market Size And Growth
- Per Capita Consumption
- Imports And Growth
- Import Prices
- Production, In Physical Terms, 2012–2023
- Production, In Value Terms, 2012–2023
- Area Harvested, 2012–2023
- Yield, 2012–2023
- Imports, In Physical Terms, 2012–2023
- Imports, In Value Terms, 2012–2023
- Imports, In Physical Terms, By Country, 2023
- Imports, In Physical Terms, By Country, 2012–2023
- Imports, In Value Terms, By Country, 2012–2023
- Import Prices, By Country Of Origin, 2012–2023
- Exports, In Physical Terms, 2012–2023
- Exports, In Value Terms, 2012–2023
- Exports, In Physical Terms, By Country, 2023
- Exports, In Physical Terms, By Country, 2012–2023
- Exports, In Value Terms, By Country, 2012–2023
- Export Prices, By Country Of Destination, 2012–2023


