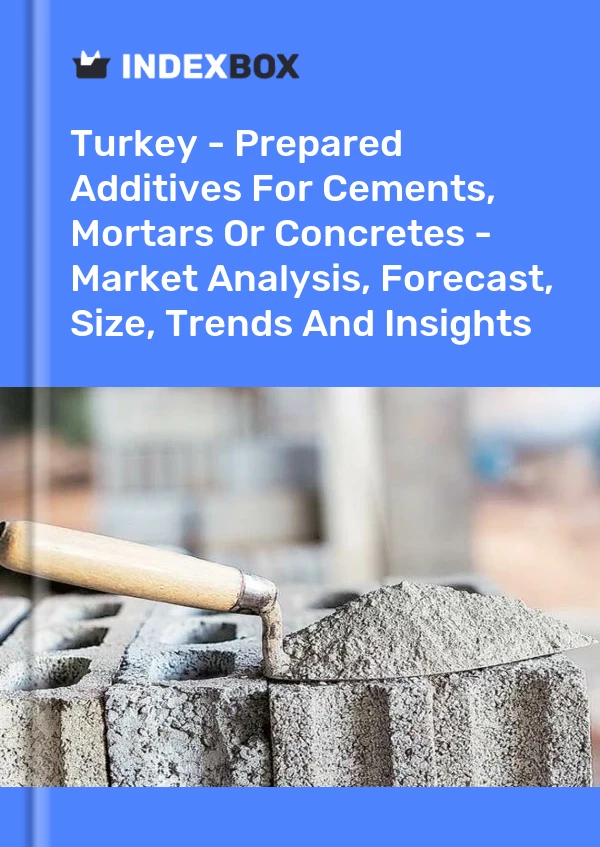
Turkey - Prepared Additives For Cements, Mortars Or Concretes - Market Analysis, Forecast, Size, Trends And Insights
Get instant access to more than 2 million reports, dashboards, and datasets on the IndexBox Platform.
View PricingTurkey's Cement Additives Market Rose 3.6% to Reached $637 in 2018
IndexBox has just published a new report: 'Turkey - Prepared Additives For Cements, Mortars Or Concretes - Market Analysis, Forecast, Size, Trends And Insights'. Here is a summary of the report's key findings.
The revenue of the prepared additives for cements market in Turkey amounted to $637M in 2018, growing by 3.6% against the previous year. This figure reflects the total revenues of producers and importers (excluding logistics costs, retail marketing costs, and retailers' margins, which will be included in the final consumer price). Overall, prepared additives for cements consumption continues to indicate strong growth. The pace of growth was the most pronounced in 2010 when the market value increased by 38% y-o-y. Prepared additives for cements consumption peaked in 2018 and is likely to continue its growth in the near future.
Production in Turkey
Prepared additives for cements production in Turkey stood at 1.2M tons in 2018, surging by 7.9% against the previous year. Over the period under review, prepared additives for cements production continues to indicate a buoyant expansion. The most prominent rate of growth was recorded in 2012 when production volume increased by 25% year-to-year. Over the period under review, prepared additives for cements production reached its peak figure volume in 2018 and is expected to retain its growth in the near future.
In value terms, prepared additives for cements production amounted to $632M in 2018 estimated in export prices. Overall, prepared additives for cements production continues to indicate a resilient increase. The pace of growth appeared the most rapid in 2010 when production volume increased by 38% year-to-year. Over the period under review, prepared additives for cements production attained its peak figure level in 2018 and is expected to retain its growth in the near future.
Exports from Turkey
In 2018, the exports of prepared additives for cements, mortars or concretes from Turkey totaled 77K tons, going up by 20% against the previous year. In general, prepared additives for cements exports continue to indicate a prominent increase. The most prominent rate of growth was recorded in 2011 when exports increased by 122% year-to-year. Over the period under review, prepared additives for cements exports reached their maximum in 2018 and are expected to retain its growth in the near future.
In value terms, prepared additives for cements exports amounted to $35M (IndexBox estimates) in 2018. Overall, the total exports indicated strong growth from 2007 to 2018: its value increased at an average annual rate of +10.6% over the last eleven-year period. The trend pattern, however, indicated some noticeable fluctuations being recorded throughout the analyzed period. Based on 2018 figures, prepared additives for cements exports decreased by -7.4% against 2014 indices. The pace of growth was the most pronounced in 2011 when exports increased by 53% against the previous year. Exports peaked at $38M in 2014; however, from 2015 to 2018, exports remained at a lower figure.
Exports by Country
Georgia (16K tons), Free Zones (12K tons) and Iraq (12K tons) were the main destinations of prepared additives for cements exports from Turkey, with a combined 52% share of total exports.
From 2007 to 2018, the most notable rate of growth in terms of exports, amongst the main countries of destination, was attained by Free Zones, while exports for the other leaders experienced more modest paces of growth.
In value terms, the largest markets for prepared additives for cements exported from Turkey were Iraq ($7M), Georgia ($5.6M) and Cyprus ($3M), together accounting for 44% of total exports. These countries were followed by Free Zones, Turkmenistan, Azerbaijan, Uzbekistan, Ethiopia, Bulgaria, Iran, the United Arab Emirates and Libya, which together accounted for a further 32%.
Iran experienced the highest growth rate of the value of exports, in terms of the main countries of destination over the period under review, while exports for the other leaders experienced more modest paces of growth.
Export Prices by Country
In 2018, the average prepared additives for cements export price amounted to $458 per ton, dropping by -5.1% against the previous year. Overall, the prepared additives for cements export price continues to indicate an abrupt downturn. The pace of growth appeared the most rapid in 2010 an increase of 30% against the previous year. In that year, the average export prices for prepared additives for cements, mortars or concretes reached their peak level of $1,021 per ton. From 2011 to 2018, the growth in terms of the average export prices for prepared additives for cements, mortars or concretes remained at a somewhat lower figure.
Prices varied noticeably by the country of destination; the country with the highest price was Ethiopia ($1,070 per ton), while the average price for exports to Free Zones ($164 per ton) was amongst the lowest.
From 2007 to 2018, the most notable rate of growth in terms of prices was recorded for supplies to Ethiopia, while the prices for the other major destinations experienced more modest paces of growth.
Imports into Turkey
In 2018, the amount of prepared additives for cements, mortars or concretes imported into Turkey amounted to 5.3K tons, lowering by -63.4% against the previous year. Overall, prepared additives for cements imports continue to indicate a deep reduction. The pace of growth was the most pronounced in 2008 with an increase of 73% y-o-y. Over the period under review, prepared additives for cements imports reached their peak figure at 20K tons in 2014; however, from 2015 to 2018, imports failed to regain their momentum.
In value terms, prepared additives for cements imports totaled $8.8M (IndexBox estimates) in 2018. Over the period under review, prepared additives for cements imports continue to indicate a perceptible reduction. The pace of growth appeared the most rapid in 2008 when imports increased by 80% y-o-y. Imports peaked at $29M in 2014; however, from 2015 to 2018, imports remained at a lower figure.
Imports by Country
France (1.7K tons), Germany (1.1K tons) and Italy (361 tons) were the main suppliers of prepared additives for cements imports to Turkey, together comprising 61% of total imports. These countries were followed by Canada, Slovakia, Belgium, Russia, the UK, India, the Netherlands and Romania, which together accounted for a further 28%.
From 2007 to 2018, the most notable rate of growth in terms of imports, amongst the main suppliers, was attained by Romania (+57.9% per year), while imports for the other leaders experienced more modest paces of growth.
In value terms, France ($2.9M), Germany ($2.4M) and Italy ($796K) constituted the largest prepared additives for cements suppliers to Turkey, together comprising 69% of total imports. Canada, Slovakia, Belgium, Russia, India, the UK, Romania and the Netherlands lagged somewhat behind, together comprising a further 19%.
Romania (+53.6% per year) recorded the highest growth rate of the value of imports, among the main suppliers over the period under review, while imports for the other leaders experienced more modest paces of growth.
Import Prices by Country
The average prepared additives for cements import price stood at $1,666 per ton in 2018, surging by 50% against the previous year. Over the period from 2007 to 2018, it increased at an average annual rate of +1.9%. The most prominent rate of growth was recorded in 2018 an increase of 50% y-o-y. In that year, the average import prices for prepared additives for cements, mortars or concretes reached their peak level and is likely to continue its growth in the immediate term.
There were significant differences in the average prices amongst the major supplying countries. In 2018, the country with the highest price was Italy ($2,203 per ton), while the price for the Netherlands ($477 per ton) was amongst the lowest.
From 2007 to 2018, the most notable rate of growth in terms of prices was attained by Germany, while the prices for the other major suppliers experienced more modest paces of growth.
Join Us at HANNOVER MESSE 2024
Don’t miss your chance to connect with us directly. Schedule a personal meeting to dive deeper into how solutions.
Hall 002, Stand C10. 22 - 26 April 2024 | Hannover, Germany

This report provides an in-depth analysis of the market for prepared additives for cements in Turkey. Within it, you will discover the latest data on market trends and opportunities by country, consumption, production and price developments, as well as the global trade (imports and exports). The forecast exhibits the market prospects through 2030.
Product coverage:
- Prodcom 20595750 - Prepared additives for cements, mortars or concretes
Country coverage:
- Turkey
Data coverage:
- Market volume and value
- Per Capita consumption
- Forecast of the market dynamics in the medium term
- Trade (exports and imports) in Turkey
- Export and import prices
- Market trends, drivers and restraints
- Key market players and their profiles
Reasons to buy this report:
- Take advantage of the latest data
- Find deeper insights into current market developments
- Discover vital success factors affecting the market
This report is designed for manufacturers, distributors, importers, and wholesalers, as well as for investors, consultants and advisors.
In this report, you can find information that helps you to make informed decisions on the following issues:
- How to diversify your business and benefit from new market opportunities
- How to load your idle production capacity
- How to boost your sales on overseas markets
- How to increase your profit margins
- How to make your supply chain more sustainable
- How to reduce your production and supply chain costs
- How to outsource production to other countries
- How to prepare your business for global expansion
While doing this research, we combine the accumulated expertise of our analysts and the capabilities of artificial intelligence. The AI-based platform, developed by our data scientists, constitutes the key working tool for business analysts, empowering them to discover deep insights and ideas from the marketing data.
-
1. INTRODUCTION
Making Data-Driven Decisions to Grow Your Business
- REPORT DESCRIPTION
- RESEARCH METHODOLOGY AND AI PLATFORM
- DATA-DRIVEN DECISIONS FOR YOUR BUSINESS
- GLOSSARY AND SPECIFIC TERMS
-
2. EXECUTIVE SUMMARY
A Quick Overview of Market Performance
- KEY FINDINGS
- MARKET TRENDS This Chapter is Available Only for the Professional Edition PRO
-
3. MARKET OVERVIEW
Understanding the Current State of The Market and Its Prospects
- MARKET SIZE
- MARKET STRUCTURE
- TRADE BALANCE
- PER CAPITA CONSUMPTION
- MARKET FORECAST TO 2030
-
4. MOST PROMISING PRODUCT
Finding New Products to Diversify Your Business
This Chapter is Available Only for the Professional Edition PRO- TOP PRODUCTS TO DIVERSIFY YOUR BUSINESS
- BEST-SELLING PRODUCTS
- MOST CONSUMED PRODUCT
- MOST TRADED PRODUCT
- MOST PROFITABLE PRODUCT FOR EXPORT
-
5. MOST PROMISING SUPPLYING COUNTRIES
Choosing the Best Countries to Establish Your Sustainable Supply Chain
This Chapter is Available Only for the Professional Edition PRO- TOP COUNTRIES TO SOURCE YOUR PRODUCT
- TOP PRODUCING COUNTRIES
- TOP EXPORTING COUNTRIES
- LOW-COST EXPORTING COUNTRIES
-
6. MOST PROMISING OVERSEAS MARKETS
Choosing the Best Countries to Boost Your Exports
This Chapter is Available Only for the Professional Edition PRO- TOP OVERSEAS MARKETS FOR EXPORTING YOUR PRODUCT
- TOP CONSUMING MARKETS
- UNSATURATED MARKETS
- TOP IMPORTING MARKETS
- MOST PROFITABLE MARKETS
7. PRODUCTION
The Latest Trends and Insights into The Industry
- PRODUCTION VOLUME AND VALUE
8. IMPORTS
The Largest Import Supplying Countries
- IMPORTS FROM 2012–2023
- IMPORTS BY COUNTRY
- IMPORT PRICES BY COUNTRY
9. EXPORTS
The Largest Destinations for Exports
- EXPORTS FROM 2012–2023
- EXPORTS BY COUNTRY
- EXPORT PRICES BY COUNTRY
-
10. PROFILES OF MAJOR PRODUCERS
The Largest Producers on The Market and Their Profiles
This Chapter is Available Only for the Professional Edition PRO -
LIST OF TABLES
- Key Findings In 2023
- Market Volume, In Physical Terms, 2012–2023
- Market Value, 2012–2023
- Per Capita Consumption In 2012-2023
- Imports, In Physical Terms, By Country, 2012–2023
- Imports, In Value Terms, By Country, 2012–2023
- Import Prices, By Country Of Origin, 2012–2023
- Exports, In Physical Terms, By Country, 2012–2023
- Exports, In Value Terms, By Country, 2012–2023
- Export Prices, By Country Of Destination, 2012–2023
-
LIST OF FIGURES
- Market Volume, In Physical Terms, 2012–2023
- Market Value, 2012–2023
- Market Structure – Domestic Supply vs. Imports, In Physical Terms, 2012-2023
- Market Structure – Domestic Supply vs. Imports, In Value Terms, 2012-2023
- Trade Balance, In Physical Terms, 2012-2023
- Trade Balance, In Value Terms, 2012-2023
- Per Capita Consumption, 2012-2023
- Market Volume Forecast to 2030
- Market Value Forecast to 2030
- Products: Market Size And Growth, By Type
- Products: Average Per Capita Consumption, By Type
- Products: Exports And Growth, By Type
- Products: Export Prices And Growth, By Type
- Production Volume And Growth
- Exports And Growth
- Export Prices And Growth
- Market Size And Growth
- Per Capita Consumption
- Imports And Growth
- Import Prices
- Production, In Physical Terms, 2012–2023
- Production, In Value Terms, 2012–2023
- Imports, In Physical Terms, 2012–2023
- Imports, In Value Terms, 2012–2023
- Imports, In Physical Terms, By Country, 2023
- Imports, In Physical Terms, By Country, 2012–2023
- Imports, In Value Terms, By Country, 2012–2023
- Import Prices, By Country Of Origin, 2012–2023
- Exports, In Physical Terms, 2012–2023
- Exports, In Value Terms, 2012–2023
- Exports, In Physical Terms, By Country, 2023
- Exports, In Physical Terms, By Country, 2012–2023
- Exports, In Value Terms, By Country, 2012–2023
- Export Prices, By Country Of Destination, 2012–2023


