
U.S. - Lemons And Limes - Market Analysis, Forecast, Size, Trends and Insights
Get instant access to more than 2 million reports, dashboards, and datasets on the IndexBox Platform.
View PricingLemon Price per Ton May 2022
U.S. Lemon Price per Ton May 2022
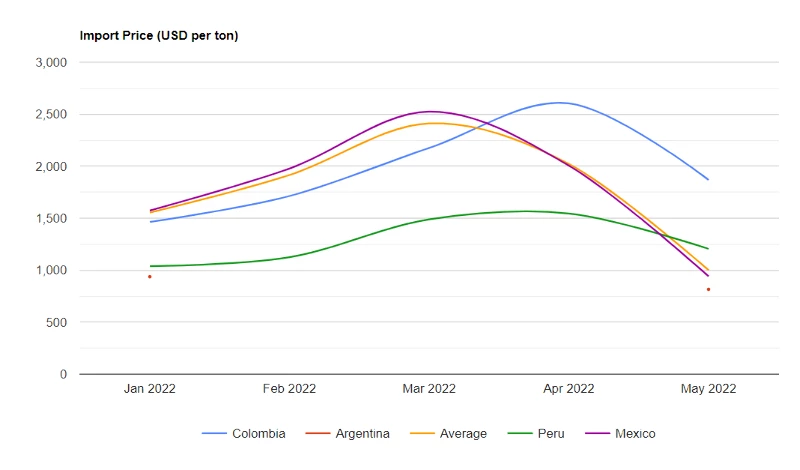
The lemon price per ton stood at $1,000 (CIF, US) in May 2022, falling by -50.5% against the previous month. Overall, the import price continues to indicate a deep contraction. The pace of growth was the most pronounced in Mar 2022 an increase of 26% m-o-m. As a result, import price reached the peak level of $2,411 per ton. From Apr 2022 to May 2022, the average import prices failed to regain momentum.
Prices varied noticeably by the country of origin: the country with the highest price was Colombia ($1,868 per ton), while the price for Argentina ($816 per ton) was amongst the lowest.
From Jan 2022 to May 2022, the most notable rate of growth in terms of prices was attained by Colombia (+6.3%), while the prices for the other major suppliers experienced mixed trend patterns.
U.S. Lemon Imports
In May 2022, lemon and lime imports into the United States totaled 59K tons, picking up by 9% on Apr 2022. The total import volume increased at an average monthly rate of +2.2% over the period from Jan 2022 to May 2022; however, the trend pattern indicated some noticeable fluctuations being recorded throughout the analyzed period. The growth pace was the most rapid in Apr 2022 when imports increased by 20% month-to-month. Over the period under review, imports hit record highs in May 2022 and are expected to retain growth in the immediate term.
In value terms, lemon and lime imports declined remarkably to $59M (IndexBox estimates) in May 2022. Over the period under review, imports, however, showed a abrupt slump. The most prominent rate of growth was recorded in Mar 2022 with an increase of 35% against the previous month. Over the period under review, imports attained the maximum at $110M in Apr 2022, and then reduced sharply in the following month.
U.S. Lemon Imports by Country
In May 2022, Mexico (52K tons) constituted the largest lemon and lime supplier to the United States, with a 87% share of total imports. Moreover, lemon and lime imports from Mexico exceeded the figures recorded by the second-largest supplier, Colombia (3.4K tons), more than tenfold. Argentina (1.7K tons) ranked third in terms of total imports with a 2.9% share.
From Jan 2022 to May 2022, the average monthly growth rate of volume from Mexico was relatively modest. The remaining supplying countries recorded the following average monthly rates of imports growth: Colombia (+7.7% per month) and Argentina (+84.7% per month).
In value terms, Mexico ($49M) constituted the largest supplier of lemon and lime to the United States, comprising 82% of total imports. The second position in the ranking was held by Colombia ($6.4M), with an 11% share of total imports. It was followed by Peru, with a 2.4% share.
From Jan 2022 to May 2022, the average monthly rate of growth in terms of value from Mexico totaled -11.5%. The remaining supplying countries recorded the following average monthly rates of imports growth: Colombia (+14.4% per month) and Peru (+33.8% per month).
This report provides an in-depth analysis of the lemon and lime market in the U.S.. Within it, you will discover the latest data on market trends and opportunities by country, consumption, production and price developments, as well as the global trade (imports and exports). The forecast exhibits the market prospects through 2030.
Product coverage:
- FCL 497 - Lemons and limes
Country coverage:
- United States
Data coverage:
- Market volume and value
- Per Capita consumption
- Forecast of the market dynamics in the medium term
- Trade (exports and imports) in the U.S.
- Export and import prices
- Market trends, drivers and restraints
- Key market players and their profiles
Reasons to buy this report:
- Take advantage of the latest data
- Find deeper insights into current market developments
- Discover vital success factors affecting the market
This report is designed for manufacturers, distributors, importers, and wholesalers, as well as for investors, consultants and advisors.
In this report, you can find information that helps you to make informed decisions on the following issues:
- How to diversify your business and benefit from new market opportunities
- How to load your idle production capacity
- How to boost your sales on overseas markets
- How to increase your profit margins
- How to make your supply chain more sustainable
- How to reduce your production and supply chain costs
- How to outsource production to other countries
- How to prepare your business for global expansion
While doing this research, we combine the accumulated expertise of our analysts and the capabilities of artificial intelligence. The AI-based platform, developed by our data scientists, constitutes the key working tool for business analysts, empowering them to discover deep insights and ideas from the marketing data.
-
1. INTRODUCTION
Making Data-Driven Decisions to Grow Your Business
- REPORT DESCRIPTION
- RESEARCH METHODOLOGY AND AI PLATFORM
- DATA-DRIVEN DECISIONS FOR YOUR BUSINESS
- GLOSSARY AND SPECIFIC TERMS
-
2. EXECUTIVE SUMMARY
A Quick Overview of Market Performance
- KEY FINDINGS
- MARKET TRENDS This Chapter is Available Only for the Professional Edition PRO
-
3. MARKET OVERVIEW
Understanding the Current State of The Market and Its Prospects
- MARKET SIZE
- MARKET STRUCTURE
- TRADE BALANCE
- PER CAPITA CONSUMPTION
- MARKET FORECAST TO 2030
-
4. MOST PROMISING PRODUCT
Finding New Products to Diversify Your Business
This Chapter is Available Only for the Professional Edition PRO- TOP PRODUCTS TO DIVERSIFY YOUR BUSINESS
- BEST-SELLING PRODUCTS
- MOST CONSUMED PRODUCT
- MOST TRADED PRODUCT
- MOST PROFITABLE PRODUCT FOR EXPORT
-
5. MOST PROMISING SUPPLYING COUNTRIES
Choosing the Best Countries to Establish Your Sustainable Supply Chain
This Chapter is Available Only for the Professional Edition PRO- TOP COUNTRIES TO SOURCE YOUR PRODUCT
- TOP PRODUCING COUNTRIES
- COUNTRIES WITH TOP YIELDS
- TOP EXPORTING COUNTRIES
- LOW-COST EXPORTING COUNTRIES
-
6. MOST PROMISING OVERSEAS MARKETS
Choosing the Best Countries to Boost Your Exports
This Chapter is Available Only for the Professional Edition PRO- TOP OVERSEAS MARKETS FOR EXPORTING YOUR PRODUCT
- TOP CONSUMING MARKETS
- UNSATURATED MARKETS
- TOP IMPORTING MARKETS
- MOST PROFITABLE MARKETS
7. PRODUCTION
The Latest Trends and Insights into The Industry
- PRODUCTION, HARVESTED AREA AND YIELD
8. IMPORTS
The Largest Import Supplying Countries
- IMPORTS FROM 2012–2023
- IMPORTS BY COUNTRY
- IMPORT PRICES BY COUNTRY
9. EXPORTS
The Largest Destinations for Exports
- EXPORTS FROM 2012–2023
- EXPORTS BY COUNTRY
- EXPORT PRICES BY COUNTRY
-
10. PROFILES OF MAJOR PRODUCERS
The Largest Producers on The Market and Their Profiles
This Chapter is Available Only for the Professional Edition PRO -
LIST OF TABLES
- Key Findings In 2023
- Market Volume, In Physical Terms, 2012–2023
- Market Value, 2012–2023
- Per Capita Consumption In 2012-2023
- Imports, In Physical Terms, By Country, 2012–2023
- Imports, In Value Terms, By Country, 2012–2023
- Import Prices, By Country Of Origin, 2012–2023
- Exports, In Physical Terms, By Country, 2012–2023
- Exports, In Value Terms, By Country, 2012–2023
- Export Prices, By Country Of Destination, 2012–2023
-
LIST OF FIGURES
- Market Volume, In Physical Terms, 2012–2023
- Market Value, 2012–2023
- Market Structure – Domestic Supply vs. Imports, In Physical Terms, 2012-2023
- Market Structure – Domestic Supply vs. Imports, In Value Terms, 2012-2023
- Trade Balance, In Physical Terms, 2012-2023
- Trade Balance, In Value Terms, 2012-2023
- Per Capita Consumption, 2012-2023
- Market Volume Forecast to 2030
- Market Value Forecast to 2030
- Products: Market Size And Growth, By Type
- Products: Average Per Capita Consumption, By Type
- Products: Exports And Growth, By Type
- Products: Export Prices And Growth, By Type
- Production Volume And Growth
- Yield And Growth
- Exports And Growth
- Export Prices And Growth
- Market Size And Growth
- Per Capita Consumption
- Imports And Growth
- Import Prices
- Production, In Physical Terms, 2012–2023
- Production, In Value Terms, 2012–2023
- Area Harvested, 2012–2023
- Yield, 2012–2023
- Imports, In Physical Terms, 2012–2023
- Imports, In Value Terms, 2012–2023
- Imports, In Physical Terms, By Country, 2023
- Imports, In Physical Terms, By Country, 2012–2023
- Imports, In Value Terms, By Country, 2012–2023
- Import Prices, By Country Of Origin, 2012–2023
- Exports, In Physical Terms, 2012–2023
- Exports, In Value Terms, 2012–2023
- Exports, In Physical Terms, By Country, 2023
- Exports, In Physical Terms, By Country, 2012–2023
- Exports, In Value Terms, By Country, 2012–2023
- Export Prices, By Country Of Destination, 2012–2023


