World - NPK Fertilizers - Market Analysis, Forecast, Size, Trends And Insights
Get instant access to more than 2 million reports, dashboards, and datasets on the IndexBox Platform.
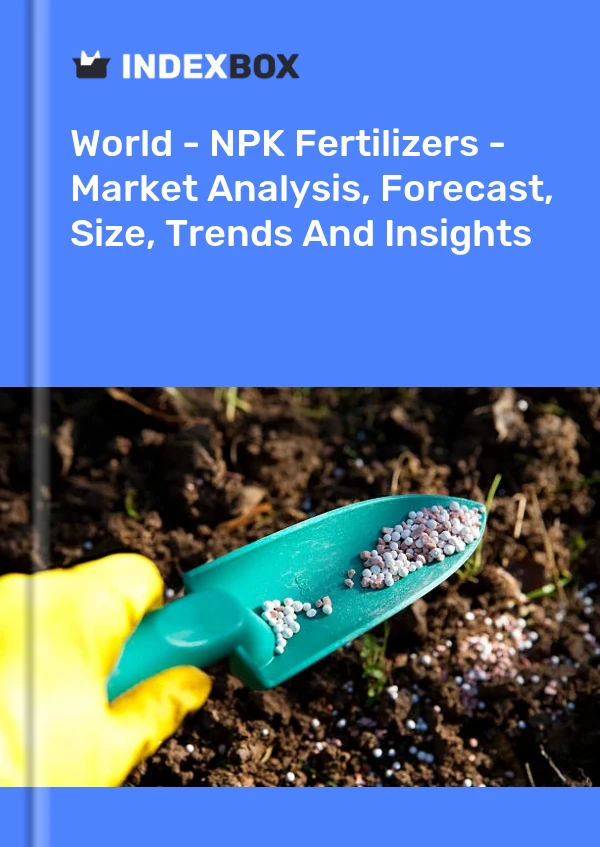
View PricingGlobal NPK Fertilizer Trade Surpasses $7.5B with Rising Exports from Russia and Norway
IndexBox has just published a new report: 'World - NPK Fertilizers - Market Analysis, Forecast, Size, Trends And Insights'. Here is a summary of the report's key findings.
The global NPK fertilizer market value rose to $42.2B in 2021, with an increase of 2.8% against the previous year. This figure reflects the total revenues of producers and importers (excluding logistics costs and intermediaries' margins, which will be included in the final consumer price). The market value increased at an average annual rate of +1.2% from 2007 to 2021.
In 2021, after five years of growth, there was decline in consumption of NPK fertilizers, when its volume decreased by -0.4% to 99M tons. Over the period under review, the total consumption indicated slight growth from 2007 to 2021: its volume increased at an average annual rate of +1.4% over the last fourteen-year period.
China, the U.S., India and Russia account for approximately 45% of global NPK fertilizer consumption. From 2007 to 2021, the average annual rate of growth in terms of volume in China totaled +2.8%. In the other countries, the average annual rates were as follows: the United States (-4.6% per year), India (+18.3% per year), Russia (-1.4% per year).
NPK Fertilizer Production
In 2021, after two years of decline, there was growth in production of NPK fertilizers, when its volume increased by 0.3% to 99M tons. The total output volume increased at an average annual rate of +1.3% over the period from 2007 to 2021.
The four countries, namely China, Russia, the U.S., and India shape more than 50% of global NPK fertilizer production. From 2007 to 2021, the average annual growth rate of volume in China totaled +3.0%. The remaining producing countries recorded the following average annual rates of production growth: Russia (+1.5% per year), the United States (-4.5% per year), India (+16.6% per year).
In value terms, production rose slightly to $37.9B in 2021 estimated in export prices. The total output value increased at an average annual rate of +1.7% from 2007 to 2021.
NPK Fertilizer Exports
In 2021, overseas shipments of NPK fertilizers were finally on the rise to reach 19M tons after three years of decline. Overall, total exports indicated a temperate increase from 2007 to 2021: its volume increased at an average annual rate of +3.0% over the last fourteen-year period.
In value terms, NPK fertilizer exports soared to $7.5B in 2021. In general, total exports indicated measured growth from 2007 to 2021: its value increased at an average annual rate of +3.0% over the last fourteen-year period.
Exports by Country
Russia was the largest exporter of NPK fertilizers in the world, with the volume of supplies finishing at 5.9M tons, which was near 32% of total exports in 2021. It was distantly followed by Norway (2.1M tons), Belgium (1.2M tons), China (1.1M tons) and Belarus (1M tons), together generating a 29% share of total exports. Morocco (757K tons), Poland (651K tons), the Netherlands (527K tons), Lithuania (456K tons), Spain (426K tons), the United States (299K tons) and Germany (292K tons) followed a long way behind the leaders.
In value terms, Russia ($2B) remains the largest NPK fertilizer supplier worldwide, comprising 27% of global exports. The second position in the ranking was taken by Norway ($777M), with a 10% share of total supplies. It was followed by Belgium, with a 7.4% share.
In Russia, NPK fertilizer exports expanded at an average annual rate of +8.4% over the period from 2007-2021. In the other countries, the average annual rates were as follows: Norway (+2.4% per year) and Belgium (+0.8% per year).
Export Prices by Country
In 2021, the average NPK fertilizer export price amounted to $403 per ton, growing by 22% against the previous year. Prices varied noticeably by the country of origin; the country with the highest price was the Netherlands ($809 per ton), while Morocco ($270 per ton) was amongst the lowest. From 2007 to 2021, the most notable rate of growth in terms of prices was attained by the Netherlands, while the other global leaders experienced more modest paces of growth.
NPK Fertilizer Imports
After two years of growth, overseas purchases of NPK fertilizers decreased by -0.9% to 19M tons in 2021. In general, total imports indicated tangible growth from 2007 to 2021: its volume increased at an average annual rate of +3.3% over the last fourteen years.
In value terms, NPK fertilizer imports skyrocketed to $8.3B in 2021. In general, total imports indicated buoyant growth from 2007 to 2021: its value increased at an average annual rate of +3.3% over the last fourteen-year period.
Imports by Country
The countries with the highest levels of NPK fertilizer imports in 2021 were China (1,398K tons), Brazil (1,364K tons), India (1,062K tons), Ukraine (1,060K tons), Poland (790K tons), Spain (785K tons), Lithuania (690K tons), Thailand (665K tons), Myanmar (463K tons), France (450K tons), the UK (381K tons) and Romania (366K tons), together accounting for 49% of total purchases. Paraguay (357K tons) occupied a relatively small share of total imports.
In value terms, China ($641M), India ($533M) and Ukraine ($493M) appeared to be the countries with the highest levels of imports in 2021, together accounting for 20% of global imports.
In terms of the main importing countries, India saw the highest rates of growth with regard to the value of imports, over the period under review, while purchases for the other global leaders experienced more modest paces of growth.
Import Prices by Country
The average NPK fertilizer import price stood at $433 per ton in 2021, with an increase of 20% against the previous year. There were significant differences in the average prices amongst the major importing countries. In 2021, the country with the highest price was India ($501 per ton), while Myanmar ($283 per ton) was amongst the lowest. From 2007 to 2021, the most notable rate of growth in terms of prices was attained by Myanmar, while the other global leaders experienced more modest paces of growth.
Join Us at HANNOVER MESSE 2024
Don’t miss your chance to connect with us directly. Schedule a personal meeting to dive deeper into how solutions.
Hall 002, Stand C10. 22 - 26 April 2024 | Hannover, Germany

This report provides an in-depth analysis of the global npk fertilizer market. Within it, you will discover the latest data on market trends and opportunities by country, consumption, production and price developments, as well as the global trade (imports and exports). The forecast exhibits the market prospects through 2030.
Product coverage:
- FCL 4021 - NPK fertilizers
Country coverage:
Worldwide - the report contains statistical data for 200 countries and includes detailed profiles of the 50 largest consuming countries:
- USA
- China
- Japan
- Germany
- United Kingdom
- France
- Brazil
- Italy
- Russian Federation
- India
- Canada
- Australia
- Republic of Korea
- Spain
- Mexico
- Indonesia
- Netherlands
- Turkey
- Saudi Arabia
- Switzerland
- Sweden
- Nigeria
- Poland
- Belgium
- Argentina
- Norway
- Austria
- Thailand
- United Arab Emirates
- Colombia
- Denmark
- South Africa
- Malaysia
- Israel
- Singapore
- Egypt
- Philippines
- Finland
- Chile
- Ireland
- Pakistan
- Greece
- Portugal
- Kazakhstan
- Algeria
- Czech Republic
- Qatar
- Peru
- Romania
- Vietnam
+ the largest producing countries
Data coverage:
- Global market volume and value
- Per Capita consumption
- Forecast of the market dynamics in the medium term
- Global production, split by region and country
- Global trade (exports and imports)
- Export and import prices
- Market trends, drivers and restraints
- Key market players and their profiles
Company coverage:
Reasons to buy this report:
- Take advantage of the latest data
- Find deeper insights into current market developments
- Discover vital success factors affecting the market
This report is designed for manufacturers, distributors, importers, and wholesalers, as well as for investors, consultants and advisors.
In this report, you can find information that helps you to make informed decisions on the following issues:
- How to diversify your business and benefit from new market opportunities
- How to load your idle production capacity
- How to boost your sales on overseas markets
- How to increase your profit margins
- How to make your supply chain more sustainable
- How to reduce your production and supply chain costs
- How to outsource production to other countries
- How to prepare your business for global expansion
While doing this research, we combine the accumulated expertise of our analysts and the capabilities of artificial intelligence. The AI-based platform, developed by our data scientists, constitutes the key working tool for business analysts, empowering them to discover deep insights and ideas from the marketing data.
-
1. INTRODUCTION
Making Data-Driven Decisions to Grow Your Business
- REPORT DESCRIPTION
- RESEARCH METHODOLOGY AND AI PLATFORM
- DATA-DRIVEN DECISIONS FOR YOUR BUSINESS
- GLOSSARY AND SPECIFIC TERMS
-
2. EXECUTIVE SUMMARY
A Quick Overview of Market Performance
- KEY FINDINGS
- MARKET TRENDS This Chapter is Available Only for the Professional Edition PRO
-
3. MARKET OVERVIEW
Understanding the Current State of The Market and Its Prospects
- MARKET SIZE
- CONSUMPTION BY COUNTRY
- MARKET FORECAST TO 2030
-
4. MOST PROMISING PRODUCT
Finding New Products to Diversify Your Business
This Chapter is Available Only for the Professional Edition PRO- TOP PRODUCTS TO DIVERSIFY YOUR BUSINESS
- BEST-SELLING PRODUCTS
- MOST CONSUMED PRODUCT
- MOST TRADED PRODUCT
- MOST PROFITABLE PRODUCT FOR EXPORT
-
5. MOST PROMISING SUPPLYING COUNTRIES
Choosing the Best Countries to Establish Your Sustainable Supply Chain
This Chapter is Available Only for the Professional Edition PRO- TOP COUNTRIES TO SOURCE YOUR PRODUCT
- TOP PRODUCING COUNTRIES
- TOP EXPORTING COUNTRIES
- LOW-COST EXPORTING COUNTRIES
-
6. MOST PROMISING OVERSEAS MARKETS
Choosing the Best Countries to Boost Your Exports
This Chapter is Available Only for the Professional Edition PRO- TOP OVERSEAS MARKETS FOR EXPORTING YOUR PRODUCT
- TOP CONSUMING MARKETS
- UNSATURATED MARKETS
- TOP IMPORTING MARKETS
- MOST PROFITABLE MARKETS
7. GLOBAL PRODUCTION
The Latest Trends and Insights into The Industry
- PRODUCTION VOLUME AND VALUE
- PRODUCTION BY COUNTRY
8. GLOBAL IMPORTS
The Largest Importers on The Market and How They Succeed
- IMPORTS FROM 2012–2023
- IMPORTS BY COUNTRY
- IMPORT PRICES BY COUNTRY
9. GLOBAL EXPORTS
The Largest Exporters on The Market and How They Succeed
- EXPORTS FROM 2012–2023
- EXPORTS BY COUNTRY
- EXPORT PRICES BY COUNTRY
-
10. PROFILES OF MAJOR PRODUCERS
The Largest Producers on The Market and Their Profiles
This Chapter is Available Only for the Professional Edition PRO -
11. COUNTRY PROFILES
The Largest Markets And Their Profiles
This Chapter is Available Only for the Professional Edition PRO- United States
- China
- Japan
- Germany
- United Kingdom
- France
- Brazil
- Italy
- Russian Federation
- India
- Canada
- Australia
- Republic of Korea
- Spain
- Mexico
- Indonesia
- Netherlands
- Turkey
- Saudi Arabia
- Switzerland
- Sweden
- Nigeria
- Poland
- Belgium
- Argentina
- Norway
- Austria
- Thailand
- United Arab Emirates
- Colombia
- Denmark
- South Africa
- Malaysia
- Israel
- Singapore
- Egypt
- Philippines
- Finland
- Chile
- Ireland
- Pakistan
- Greece
- Portugal
- Kazakhstan
- Algeria
- Czech Republic
- Qatar
- Peru
- Romania
- Vietnam
-
LIST OF TABLES
- Key Findings In 2023
- Market Volume, In Physical Terms, 2012–2023
- Market Value, 2012–2023
- Per Capita Consumption, By Country, 2018–2023
- Production, In Physical Terms, By Country, 2012–2023
- Imports, In Physical Terms, By Country, 2012–2023
- Imports, In Value Terms, By Country, 2012–2023
- Import Prices, By Country Of Destination, 2012–2023
- Exports, In Physical Terms, By Country, 2012–2023
- Exports, In Value Terms, By Country, 2012–2023
- Export Prices, By Country Of Origin, 2012–2023
-
LIST OF FIGURES
- Market Volume, In Physical Terms, 2012–2023
- Market Value, 2012–2023
- Consumption, By Country, 2023
- Market Volume Forecast to 2030
- Market Value Forecast to 2030
- Products: Market Size And Growth, By Type
- Products: Average Per Capita Consumption, By Type
- Products: Exports And Growth, By Type
- Products: Export Prices And Growth, By Type
- Production Volume And Growth
- Exports And Growth
- Export Prices And Growth
- Market Size And Growth
- Per Capita Consumption
- Imports And Growth
- Import Prices
- Production, In Physical Terms, 2012–2023
- Production, In Value Terms, 2012–2023
- Production, By Country, 2023
- Production, In Physical Terms, By Country, 2012–2023
- Imports, In Physical Terms, 2012–2023
- Imports, In Value Terms, 2012–2023
- Imports, In Physical Terms, By Country, 2023
- Imports, In Physical Terms, By Country, 2012–2023
- Imports, In Value Terms, By Country, 2012–2023
- Import Prices, By Country, 2012–2023
- Exports, In Physical Terms, 2012–2023
- Exports, In Value Terms, 2012–2023
- Exports, In Physical Terms, By Country, 2023
- Exports, In Physical Terms, By Country, 2012–2023
- Exports, In Value Terms, By Country, 2012–2023
- Export Prices, 2012–2023


