World - Electrical Transformers with Liquid Dielectric, of Power Handling Capacity over 10000 kVA - Market Analysis, Forecast, Size, Trends And Insights
Get instant access to more than 2 million reports, dashboards, and datasets on the IndexBox Platform.
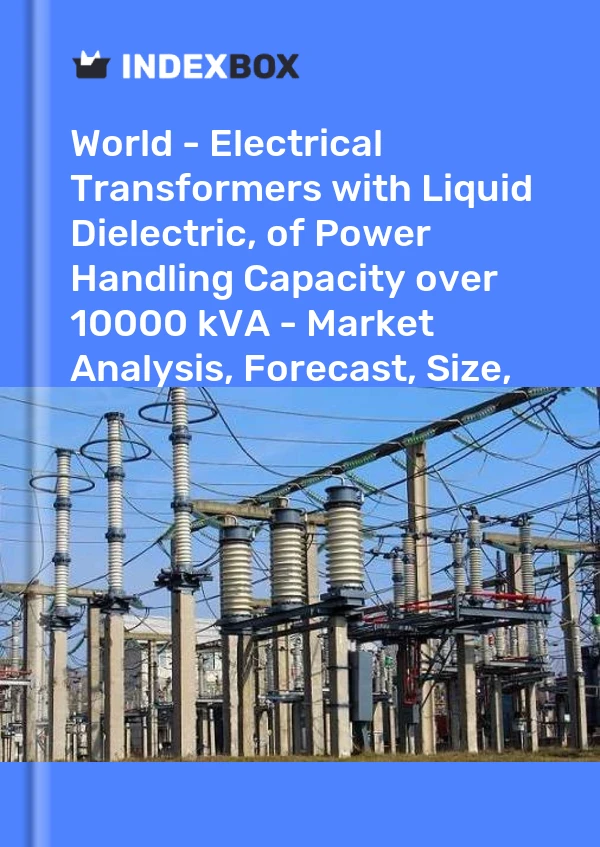
View PricingGlobal High-Power Electrical Transformer Market Hampered by Decreased Investment amid the Pandemic
IndexBox has just published a new report: 'World - Electrical Transformers with Liquid Dielectric, of Power Handling Capacity over 10000 kVA - Market Analysis, Forecast, Size, Trends and Insights'. Here is a summary of the report's key findings.
After two years of growth, the global market for electrical transformers with liquid dielectric, of power handling capacity over 10000 kVA decreased by -18.6% to $14.5B in 2019.
The countries with the highest volumes of consumption of electrical transformers with liquid dielectric, of power handling capacity over 10000 kVA in 2019 were China (4.5K units), Pakistan (2.4K units) and the U.S. (2.2K units), together comprising 26% of global consumption (IndexBox estimates).
In value terms, China ($1.5B) led the market, alone. The second position in the ranking was occupied by the U.S. ($703M). It was followed by India.
Transformers and power distribution equipment tend to follow distributional and industrial electrical utility construction, the creation of new communities, and a replacement cycle. Therefore, the rising demand for transformers will also be shaped by both the residential construction sector and industrial production alike, which are conditioned by rising population and urbanization, particularly in Asia, capital investment, and the expansion of transport and telecom infrastructure; overall, those factors reflect the global GDP growth.
Until 2020, the global economy has been developing steadily for five years, although at a slower pace than in the previous decade. The slowdown in global economic growth was caused by increased political uncertainty in the world and trade wars between the United States and China. According to the World Bank outlook from January 2020, the global economy was expected to pick up the growth momentum and increase from +2.5% to +2.7% per year in the medium term.
In early 2020, however, the global economy entered a period of crisis caused by the outbreak of the COVID-19 pandemic. In order to battle the spread of the virus, most countries in the world implemented quarantine measures that put on halt production and transport activity.
The combination of those factors disrupts economic growth heavily throughout the world. According to World Bank forecasts, despite the gradual relaxing of restrictive measures and unprecedented government support in countries that faced the pandemic in early 2020, the annual decline of global GDP could amount to -4.3%, which is the deepest global recession being seen over the past eight decades.
In Asian countries, especially China, which faced the pandemic earlier than others, the epidemic situation improved earlier, with the quarantine measures largely relaxed, and the economy is gradually recovering from the forced outage. Thus, in China, by the end of 2020, an increase of 2.0% is expected (while a year earlier it was 6.1%), and in general in Southeast Asia in 2020, an increase of 0.9% is expected. In the medium term, it is assumed that the economy will gradually recover over several years as the restrictions are finally lifted.
The U.S., meanwhile, is struggling with a drastic short-term recession, with the expected contraction of GDP of approx. -3.6% in 2020, as the hit of the pandemic was harder than expected, and unemployment soared due to the shutdown and social isolation. The pandemic also led to a sharp drop in oil prices, because the demand for fuel dropped dramatically during the shutdown.
According to the European Commission, the EU economy is forecasted to drop by -7.4% in 2020 on the backdrop of the pandemic, hampered by the lockdown, a drop in consumer spending and decreased investment. Russia is also struggling with a sensitive short-term recession, with the expected contraction of GDP of approx. -4.0% in 2020. Current short-term indicators show that the plunge in the first half of 2020 was really deep, but a gradual recovery starts in the third quarter of 2020.
Both the construction and industrial sectors have proven vulnerable to the pandemic. Thus, the above economic prerequisites will have the most negative impact on the expansion of new residential and non-residential construction projects, thereby hampering the demand for electricity. Due to quarantine measures, construction projects were paused, and the drop in incomes of the population makes mortgage loans less affordable.
In addition, the reduced capital investment may lead to the postponement of plans for the building of new infrastructural and industrial facilities. The reduction of capital investments and the shortage in consumer spending also hamper the industrial sector, and metallurgy in particular, which is, on the one hand, an energy-intensive industry, and on the other hand, is also affected severely by the reduced demand for cars and other transport equipment.
Moreover, the disruption of established international supply chains between electric transformer producers and consumers due to asynchronous quarantine measures and restricted transport activity also hampers the market growth.
Taking into account the above, it is expected that in 2020, global consumption of electrical transformers should decline slightly against 2019. In the medium term, as the global economy recovers from the effects of the pandemic, the market is expected to grow gradually. Overall, market performance is forecast to pursue a slightly upward trend over the next decade, expanding with an anticipated CAGR of +0.4% for the period from 2019 to 2030, which is projected to bring the market volume to 163M units by the end of 2030.
Global Imports
Global imports of electrical transformers with liquid dielectric, of power handling capacity over 10000 kVA totaled 16K units in 2019, leveling off at the previous year's figure. Global imports peaked at 18K units in 2013; however, from 2014 to 2019, imports stood at a somewhat lower figure. In value terms, imports of electrical transformers with liquid dielectric, of power handling capacity over 10000 kVA dropped to $3.4B (IndexBox estimates) in 2019. I
Imports by Country
The U.S. (2.4K units) and Pakistan (2.4K units) represented roughly 30% of total imports of electrical transformers with liquid dielectric, of power handling capacity over 10000 kVA in 2019. Saudi Arabia (862 units) occupied a 5.3% share (based on tons) of total imports, which put it in second place, followed by Sweden (4.7%). Malaysia (597 units), the United Arab Emirates (428 units), Norway (411 units), India (395 units), China (346 units), Chile (323 units), Singapore (281 units), Greece (274 units) and Canada (259 units) followed a long way behind the leaders.
From 2013 to 2019, the most notable rate of growth in terms of purchases, amongst the main importing countries, was attained by Pakistan, while imports for the other global leaders experienced more modest paces of growth.
In value terms, the U.S. ($773M) constitutes the largest market for imported electrical transformers with liquid dielectric, of power handling capacity over 10000 kVA worldwide, comprising 23% of global imports. The second position in the ranking was occupied by Pakistan ($283M), with an 8.3% share of global imports. It was followed by the United Arab Emirates, with a 3.2% share.
Join Us at HANNOVER MESSE 2024
Don’t miss your chance to connect with us directly. Schedule a personal meeting to dive deeper into how solutions.
Hall 002, Stand C10. 22 - 26 April 2024 | Hannover, Germany

This report provides an in-depth analysis of the global market for electrical transformers with liquid dielectric, of power handling capacity over 10000 kva. Within it, you will discover the latest data on market trends and opportunities by country, consumption, production and price developments, as well as the global trade (imports and exports). The forecast exhibits the market prospects through 2030.
Product coverage:
- Prodcom 27114180 - Liquid dielectric transformers having a power handling capacity > .10 .000 kVA
Country coverage:
Worldwide - the report contains statistical data for 200 countries and includes detailed profiles of the 50 largest consuming countries:
- USA
- China
- Japan
- Germany
- United Kingdom
- France
- Brazil
- Italy
- Russian Federation
- India
- Canada
- Australia
- Republic of Korea
- Spain
- Mexico
- Indonesia
- Netherlands
- Turkey
- Saudi Arabia
- Switzerland
- Sweden
- Nigeria
- Poland
- Belgium
- Argentina
- Norway
- Austria
- Thailand
- United Arab Emirates
- Colombia
- Denmark
- South Africa
- Malaysia
- Israel
- Singapore
- Egypt
- Philippines
- Finland
- Chile
- Ireland
- Pakistan
- Greece
- Portugal
- Kazakhstan
- Algeria
- Czech Republic
- Qatar
- Peru
- Romania
- Vietnam
+ the largest producing countries
Data coverage:
- Global market volume and value
- Per Capita consumption
- Forecast of the market dynamics in the medium term
- Global production, split by region and country
- Global trade (exports and imports)
- Export and import prices
- Market trends, drivers and restraints
- Key market players and their profiles
Reasons to buy this report:
- Take advantage of the latest data
- Find deeper insights into current market developments
- Discover vital success factors affecting the market
This report is designed for manufacturers, distributors, importers, and wholesalers, as well as for investors, consultants and advisors.
In this report, you can find information that helps you to make informed decisions on the following issues:
- How to diversify your business and benefit from new market opportunities
- How to load your idle production capacity
- How to boost your sales on overseas markets
- How to increase your profit margins
- How to make your supply chain more sustainable
- How to reduce your production and supply chain costs
- How to outsource production to other countries
- How to prepare your business for global expansion
While doing this research, we combine the accumulated expertise of our analysts and the capabilities of artificial intelligence. The AI-based platform, developed by our data scientists, constitutes the key working tool for business analysts, empowering them to discover deep insights and ideas from the marketing data.
-
1. INTRODUCTION
Making Data-Driven Decisions to Grow Your Business
- REPORT DESCRIPTION
- RESEARCH METHODOLOGY AND AI PLATFORM
- DATA-DRIVEN DECISIONS FOR YOUR BUSINESS
- GLOSSARY AND SPECIFIC TERMS
-
2. EXECUTIVE SUMMARY
A Quick Overview of Market Performance
- KEY FINDINGS
- MARKET TRENDS This Chapter is Available Only for the Professional Edition PRO
-
3. MARKET OVERVIEW
Understanding the Current State of The Market and Its Prospects
- MARKET SIZE
- CONSUMPTION BY COUNTRY
- MARKET FORECAST TO 2030
-
4. MOST PROMISING PRODUCT
Finding New Products to Diversify Your Business
This Chapter is Available Only for the Professional Edition PRO- TOP PRODUCTS TO DIVERSIFY YOUR BUSINESS
- BEST-SELLING PRODUCTS
- MOST CONSUMED PRODUCT
- MOST TRADED PRODUCT
- MOST PROFITABLE PRODUCT FOR EXPORT
-
5. MOST PROMISING SUPPLYING COUNTRIES
Choosing the Best Countries to Establish Your Sustainable Supply Chain
This Chapter is Available Only for the Professional Edition PRO- TOP COUNTRIES TO SOURCE YOUR PRODUCT
- TOP PRODUCING COUNTRIES
- TOP EXPORTING COUNTRIES
- LOW-COST EXPORTING COUNTRIES
-
6. MOST PROMISING OVERSEAS MARKETS
Choosing the Best Countries to Boost Your Exports
This Chapter is Available Only for the Professional Edition PRO- TOP OVERSEAS MARKETS FOR EXPORTING YOUR PRODUCT
- TOP CONSUMING MARKETS
- UNSATURATED MARKETS
- TOP IMPORTING MARKETS
- MOST PROFITABLE MARKETS
7. GLOBAL PRODUCTION
The Latest Trends and Insights into The Industry
- PRODUCTION VOLUME AND VALUE
- PRODUCTION BY COUNTRY
8. GLOBAL IMPORTS
The Largest Importers on The Market and How They Succeed
- IMPORTS FROM 2012–2023
- IMPORTS BY COUNTRY
- IMPORT PRICES BY COUNTRY
9. GLOBAL EXPORTS
The Largest Exporters on The Market and How They Succeed
- EXPORTS FROM 2012–2023
- EXPORTS BY COUNTRY
- EXPORT PRICES BY COUNTRY
-
10. PROFILES OF MAJOR PRODUCERS
The Largest Producers on The Market and Their Profiles
This Chapter is Available Only for the Professional Edition PRO -
11. COUNTRY PROFILES
The Largest Markets And Their Profiles
This Chapter is Available Only for the Professional Edition PRO- United States
- China
- Japan
- Germany
- United Kingdom
- France
- Brazil
- Italy
- Russian Federation
- India
- Canada
- Australia
- Republic of Korea
- Spain
- Mexico
- Indonesia
- Netherlands
- Turkey
- Saudi Arabia
- Switzerland
- Sweden
- Nigeria
- Poland
- Belgium
- Argentina
- Norway
- Austria
- Thailand
- United Arab Emirates
- Colombia
- Denmark
- South Africa
- Malaysia
- Israel
- Singapore
- Egypt
- Philippines
- Finland
- Chile
- Ireland
- Pakistan
- Greece
- Portugal
- Kazakhstan
- Algeria
- Czech Republic
- Qatar
- Peru
- Romania
- Vietnam
-
LIST OF TABLES
- Key Findings In 2023
- Market Volume, In Physical Terms, 2012–2023
- Market Value, 2012–2023
- Per Capita Consumption, By Country, 2018–2023
- Production, In Physical Terms, By Country, 2012–2023
- Imports, In Physical Terms, By Country, 2012–2023
- Imports, In Value Terms, By Country, 2012–2023
- Import Prices, By Country Of Destination, 2012–2023
- Exports, In Physical Terms, By Country, 2012–2023
- Exports, In Value Terms, By Country, 2012–2023
- Export Prices, By Country Of Origin, 2012–2023
-
LIST OF FIGURES
- Market Volume, In Physical Terms, 2012–2023
- Market Value, 2012–2023
- Consumption, By Country, 2023
- Market Volume Forecast to 2030
- Market Value Forecast to 2030
- Products: Market Size And Growth, By Type
- Products: Average Per Capita Consumption, By Type
- Products: Exports And Growth, By Type
- Products: Export Prices And Growth, By Type
- Production Volume And Growth
- Exports And Growth
- Export Prices And Growth
- Market Size And Growth
- Per Capita Consumption
- Imports And Growth
- Import Prices
- Production, In Physical Terms, 2012–2023
- Production, In Value Terms, 2012–2023
- Production, By Country, 2023
- Production, In Physical Terms, By Country, 2012–2023
- Imports, In Physical Terms, 2012–2023
- Imports, In Value Terms, 2012–2023
- Imports, In Physical Terms, By Country, 2023
- Imports, In Physical Terms, By Country, 2012–2023
- Imports, In Value Terms, By Country, 2012–2023
- Import Prices, By Country, 2012–2023
- Exports, In Physical Terms, 2012–2023
- Exports, In Value Terms, 2012–2023
- Exports, In Physical Terms, By Country, 2023
- Exports, In Physical Terms, By Country, 2012–2023
- Exports, In Value Terms, By Country, 2012–2023
- Export Prices, 2012–2023


