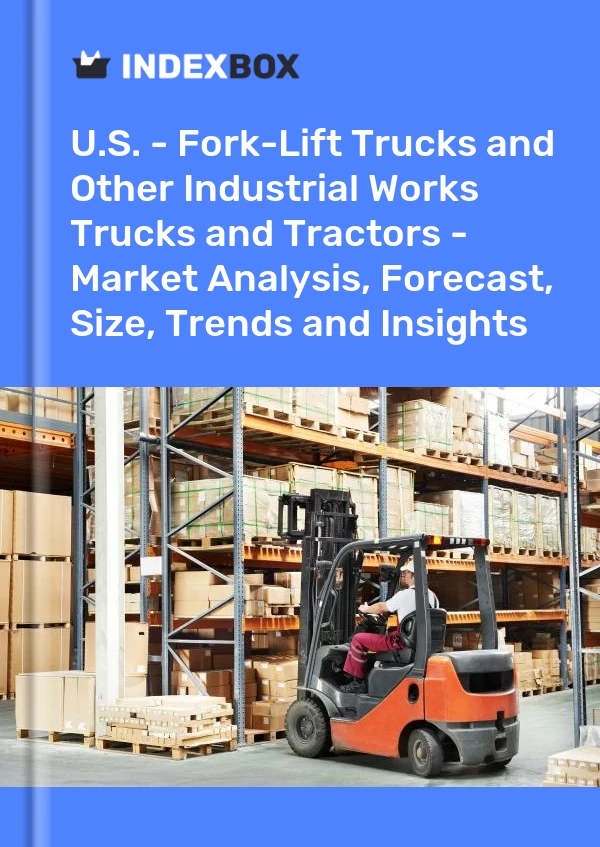
U.S. - Fork-Lift Trucks and Other Industrial Works Trucks and Tractors - Market Analysis, Forecast, Size, Trends and Insights
Get instant access to more than 2 million reports, dashboards, and datasets on the IndexBox Platform.
View PricingBuoyant Warehouse Growth Benefits the U.S. Forklift Truck Market
IndexBox has just published a new report: 'U.S. - Fork-Lift Trucks And Other Works Trucks, Tractors Of The Type Used On Railway Station Platforms - Market Analysis, Forecast, Size, Trends and Insights'. Here is a summary of the report's key findings.
The e-commerce boom seen in the second half of 2020 led to an increased demand for both warehouse space and the forklift trucks required to service and maintain these facilities. The increasing use of lithium-ion battery-operated forklift devices is also in pace with the Paris Agreement regarding energy efficiency and the reduction of pollution.
Key Trends and Insights
Rapid e-commerce growth led to a sharp surge in the demand for warehouse space and the hardware designed to maintain it, incl. forklift trucks. According to the March CBRE report, in North America, the warehouse construction completions increased from 159 million sq. ft in 2019 to 185 million sq. ft in 2020 and the direct vacancy rate dropped from 5.2% in 2019 to 4.6% in 2020. The demand for warehouse facilities near a marine port remains especially high.
The current shortage of vacant warehouse space is forecast to continue through 2021; this will determine the demand for forklift trucks in the medium term. The U.S. construction sector is set to expand further through the single-family segment, thereby driving the logistics of building materials. Consumer behaviour is expected to remain largely in e-commerce and the remote working trend is set to continue as the country emerges from the pandemic.
The pandemic forced forklift truck manufacturers to seriously consider the safety measures required during forklift truck operation. Attention became focused not only on employee hygiene (washing hands and maintaining a safe distance) but also on general health and safety regulations in the workplace, to reduce the number of accidents and medical visits and call-outs. The wireless monitoring of forklift truck operations is now more widespread, allowing for vehicle usage and performance to be tracked, the planning of efficient service intervals and the distribution of vehicle load.
The forklift truck market is developing in line with the Paris Agreement's commitment to reduce harmful waste and emissions and increase energy efficiency: lithium-battery-operated vehicles are now increasingly common. Lithium-ion batteries are more environmentally friendly and energy-efficient than the conventional acid alternative.
Canada, Mexico and Australia Remain Key Export Countries for the U.S.
In 2019, the amount of fork-lift trucks and other works trucks, tractors of the type used on railway station platforms exported from the U.S. declined rapidly to 88K units, which is down by -30.9% compared with 2018. Overall, exports continue to indicate a abrupt slump. The pace of growth appeared the most rapid in 2014 when exports increased by 99% against the previous year. As a result, exports reached the peak of 279K units. From 2015 to 2019, the growth exports remained at a lower figure.
In value terms, forklift truck exports totaled $2B (IndexBox estimates) in 2019. Over the period under review, exports saw a noticeable curtailment. The most prominent rate of growth was recorded in 2016 with an increase of 21% year-to-year. Exports peaked at $2.8B in 2013; however, from 2014 to 2019, exports stood at a somewhat lower figure.
Canada (28K units), Mexico (14K units) and Australia (7.5K units) were the main destinations of forklift truck exports from the U.S., together accounting for 56% of total exports. These countries were followed by the UK, the Netherlands, Belgium, Brazil, South Korea and Chile, which together accounted for a further 22%.
From 2012 to 2019, the most notable rate of growth in terms of shipments, amongst the main countries of destination, was attained by Belgium, while exports for the other leaders experienced more modest paces of growth.
In value terms, Canada ($739M) remains the key foreign market for forklift truck exports from the U.S., comprising 38% of total exports. The second position in the ranking was occupied by Mexico ($324M), with a 16% share of total exports. It was followed by Belgium, with a 7% share.
This report provides an in-depth analysis of the market for forklift truck and industrial works truck in the U.S.. Within it, you will discover the latest data on market trends and opportunities by country, consumption, production and price developments, as well as the global trade (imports and exports). The forecast exhibits the market prospects through 2030.
Product coverage:
- Prodcom 28221513 - Self-propelled fork-lift trucks powered by an electric motor, w ith a lifting height . 1 m
- Prodcom 28221515 - Self-propelled fork-lift trucks powered by an electric motor, w ith a lifting height < 1 m
- Prodcom 28221530 - Self-propelled trucks fitted with lifting or handling equipment, n on-powered by an electric motor
- Prodcom 28221550 - Fork-lift trucks and other works trucks fitted with lifting or handling equipment (excluding self-propelled trucks)
- Prodcom 28221570 - Works trucks, self-propelled, not fitted with lifting or handling equipment, of the type used in factories, warehouses, dock areas or airports for short distance transport of goods, t ractors of the type used on railway station platforms
Country coverage:
- United States
Data coverage:
- Market volume and value
- Per Capita consumption
- Forecast of the market dynamics in the medium term
- Trade (exports and imports) in the U.S.
- Export and import prices
- Market trends, drivers and restraints
- Key market players and their profiles
Reasons to buy this report:
- Take advantage of the latest data
- Find deeper insights into current market developments
- Discover vital success factors affecting the market
This report is designed for manufacturers, distributors, importers, and wholesalers, as well as for investors, consultants and advisors.
In this report, you can find information that helps you to make informed decisions on the following issues:
- How to diversify your business and benefit from new market opportunities
- How to load your idle production capacity
- How to boost your sales on overseas markets
- How to increase your profit margins
- How to make your supply chain more sustainable
- How to reduce your production and supply chain costs
- How to outsource production to other countries
- How to prepare your business for global expansion
While doing this research, we combine the accumulated expertise of our analysts and the capabilities of artificial intelligence. The AI-based platform, developed by our data scientists, constitutes the key working tool for business analysts, empowering them to discover deep insights and ideas from the marketing data.
-
1. INTRODUCTION
Making Data-Driven Decisions to Grow Your Business
- REPORT DESCRIPTION
- RESEARCH METHODOLOGY AND AI PLATFORM
- DATA-DRIVEN DECISIONS FOR YOUR BUSINESS
- GLOSSARY AND SPECIFIC TERMS
-
2. EXECUTIVE SUMMARY
A Quick Overview of Market Performance
- KEY FINDINGS
- MARKET TRENDS This Chapter is Available Only for the Professional Edition PRO
-
3. MARKET OVERVIEW
Understanding the Current State of The Market and Its Prospects
- MARKET SIZE
- MARKET STRUCTURE
- TRADE BALANCE
- PER CAPITA CONSUMPTION
- MARKET FORECAST TO 2030
-
4. MOST PROMISING PRODUCT
Finding New Products to Diversify Your Business
This Chapter is Available Only for the Professional Edition PRO- TOP PRODUCTS TO DIVERSIFY YOUR BUSINESS
- BEST-SELLING PRODUCTS
- MOST CONSUMED PRODUCT
- MOST TRADED PRODUCT
- MOST PROFITABLE PRODUCT FOR EXPORT
-
5. MOST PROMISING SUPPLYING COUNTRIES
Choosing the Best Countries to Establish Your Sustainable Supply Chain
This Chapter is Available Only for the Professional Edition PRO- TOP COUNTRIES TO SOURCE YOUR PRODUCT
- TOP PRODUCING COUNTRIES
- TOP EXPORTING COUNTRIES
- LOW-COST EXPORTING COUNTRIES
-
6. MOST PROMISING OVERSEAS MARKETS
Choosing the Best Countries to Boost Your Exports
This Chapter is Available Only for the Professional Edition PRO- TOP OVERSEAS MARKETS FOR EXPORTING YOUR PRODUCT
- TOP CONSUMING MARKETS
- UNSATURATED MARKETS
- TOP IMPORTING MARKETS
- MOST PROFITABLE MARKETS
7. PRODUCTION
The Latest Trends and Insights into The Industry
- PRODUCTION VOLUME AND VALUE
8. IMPORTS
The Largest Import Supplying Countries
- IMPORTS FROM 2012–2023
- IMPORTS BY COUNTRY
- IMPORT PRICES BY COUNTRY
9. EXPORTS
The Largest Destinations for Exports
- EXPORTS FROM 2012–2023
- EXPORTS BY COUNTRY
- EXPORT PRICES BY COUNTRY
-
10. PROFILES OF MAJOR PRODUCERS
The Largest Producers on The Market and Their Profiles
This Chapter is Available Only for the Professional Edition PRO -
LIST OF TABLES
- Key Findings In 2023
- Market Volume, In Physical Terms, 2012–2023
- Market Value, 2012–2023
- Per Capita Consumption In 2012-2023
- Imports, In Physical Terms, By Country, 2012–2023
- Imports, In Value Terms, By Country, 2012–2023
- Import Prices, By Country Of Origin, 2012–2023
- Exports, In Physical Terms, By Country, 2012–2023
- Exports, In Value Terms, By Country, 2012–2023
- Export Prices, By Country Of Destination, 2012–2023
-
LIST OF FIGURES
- Market Volume, In Physical Terms, 2012–2023
- Market Value, 2012–2023
- Market Structure – Domestic Supply vs. Imports, In Physical Terms, 2012-2023
- Market Structure – Domestic Supply vs. Imports, In Value Terms, 2012-2023
- Trade Balance, In Physical Terms, 2012-2023
- Trade Balance, In Value Terms, 2012-2023
- Per Capita Consumption, 2012-2023
- Market Volume Forecast to 2030
- Market Value Forecast to 2030
- Products: Market Size And Growth, By Type
- Products: Average Per Capita Consumption, By Type
- Products: Exports And Growth, By Type
- Products: Export Prices And Growth, By Type
- Production Volume And Growth
- Exports And Growth
- Export Prices And Growth
- Market Size And Growth
- Per Capita Consumption
- Imports And Growth
- Import Prices
- Production, In Physical Terms, 2012–2023
- Production, In Value Terms, 2012–2023
- Imports, In Physical Terms, 2012–2023
- Imports, In Value Terms, 2012–2023
- Imports, In Physical Terms, By Country, 2023
- Imports, In Physical Terms, By Country, 2012–2023
- Imports, In Value Terms, By Country, 2012–2023
- Import Prices, By Country Of Origin, 2012–2023
- Exports, In Physical Terms, 2012–2023
- Exports, In Value Terms, 2012–2023
- Exports, In Physical Terms, By Country, 2023
- Exports, In Physical Terms, By Country, 2012–2023
- Exports, In Value Terms, By Country, 2012–2023
- Export Prices, By Country Of Destination, 2012–2023


