Italy - Leather Of Bovine And Equine Animals - Market Analysis, Forecast, Size, Trends And Insights
Get instant access to more than 2 million reports, dashboards, and datasets on the IndexBox Platform.
View PricingItaly's Exports of Bovine Leather into China Continues to Decline
IndexBox has just published a new report: 'Italy - Leather Of Bovine And Equine Animals - Market Analysis, Forecast, Size, Trends And Insights'. Here is a summary of the report's key findings.
The revenue of the bovine and equine leather market in Italy amounted to $1.8B in 2018, therefore, remained relatively stable against the previous year. This figure reflects the total revenues of producers and importers (excluding logistics costs, retail marketing costs, and retailers' margins, which will be included in the final consumer price). In general, bovine and equine leather consumption continues to indicate a mild descent. The most prominent rate of growth was recorded in 2013 with an increase of 43% against the previous year. Bovine and equine leather consumption peaked at $2.4B in 2014; however, from 2015 to 2018, consumption stood at a somewhat lower figure.
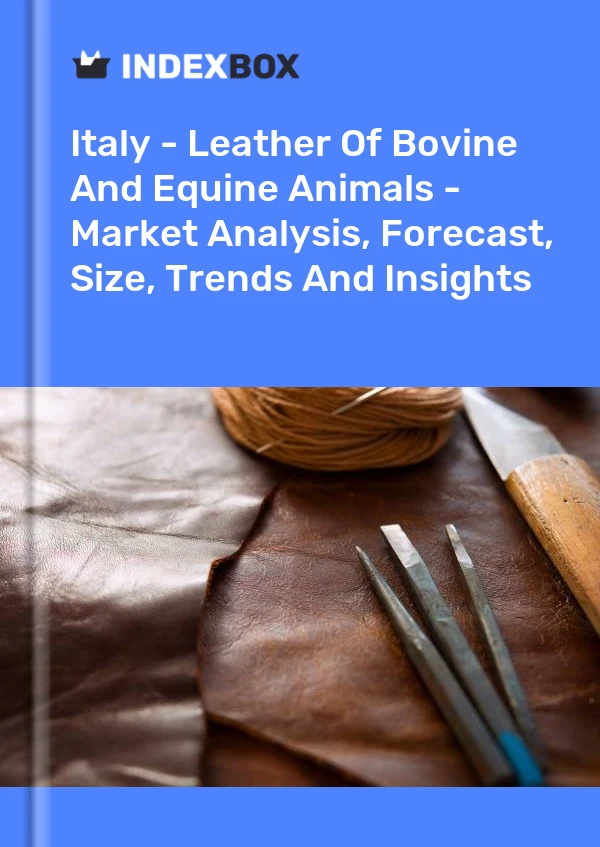
Production in Italy
In 2018, the amount of leather of bovine and equine animals produced in Italy totaled 428K tons, falling by -7.4% against the previous year. Over the period under review, bovine and equine leather production continues to indicate a mild contraction. The most prominent rate of growth was recorded in 2013 with an increase of 21% against the previous year. Bovine and equine leather production peaked at 522K tons in 2007; however, from 2008 to 2018, production stood at a somewhat lower figure.
In value terms, bovine and equine leather production amounted to $1.7B in 2018 estimated in export prices. Over the period under review, bovine and equine leather production continues to indicate a slight deduction. The growth pace was the most rapid in 2013 when production volume increased by 44% year-to-year. Bovine and equine leather production peaked at $1.9B in 2007; however, from 2008 to 2018, production stood at a somewhat lower figure.
Exports from Italy
In 2018, the amount of leather of bovine and equine animals exported from Italy amounted to 283K tons, waning by -2.7% against the previous year. Overall, bovine and equine leather exports continue to indicate a significant deduction. The most prominent rate of growth was recorded in 2010 when exports increased by 13% year-to-year. Exports peaked at 410K tons in 2007; however, from 2008 to 2018, exports remained at a lower figure.
In value terms, bovine and equine leather exports stood at $3.5B (IndexBox estimates) in 2018. In general, bovine and equine leather exports continue to indicate a mild decline. The most prominent rate of growth was recorded in 2010 with an increase of 19% year-to-year. Exports peaked at $4.2B in 2014; however, from 2015 to 2018, exports stood at a somewhat lower figure.
Exports by Country
China (92K tons) was the main destination for bovine and equine leather exports from Italy, accounting for a 32% share of total exports. Moreover, bovine and equine leather exports to China exceeded the volume sent to the second major destination, Vietnam (36K tons), threefold. Spain (18K tons) ranked third in terms of total exports with a 6.2% share.
From 2007 to 2018, the average annual rate of growth in terms of volume to China amounted to -1.2%. Exports to the other major destinations recorded the following average annual rates of exports growth: Vietnam (+15.7% per year) and Spain (-3.0% per year).
In value terms, the largest markets for bovine and equine leather exported from Italy were Romania ($284M), China, Hong Kong SAR ($265M) and the U.S. ($247M), with a combined 23% share of total exports. These countries were followed by Vietnam, China, Spain, Poland, France, Germany, Portugal, India and Austria, which together accounted for a further 41%.
In terms of the main countries of destination, Vietnam experienced the highest growth rate of exports, over the last eleven years, while the other leaders experienced more modest paces of growth.
Export Prices by Country
The average bovine and equine leather export price stood at $12,383 per ton in 2018, growing by 5% against the previous year. Over the period from 2007 to 2018, it increased at an average annual rate of +1.9%. The most prominent rate of growth was recorded in 2012 an increase of 21% year-to-year. The export price peaked at $14,278 per ton in 2014; however, from 2015 to 2018, export prices remained at a lower figure.
Prices varied noticeably by the country of destination; the country with the highest price was the U.S. ($33,326 per ton), while the average price for exports to China ($2,238 per ton) was amongst the lowest.
From 2007 to 2018, the most notable rate of growth in terms of prices was recorded for supplies to Romania, while the prices for the other major destinations experienced more modest paces of growth.
Imports into Italy
In 2018, approx. 318K tons of leather of bovine and equine animals were imported into Italy; remaining constant against the previous year. Over the period under review, bovine and equine leather imports continue to indicate a temperate decrease. The pace of growth was the most pronounced in 2010 when imports increased by 19% y-o-y. Over the period under review, bovine and equine leather imports attained their maximum at 441K tons in 2007; however, from 2008 to 2018, imports remained at a lower figure.
In value terms, bovine and equine leather imports amounted to $1.7B (IndexBox estimates) in 2018. Over the period under review, bovine and equine leather imports continue to indicate a moderate reduction. The most prominent rate of growth was recorded in 2010 with an increase of 50% y-o-y. Imports peaked at $2.4B in 2014; however, from 2015 to 2018, imports remained at a lower figure.
Imports by Country
In 2018, Brazil (90K tons) constituted the largest bovine and equine leather supplier to Italy, with a 28% share of total imports. Moreover, bovine and equine leather imports from Brazil exceeded the figures recorded by the second-largest supplier, the U.S. (38K tons), twofold. Paraguay (20K tons) ranked third in terms of total imports with a 6.2% share.
From 2007 to 2018, the average annual rate of growth in terms of volume from Brazil stood at -1.6%. The remaining supplying countries recorded the following average annual rates of imports growth: the U.S. (+0.4% per year) and Paraguay (+15.7% per year).
In value terms, Brazil ($319M), the U.S. ($209M) and Russia ($130M) constituted the largest bovine and equine leather suppliers to Italy, with a combined 40% share of total imports. These countries were followed by New Zealand, the UK, Paraguay, Ukraine, South Africa, Australia, Kenya, Bolivia and Venezuela, which together accounted for a further 18%.
Paraguay experienced the highest growth rate of imports, among the main suppliers over the last eleven years, while the other leaders experienced more modest paces of growth.
Import Prices by Country
The average bovine and equine leather import price stood at $5,216 per ton in 2018, declining by -1.8% against the previous year. In general, the bovine and equine leather import price, however, continues to indicate a relatively flat trend pattern. The growth pace was the most rapid in 2010 an increase of 27% against the previous year. The import price peaked at $5,755 per ton in 2014; however, from 2015 to 2018, import prices stood at a somewhat lower figure.
There were significant differences in the average prices amongst the major supplying countries. In 2018, the country with the highest price was Russia ($10,205 per ton), while the price for Venezuela ($1,538 per ton) was amongst the lowest.
From 2007 to 2018, the most notable rate of growth in terms of prices was attained by Russia, while the prices for the other major suppliers experienced more modest paces of growth.
Join Us at HANNOVER MESSE 2024
Don’t miss your chance to connect with us directly. Schedule a personal meeting to dive deeper into how solutions.
Hall 002, Stand C10. 22 - 26 April 2024 | Hannover, Germany

This report provides an in-depth analysis of the market for bovine and equine leather in Italy. Within it, you will discover the latest data on market trends and opportunities by country, consumption, production and price developments, as well as the global trade (imports and exports). The forecast exhibits the market prospects through 2030.
Product coverage:
- Prodcom 15113100 - Leather, of bovine animals, without hair, whole
- Prodcom 15113200 - Leather, of bovine animals, without hair, not whole
- Prodcom 15113300 - Leather, of equine animals, without hair
Country coverage:
- Italy
Data coverage:
- Market volume and value
- Per Capita consumption
- Forecast of the market dynamics in the medium term
- Trade (exports and imports) in Italy
- Export and import prices
- Market trends, drivers and restraints
- Key market players and their profiles
Reasons to buy this report:
- Take advantage of the latest data
- Find deeper insights into current market developments
- Discover vital success factors affecting the market
This report is designed for manufacturers, distributors, importers, and wholesalers, as well as for investors, consultants and advisors.
In this report, you can find information that helps you to make informed decisions on the following issues:
- How to diversify your business and benefit from new market opportunities
- How to load your idle production capacity
- How to boost your sales on overseas markets
- How to increase your profit margins
- How to make your supply chain more sustainable
- How to reduce your production and supply chain costs
- How to outsource production to other countries
- How to prepare your business for global expansion
While doing this research, we combine the accumulated expertise of our analysts and the capabilities of artificial intelligence. The AI-based platform, developed by our data scientists, constitutes the key working tool for business analysts, empowering them to discover deep insights and ideas from the marketing data.
-
1. INTRODUCTION
Making Data-Driven Decisions to Grow Your Business
- REPORT DESCRIPTION
- RESEARCH METHODOLOGY AND AI PLATFORM
- DATA-DRIVEN DECISIONS FOR YOUR BUSINESS
- GLOSSARY AND SPECIFIC TERMS
-
2. EXECUTIVE SUMMARY
A Quick Overview of Market Performance
- KEY FINDINGS
- MARKET TRENDS This Chapter is Available Only for the Professional Edition PRO
-
3. MARKET OVERVIEW
Understanding the Current State of The Market and Its Prospects
- MARKET SIZE
- MARKET STRUCTURE
- TRADE BALANCE
- PER CAPITA CONSUMPTION
- MARKET FORECAST TO 2030
-
4. MOST PROMISING PRODUCT
Finding New Products to Diversify Your Business
This Chapter is Available Only for the Professional Edition PRO- TOP PRODUCTS TO DIVERSIFY YOUR BUSINESS
- BEST-SELLING PRODUCTS
- MOST CONSUMED PRODUCT
- MOST TRADED PRODUCT
- MOST PROFITABLE PRODUCT FOR EXPORT
-
5. MOST PROMISING SUPPLYING COUNTRIES
Choosing the Best Countries to Establish Your Sustainable Supply Chain
This Chapter is Available Only for the Professional Edition PRO- TOP COUNTRIES TO SOURCE YOUR PRODUCT
- TOP PRODUCING COUNTRIES
- TOP EXPORTING COUNTRIES
- LOW-COST EXPORTING COUNTRIES
-
6. MOST PROMISING OVERSEAS MARKETS
Choosing the Best Countries to Boost Your Exports
This Chapter is Available Only for the Professional Edition PRO- TOP OVERSEAS MARKETS FOR EXPORTING YOUR PRODUCT
- TOP CONSUMING MARKETS
- UNSATURATED MARKETS
- TOP IMPORTING MARKETS
- MOST PROFITABLE MARKETS
7. PRODUCTION
The Latest Trends and Insights into The Industry
- PRODUCTION VOLUME AND VALUE
8. IMPORTS
The Largest Import Supplying Countries
- IMPORTS FROM 2012–2023
- IMPORTS BY COUNTRY
- IMPORT PRICES BY COUNTRY
9. EXPORTS
The Largest Destinations for Exports
- EXPORTS FROM 2012–2023
- EXPORTS BY COUNTRY
- EXPORT PRICES BY COUNTRY
-
10. PROFILES OF MAJOR PRODUCERS
The Largest Producers on The Market and Their Profiles
This Chapter is Available Only for the Professional Edition PRO -
LIST OF TABLES
- Key Findings In 2023
- Market Volume, In Physical Terms, 2012–2023
- Market Value, 2012–2023
- Per Capita Consumption In 2012-2023
- Imports, In Physical Terms, By Country, 2012–2023
- Imports, In Value Terms, By Country, 2012–2023
- Import Prices, By Country Of Origin, 2012–2023
- Exports, In Physical Terms, By Country, 2012–2023
- Exports, In Value Terms, By Country, 2012–2023
- Export Prices, By Country Of Destination, 2012–2023
-
LIST OF FIGURES
- Market Volume, In Physical Terms, 2012–2023
- Market Value, 2012–2023
- Market Structure – Domestic Supply vs. Imports, In Physical Terms, 2012-2023
- Market Structure – Domestic Supply vs. Imports, In Value Terms, 2012-2023
- Trade Balance, In Physical Terms, 2012-2023
- Trade Balance, In Value Terms, 2012-2023
- Per Capita Consumption, 2012-2023
- Market Volume Forecast to 2030
- Market Value Forecast to 2030
- Products: Market Size And Growth, By Type
- Products: Average Per Capita Consumption, By Type
- Products: Exports And Growth, By Type
- Products: Export Prices And Growth, By Type
- Production Volume And Growth
- Exports And Growth
- Export Prices And Growth
- Market Size And Growth
- Per Capita Consumption
- Imports And Growth
- Import Prices
- Production, In Physical Terms, 2012–2023
- Production, In Value Terms, 2012–2023
- Imports, In Physical Terms, 2012–2023
- Imports, In Value Terms, 2012–2023
- Imports, In Physical Terms, By Country, 2023
- Imports, In Physical Terms, By Country, 2012–2023
- Imports, In Value Terms, By Country, 2012–2023
- Import Prices, By Country Of Origin, 2012–2023
- Exports, In Physical Terms, 2012–2023
- Exports, In Value Terms, 2012–2023
- Exports, In Physical Terms, By Country, 2023
- Exports, In Physical Terms, By Country, 2012–2023
- Exports, In Value Terms, By Country, 2012–2023
- Export Prices, By Country Of Destination, 2012–2023


