EU - Electric Accumulators - Market Analysis, Forecast, Size, Trends and Insights
Get instant access to more than 2 million reports, dashboards, and datasets on the IndexBox Platform.
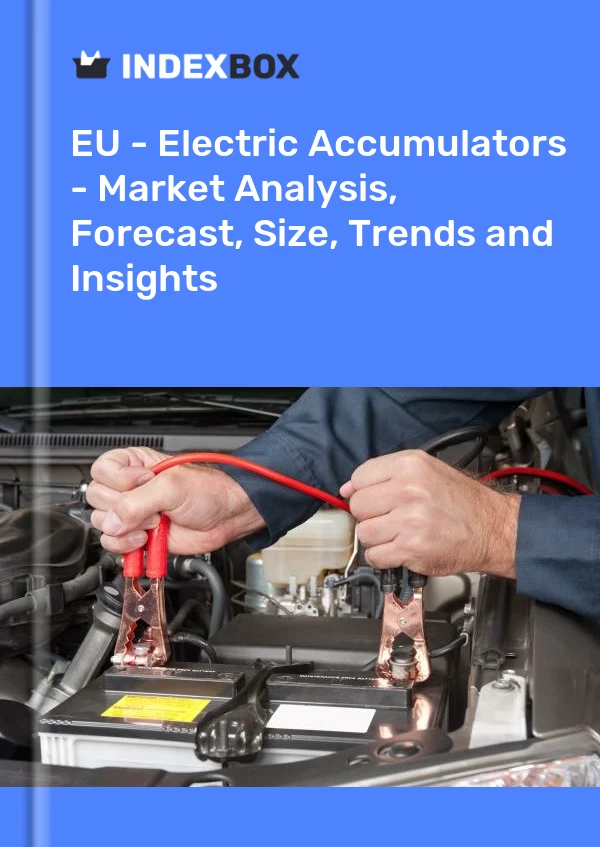
View PricingNew Regulations to Boost Investments into Battery Recycling in the EU
IndexBox has just published a new report: 'EU - Electric Accumulators - Market Analysis, Forecast, Size, Trends and Insights'. Here is a summary of the report's key findings.
The battery market in the EU is expanding on the heels of growth in the electric vehicle and renewable energy industries. In July 2021, the EU instituted new regulations that force battery producers to diminish greenhouse gas emissions throughout all stages of the product lifecycle. Increases in mandatory levels of recovered batteries and the share of recycled materials used in new ones will lead to a critical need for additional recycling capabilities and could drive an investment boom in the market.
Key Trends and Insights
The Global Battery Alliance projects that by 2030 worldwide demand for batteries will increase 14 fold due to the widespread implementation of electric transport methods and deployment in electricity grids. The EU may account for 17% of global demand. In 2030 demand for lithium batteries is forecast to surpass the current amount by a factor of 18, cobalt by 5 and in 2050 by a factor of 60 and 15 respectively.
In July 2021, the EU implemented new regulations to ensure safe use, recycling and disposal of batteries. These regulations could lead to serious changes in the accumulator market. From July 1, 2024, producers selling batteries in the European market will have to provide declarations indicating the carbon footprint created throughout production. Then from July 1, 2027, they must comply with maximum lifecycle carbon footprint thresholds for their products. This will push expenses for producers up as they implement technologies to reduce greenhouse gases. To help companies stay competitive, the new regulations outline developing a plan where governments are obligated to purchase products manufactured with green technologies.
In Europe, over 1.9 million tons of waste batteries are generated annually. The current level of recycled materials in the EU is significantly low: only 12% of aluminium, 22% of cobalt, 8% of manganese, and 16% of nickel used within the EU is recycled. Currently, almost no lithium is recovered in the EU because it is deemed to not be cost-effective.
In accordance with the new regulations, targets are set for recovering metals from waste batteries at 90% for cobalt, copper, lead, and nickel, and 35% for lithium by the end of 2025. By 2030 the recovery level should reach 95% for cobalt, copper, lead and nickel, and 70% for lithium. This will require a significant increase in capacity to recycle batteries and thus provide new opportunities for investors. The sector for lithium is one the fastest growing areas and is forecast to expand by 30% annually, experiencing the highest level of demand for recycling capacity.
Electric Accumulator Imports in the EU
In 2020, approx. 1.2B units of electric accumulators were imported in the EU; with a decrease of -8.1% against the previous year's figure. In value terms, accumulator imports soared to $23.1B (IndexBox estimates) in 2020.
Germany represented the largest importing country with an import of about 386M units, which finished at 33% of total imports. It was distantly followed by Poland (199M units), Hungary (168M units), the Netherlands (96M units), France (65M units) and the Czech Republic (58M units), together achieving a 49% share of total imports. Italy (37M units) followed a long way behind the leaders.
In value terms, Germany ($7.5B) constitutes the largest market for imported electric accumulators in the EU, comprising 32% of total imports. The second position in the ranking was occupied by France ($2.4B), with a 11% share of total imports. It was followed by the Netherlands, with a 6.8% share.
In 2020, the average annual rate of growth in terms of value in Germany totaled +48.6%. The remaining importing countries recorded the following average annual rates of imports growth: France (+1.6% per year) and the Netherlands (+3.4% per year).
The accumulator import price in the EU stood at $20 per unit in 2020, growing by 43% against the previous year. In 2020, the most notable rate of growth in terms of prices was attained by the Czech Republic, while the other leaders experienced more modest paces of growth.
European Imports of Primary Cells and Primary Batteries
Germany represented the major importing country with an import of around 3.1B units, which amounted to 33% of total imports. It was distantly followed by Poland (1,470M units), Belgium (743M units), Romania (624M units), France (605M units), the Netherlands (495M units), Italy (474M units) and Spain (452M units), together constituting a 52% share of total imports.
In value terms, Germany ($534M) constitutes the largest market for imported primary cells and primary batteries in the European Union, comprising 23% of total imports. The second position in the ranking was occupied by France ($238M), with a 10% share of total imports. It was followed by Poland, with a 10% share.
In Germany, the value of battery imports declined by an average annual rate of -2.3% in 2020. The remaining importing countries recorded the following average annual rates of imports growth: France (+10.3% per year) and Poland (+22.0% per year).
Join Us at HANNOVER MESSE 2024
Don’t miss your chance to connect with us directly. Schedule a personal meeting to dive deeper into how solutions.
Hall 002, Stand C10. 22 - 26 April 2024 | Hannover, Germany

This report provides an in-depth analysis of the accumulator market in the EU. Within it, you will discover the latest data on market trends and opportunities by country, consumption, production and price developments, as well as the global trade (imports and exports). The forecast exhibits the market prospects through 2030.
Product coverage:
- Prodcom 27202100 - Lead-acid accumulators for starting piston engines
- Prodcom 27202210 -
- Prodcom 27202250 -
- Prodcom 27202300 - Nickel-cadmium, nickel metal hydride, lithium-ion, lithium polymer, nickel-iron and other electric accumulators
Country coverage:
- Austria
- Belgium
- Bulgaria
- Croatia
- Cyprus
- Czech Republic
- Denmark
- Estonia
- Finland
- France
- Germany
- Greece
- Hungary
- Ireland
- Italy
- Latvia
- Lithuania
- Luxembourg
- Malta
- Netherlands
- Poland
- Portugal
- Romania
- Slovakia
- Slovenia
- Spain
- Sweden
Data coverage:
- Market volume and value
- Per Capita consumption
- Forecast of the market dynamics in the medium term
- Production in the EU, split by region and country
- Trade (exports and imports) in the EU
- Export and import prices
- Market trends, drivers and restraints
- Key market players and their profiles
Reasons to buy this report:
- Take advantage of the latest data
- Find deeper insights into current market developments
- Discover vital success factors affecting the market
This report is designed for manufacturers, distributors, importers, and wholesalers, as well as for investors, consultants and advisors.
In this report, you can find information that helps you to make informed decisions on the following issues:
- How to diversify your business and benefit from new market opportunities
- How to load your idle production capacity
- How to boost your sales on overseas markets
- How to increase your profit margins
- How to make your supply chain more sustainable
- How to reduce your production and supply chain costs
- How to outsource production to other countries
- How to prepare your business for global expansion
While doing this research, we combine the accumulated expertise of our analysts and the capabilities of artificial intelligence. The AI-based platform, developed by our data scientists, constitutes the key working tool for business analysts, empowering them to discover deep insights and ideas from the marketing data.
-
1. INTRODUCTION
Making Data-Driven Decisions to Grow Your Business
- REPORT DESCRIPTION
- RESEARCH METHODOLOGY AND AI PLATFORM
- DATA-DRIVEN DECISIONS FOR YOUR BUSINESS
- GLOSSARY AND SPECIFIC TERMS
-
2. EXECUTIVE SUMMARY
A Quick Overview of Market Performance
- KEY FINDINGS
- MARKET TRENDS This Chapter is Available Only for the Professional Edition PRO
-
3. MARKET OVERVIEW
Understanding the Current State of The Market and Its Prospects
- MARKET SIZE
- CONSUMPTION BY COUNTRY
- MARKET FORECAST TO 2030
-
4. MOST PROMISING PRODUCT
Finding New Products to Diversify Your Business
This Chapter is Available Only for the Professional Edition PRO- TOP PRODUCTS TO DIVERSIFY YOUR BUSINESS
- BEST-SELLING PRODUCTS
- MOST CONSUMED PRODUCT
- MOST TRADED PRODUCT
- MOST PROFITABLE PRODUCT FOR EXPORT
-
5. MOST PROMISING SUPPLYING COUNTRIES
Choosing the Best Countries to Establish Your Sustainable Supply Chain
This Chapter is Available Only for the Professional Edition PRO- TOP COUNTRIES TO SOURCE YOUR PRODUCT
- TOP PRODUCING COUNTRIES
- TOP EXPORTING COUNTRIES
- LOW-COST EXPORTING COUNTRIES
-
6. MOST PROMISING OVERSEAS MARKETS
Choosing the Best Countries to Boost Your Exports
This Chapter is Available Only for the Professional Edition PRO- TOP OVERSEAS MARKETS FOR EXPORTING YOUR PRODUCT
- TOP CONSUMING MARKETS
- UNSATURATED MARKETS
- TOP IMPORTING MARKETS
- MOST PROFITABLE MARKETS
7. PRODUCTION
The Latest Trends and Insights into The Industry
- PRODUCTION VOLUME AND VALUE
- PRODUCTION BY COUNTRY
8. IMPORTS
The Largest Importers on The Market and How They Succeed
- IMPORTS FROM 2012–2023
- IMPORTS BY COUNTRY
- IMPORT PRICES BY COUNTRY
9. EXPORTS
The Largest Exporters on The Market and How They Succeed
- EXPORTS FROM 2012–2023
- EXPORTS BY COUNTRY
- EXPORT PRICES BY COUNTRY
-
10. PROFILES OF MAJOR PRODUCERS
The Largest Producers on The Market and Their Profiles
This Chapter is Available Only for the Professional Edition PRO -
11. COUNTRY PROFILES
The Largest Markets And Their Profiles
This Chapter is Available Only for the Professional Edition PRO- Austria
- Belgium
- Bulgaria
- Croatia
- Cyprus
- Czech Republic
- Denmark
- Estonia
- Finland
- France
- Germany
- Greece
- Hungary
- Ireland
- Italy
- Latvia
- Lithuania
- Luxembourg
- Malta
- Netherlands
- Poland
- Portugal
- Romania
- Slovakia
- Slovenia
- Spain
- Sweden
-
LIST OF TABLES
- Key Findings In 2023
- Market Volume, In Physical Terms, 2012–2023
- Market Value, 2012–2023
- Per Capita Consumption, By Country, 2018–2023
- Production, In Physical Terms, By Country, 2012–2023
- Imports, In Physical Terms, By Country, 2012–2023
- Imports, In Value Terms, By Country, 2012–2023
- Import Prices, By Country Of Destination, 2012–2023
- Exports, In Physical Terms, By Country, 2012–2023
- Exports, In Value Terms, By Country, 2012–2023
- Export Prices, By Country Of Origin, 2012–2023
-
LIST OF FIGURES
- Market Volume, In Physical Terms, 2012–2023
- Market Value, 2012–2023
- Consumption, By Country, 2023
- Market Volume Forecast to 2030
- Market Value Forecast to 2030
- Products: Market Size And Growth, By Type
- Products: Average Per Capita Consumption, By Type
- Products: Exports And Growth, By Type
- Products: Export Prices And Growth, By Type
- Production Volume And Growth
- Exports And Growth
- Export Prices And Growth
- Market Size And Growth
- Per Capita Consumption
- Imports And Growth
- Import Prices
- Production, In Physical Terms, 2012–2023
- Production, In Value Terms, 2012–2023
- Production, By Country, 2023
- Production, In Physical Terms, By Country, 2012–2023
- Imports, In Physical Terms, 2012–2023
- Imports, In Value Terms, 2012–2023
- Imports, In Physical Terms, By Country, 2023
- Imports, In Physical Terms, By Country, 2012–2023
- Imports, In Value Terms, By Country, 2012–2023
- Import Prices, By Country, 2012–2023
- Exports, In Physical Terms, 2012–2023
- Exports, In Value Terms, 2012–2023
- Exports, In Physical Terms, By Country, 2023
- Exports, In Physical Terms, By Country, 2012–2023
- Exports, In Value Terms, By Country, 2012–2023
- Export Prices, 2012–2023


