Indonesia - Outboard Motors for Marine Propulsion - Market Analysis, Forecast, Size, Trends And Insights
Get instant access to more than 2 million reports, dashboards, and datasets on the IndexBox Platform.
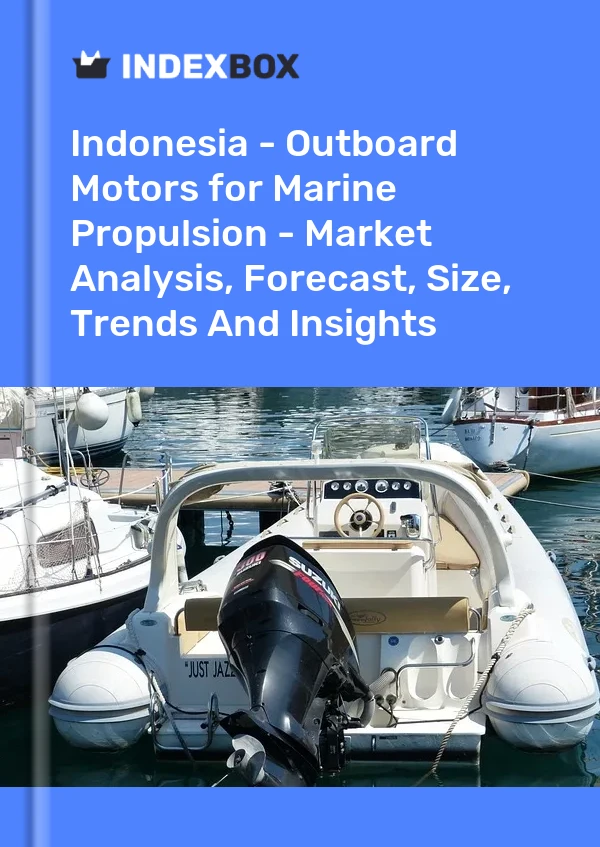
View PricingOutboard Boat Motors Price in Indonesia - 2022
Contents:
- Outboard Boat Motors Price in Indonesia (CIF) - 2022
- Outboard Boat Motors Price in Indonesia (FOB) - 2022
- Outboard Boat Motors Imports in Indonesia
- Outboard Boat Motors Exports in Indonesia
Outboard Boat Motors Price in Indonesia (CIF) - 2022
The average outboard boat motors import price stood at $3,691 per unit in March 2022, leveling off at the previous month. Over the last twelve months, it increased at an average monthly rate of +1.3%. The growth pace was the most rapid in February 2022 an increase of 30% month-to-month. As a result, import price reached the peak level of $3,691 per unit, leveling off in the following month.
Average prices varied noticeably amongst the major supplying countries. In March 2022, the country with the highest price was China ($3,691 per unit), while the price for Thailand ($3,691 per unit) was amongst the lowest.
From March 2021 to March 2022, the most notable rate of growth in terms of prices was attained by Japan (+1.5%), while the prices for the other major suppliers experienced more modest paces of growth.
Outboard Boat Motors Price in Indonesia (FOB) - 2022
In 2022, the average outboard boat motors export price amounted to $5,457 per unit, approximately mirroring the previous year. In general, export price indicated a temperate increase from 2012 to 2022: its price increased at an average annual rate of +3.7% over the last decade. The trend pattern, however, indicated some noticeable fluctuations being recorded throughout the analyzed period. Based on 2022 figures, outboard boat motors export price decreased by -7.9% against 2019 indices. The most prominent rate of growth was recorded in 2019 an increase of 36% against the previous year. As a result, the export price attained the peak level of $5,925 per unit. From 2020 to 2022, the average export prices failed to regain momentum.
Prices varied noticeably by country of destination: amid the top suppliers, the country with the highest price was Timor-Leste ($6,143 per unit), while the average price for exports to China ($2,793 per unit) was amongst the lowest.
From 2012 to 2022, the most notable rate of growth in terms of prices was recorded for supplies to Japan (+20.9%), while the prices for the other major destinations experienced more modest paces of growth.
Outboard Boat Motors Imports in Indonesia
In 2022, purchases abroad of outboard motors for marine propulsion increased by 103% to 12K units for the first time since 2019, thus ending a two-year declining trend. In general, imports, however, continue to indicate a deep reduction. Over the period under review, imports attained the maximum at 16K units in 2019; however, from 2020 to 2022, imports stood at a somewhat lower figure.
In value terms, outboard boat motors imports surged to $62M in 2022. Overall, imports saw notable growth. As a result, imports attained the peak and are likely to continue growth in the immediate term.
| Import of Outboard Boat Motors in Indonesia (Million USD) | |||||
|---|---|---|---|---|---|
| COUNTRY | 2019 | 2020 | 2021 | 2022 | CAGR, 2019-2022 |
| Japan | 51.4 | 26.1 | 19.0 | 54.2 | 1.8% |
| Thailand | 1.5 | 1.4 | 2.0 | 3.4 | 31.4% |
| Singapore | 4.0 | N/A | N/A | 2.3 | -16.8% |
| China | 0.4 | 0.4 | 0.7 | 1.2 | 44.2% |
| United States | 1.1 | 0.4 | 0.1 | 0.9 | -6.5% |
| Others | 0.2 | 0.2 | 0.2 | 0.3 | 14.5% |
| Total | 58.6 | 28.5 | 22.0 | 62.2 | 2.0% |
Top Suppliers of Outboard Boat Motors to Indonesia in 2022:
- Japan (10.6K units)
- Thailand (0.6K units)
- Singapore (0.4K units)
- United States (0.2K units)
- China (0.2K units)
Outboard Boat Motors Exports in Indonesia
In 2022, overseas shipments of outboard motors for marine propulsion decreased by 0% to 62 units, falling for the second consecutive year after two years of growth. In general, exports saw a significant expansion. The most prominent rate of growth was recorded in 2020 when exports increased by 226% against the previous year. As a result, the exports attained the peak of 114 units. From 2021 to 2022, the growth of the exports failed to regain momentum.
In value terms, outboard boat motors exports reached $338K in 2022. Overall, exports posted a buoyant increase. The most prominent rate of growth was recorded in 2020 when exports increased by 191% against the previous year. As a result, the exports reached the peak of $604K. From 2021 to 2022, the growth of the exports remained at a lower figure.
| Export of Outboard Boat Motors in Indonesia (Thousand USD) | |||||
|---|---|---|---|---|---|
| COUNTRY | 2019 | 2020 | 2021 | 2022 | CAGR, 2019-2022 |
| Somalia | 35.8 | 25.1 | 38.3 | 121 | 50.1% |
| Singapore | 2.9 | 24.6 | 36.6 | 116 | 242.0% |
| Nigeria | 34.9 | 19.7 | 26.0 | 81.9 | 32.9% |
| China | 0.1 | 0.1 | 4.4 | 14.0 | 419.2% |
| Timor-Leste | 1.3 | 0.1 | 1.9 | 6.1 | 67.4% |
| Hong Kong SAR | N/A | 212 | N/A | N/A | 0% |
| Vietnam | 64.8 | 11.5 | N/A | N/A | -82.3% |
| Malaysia | N/A | 237 | 115 | N/A | -51.5% |
| Philippines | 59.1 | N/A | 62.8 | N/A | 3.1% |
| United Arab Emirates | N/A | N/A | 31.3 | N/A | 0% |
| Sudan | N/A | 71.4 | N/A | N/A | 0% |
| Others | 8.4 | 3.0 | 17.5 | N/A | 44.3% |
| Total | 207 | 604 | 334 | 338 | 17.8% |
Top Export Markets for Outboard Boat Motors from Indonesia in 2022:
- Somalia (23.0 units)
- Singapore (19.0 units)
- Nigeria (14.0 units)
- China (5.0 units)
- Timor-Leste (1.0 units)
This report provides an in-depth analysis of the outboard boat motors market in Indonesia. Within it, you will discover the latest data on market trends and opportunities by country, consumption, production and price developments, as well as the global trade (imports and exports). The forecast exhibits the market prospects through 2030.
Product coverage:
- Prodcom 28111100 - Marine propulsion spark ignition reciprocating or rotary internal combustion piston engines, outboard motors
Country coverage:
- Indonesia
Data coverage:
- Market volume and value
- Per Capita consumption
- Forecast of the market dynamics in the medium term
- Trade (exports and imports) in Indonesia
- Export and import prices
- Market trends, drivers and restraints
- Key market players and their profiles
Reasons to buy this report:
- Take advantage of the latest data
- Find deeper insights into current market developments
- Discover vital success factors affecting the market
This report is designed for manufacturers, distributors, importers, and wholesalers, as well as for investors, consultants and advisors.
In this report, you can find information that helps you to make informed decisions on the following issues:
- How to diversify your business and benefit from new market opportunities
- How to load your idle production capacity
- How to boost your sales on overseas markets
- How to increase your profit margins
- How to make your supply chain more sustainable
- How to reduce your production and supply chain costs
- How to outsource production to other countries
- How to prepare your business for global expansion
While doing this research, we combine the accumulated expertise of our analysts and the capabilities of artificial intelligence. The AI-based platform, developed by our data scientists, constitutes the key working tool for business analysts, empowering them to discover deep insights and ideas from the marketing data.
-
1. INTRODUCTION
Making Data-Driven Decisions to Grow Your Business
- REPORT DESCRIPTION
- RESEARCH METHODOLOGY AND AI PLATFORM
- DATA-DRIVEN DECISIONS FOR YOUR BUSINESS
- GLOSSARY AND SPECIFIC TERMS
-
2. EXECUTIVE SUMMARY
A Quick Overview of Market Performance
- KEY FINDINGS
- MARKET TRENDS This Chapter is Available Only for the Professional Edition PRO
-
3. MARKET OVERVIEW
Understanding the Current State of The Market and Its Prospects
- MARKET SIZE
- MARKET STRUCTURE
- TRADE BALANCE
- PER CAPITA CONSUMPTION
- MARKET FORECAST TO 2030
-
4. MOST PROMISING PRODUCT
Finding New Products to Diversify Your Business
This Chapter is Available Only for the Professional Edition PRO- TOP PRODUCTS TO DIVERSIFY YOUR BUSINESS
- BEST-SELLING PRODUCTS
- MOST CONSUMED PRODUCT
- MOST TRADED PRODUCT
- MOST PROFITABLE PRODUCT FOR EXPORT
-
5. MOST PROMISING SUPPLYING COUNTRIES
Choosing the Best Countries to Establish Your Sustainable Supply Chain
This Chapter is Available Only for the Professional Edition PRO- TOP COUNTRIES TO SOURCE YOUR PRODUCT
- TOP PRODUCING COUNTRIES
- TOP EXPORTING COUNTRIES
- LOW-COST EXPORTING COUNTRIES
-
6. MOST PROMISING OVERSEAS MARKETS
Choosing the Best Countries to Boost Your Exports
This Chapter is Available Only for the Professional Edition PRO- TOP OVERSEAS MARKETS FOR EXPORTING YOUR PRODUCT
- TOP CONSUMING MARKETS
- UNSATURATED MARKETS
- TOP IMPORTING MARKETS
- MOST PROFITABLE MARKETS
7. PRODUCTION
The Latest Trends and Insights into The Industry
- PRODUCTION VOLUME AND VALUE
8. IMPORTS
The Largest Import Supplying Countries
- IMPORTS FROM 2012–2023
- IMPORTS BY COUNTRY
- IMPORT PRICES BY COUNTRY
9. EXPORTS
The Largest Destinations for Exports
- EXPORTS FROM 2012–2023
- EXPORTS BY COUNTRY
- EXPORT PRICES BY COUNTRY
-
10. PROFILES OF MAJOR PRODUCERS
The Largest Producers on The Market and Their Profiles
This Chapter is Available Only for the Professional Edition PRO -
LIST OF TABLES
- Key Findings In 2023
- Market Volume, In Physical Terms, 2012–2023
- Market Value, 2012–2023
- Per Capita Consumption In 2012-2023
- Imports, In Physical Terms, By Country, 2012–2023
- Imports, In Value Terms, By Country, 2012–2023
- Import Prices, By Country Of Origin, 2012–2023
- Exports, In Physical Terms, By Country, 2012–2023
- Exports, In Value Terms, By Country, 2012–2023
- Export Prices, By Country Of Destination, 2012–2023
-
LIST OF FIGURES
- Market Volume, In Physical Terms, 2012–2023
- Market Value, 2012–2023
- Market Structure – Domestic Supply vs. Imports, In Physical Terms, 2012-2023
- Market Structure – Domestic Supply vs. Imports, In Value Terms, 2012-2023
- Trade Balance, In Physical Terms, 2012-2023
- Trade Balance, In Value Terms, 2012-2023
- Per Capita Consumption, 2012-2023
- Market Volume Forecast to 2030
- Market Value Forecast to 2030
- Products: Market Size And Growth, By Type
- Products: Average Per Capita Consumption, By Type
- Products: Exports And Growth, By Type
- Products: Export Prices And Growth, By Type
- Production Volume And Growth
- Exports And Growth
- Export Prices And Growth
- Market Size And Growth
- Per Capita Consumption
- Imports And Growth
- Import Prices
- Production, In Physical Terms, 2012–2023
- Production, In Value Terms, 2012–2023
- Imports, In Physical Terms, 2012–2023
- Imports, In Value Terms, 2012–2023
- Imports, In Physical Terms, By Country, 2023
- Imports, In Physical Terms, By Country, 2012–2023
- Imports, In Value Terms, By Country, 2012–2023
- Import Prices, By Country Of Origin, 2012–2023
- Exports, In Physical Terms, 2012–2023
- Exports, In Value Terms, 2012–2023
- Exports, In Physical Terms, By Country, 2023
- Exports, In Physical Terms, By Country, 2012–2023
- Exports, In Value Terms, By Country, 2012–2023
- Export Prices, By Country Of Destination, 2012–2023
This report provides an in-depth analysis of the outboard boat motors market in Indonesia.
This report provides an in-depth analysis of the market for internal combustion engine (excl. diesel, moto vehicle and aircraft) in Indonesia.
This report provides an in-depth analysis of the market for aircraft internal combustion engine in Indonesia.
This report provides an in-depth analysis of the motor vehicle engine market in Indonesia.
This report provides an in-depth analysis of the global outboard boat motors market.
This report provides an in-depth analysis of the global market for internal combustion engine (excl. diesel, moto vehicle and aircraft).
This report provides an in-depth analysis of the global market for aircraft internal combustion engine.
This report provides an in-depth analysis of the global motor vehicle engine market.
This report provides an in-depth analysis of the outboard boat motors market in Indonesia.
This report provides an in-depth analysis of the market for internal combustion engine (excl. diesel, moto vehicle and aircraft) in Indonesia.
Discover the top import markets for outboard boat motors around the world, backed by key statistics from the IndexBox market intelligence platform.
Discover the world's best import markets for internal combustion engines (excl. diesel, moto vehicle, and aircraft) with key statistics and numbers. Explore the top countries and their import values in 2022.
In value terms, parts suitable for use solely imports totaled $X in 2016. In general, parts suitable for use solely imports continue to indicate a relatively flat trend pattern. Over the period unde...
In value terms, engines and motors imports totaled $X in 2016. Overall, it indicated a strong growth from 2007 to 2016: the total imports value increased at an average annual rate of +X% over the ...
In value terms, parts suitable for use solely exports stood at $X in 2016. The total export value increased at an average annual rate of +X% over the period from 2007 to 2016; however, the trend p...
In value terms, engines and motors exports totaled $X in 2016. Overall, it indicated a strong growth from 2007 to 2016: the total exports value increased at an average annual rate of +X% over the ...
In 2016, the amount of internal combustion engine imported worldwide stood at X tons, growing by X% against the previous year figure. Overall, it indicated a remarkable increase from 2007 to 2016: ...
In 2016, the amount of internal combustion engine imported worldwide stood at X tons, growing by X% against the previous year figure. Overall, it indicated a remarkable increase from 2007 to 2016: ...
Explore the top 10 import markets for motor vehicle engines based on their import value, including the United States, Germany, Canada, and more. Find key data and statistics on the global trade in motor vehicle engines.
In value terms, motor vehicles, parts and accessories imports amounted to $X in 2016. The total import value increased at an average annual rate of +X% over the period from 2007 to 2016; the tren...


