World - Cocoa Butter - Market Analysis, Forecast, Size, Trends And Insights
Get instant access to more than 2 million reports, dashboards, and datasets on the IndexBox Platform.
View PricingCocoa Butter in Food
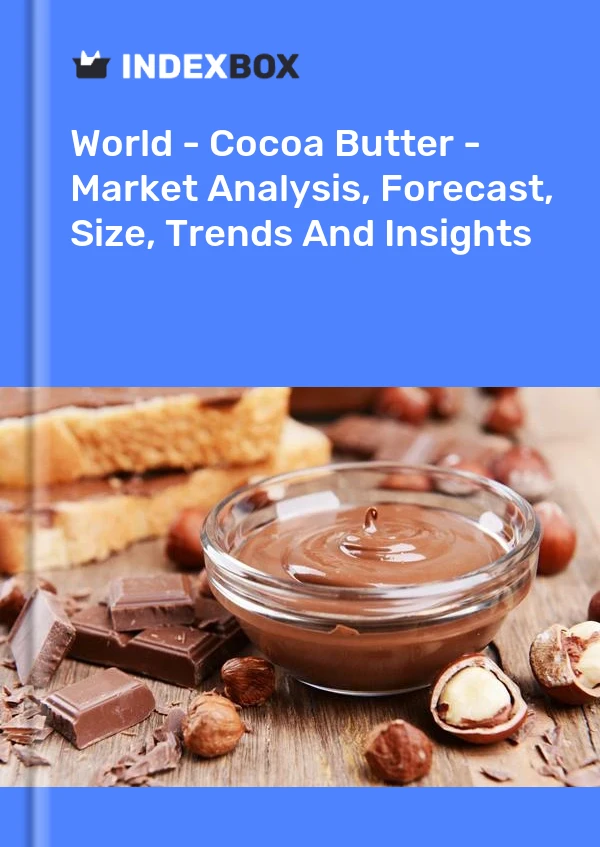
Cocoa butter is a natural fat that is derived from cocoa beans. It is commonly used in the food industry due to its unique properties and flavor. Cocoa butter is a key ingredient in chocolate, giving it its smooth and creamy texture. It is also used in a variety of other food products such as baked goods, ice cream, and confections.
One of the main reasons cocoa butter is used in food is because of its melting point. It has a melting point just below body temperature, which allows chocolate to melt easily in the mouth, giving it a desirable mouthfeel. This property also makes it an ideal ingredient for creating smooth and velvety textures in other food products.
In addition to its melting point, cocoa butter also has a unique flavor profile. It has a mild, yet distinct taste that enhances the flavor of chocolate and other food products. The flavor of cocoa butter is often described as rich and chocolatey, adding depth and complexity to the overall taste.
Cocoa butter is also known for its smooth and glossy appearance. When used in chocolate, it gives the finished product a desirable sheen and snap. It helps create a smooth and even coating on candies and confections, giving them an attractive and professional look.
In terms of nutritional value, cocoa butter is high in calories and fat. It is primarily composed of saturated fats, which are known to raise cholesterol levels when consumed in excess. However, cocoa butter also contains small amounts of stearic acid, which has been found to have neutral or even potentially beneficial effects on cholesterol levels.
There are also some health benefits associated with cocoa butter. It is rich in antioxidants, specifically polyphenols, which have been shown to have various health benefits including reducing inflammation and improving heart health. Cocoa butter also contains vitamins E and K, which are important for maintaining healthy skin and promoting proper blood clotting.
Overall, cocoa butter is a versatile and widely used ingredient in the food industry. Its unique properties and flavor make it an essential component in creating delicious and aesthetically pleasing food products, particularly chocolate. While it is high in calories and fat, it also offers some potential health benefits when consumed in moderation.
This report provides an in-depth analysis of the global cocoa butter market. Within it, you will discover the latest data on market trends and opportunities by country, consumption, production and price developments, as well as the global trade (imports and exports). The forecast exhibits the market prospects through 2030.
Product coverage:
- FCL 664 - Cocoa Butter
Country coverage:
Worldwide - the report contains statistical data for 200 countries and includes detailed profiles of the 50 largest consuming countries:
- USA
- China
- Japan
- Germany
- United Kingdom
- France
- Brazil
- Italy
- Russian Federation
- India
- Canada
- Australia
- Republic of Korea
- Spain
- Mexico
- Indonesia
- Netherlands
- Turkey
- Saudi Arabia
- Switzerland
- Sweden
- Nigeria
- Poland
- Belgium
- Argentina
- Norway
- Austria
- Thailand
- United Arab Emirates
- Colombia
- Denmark
- South Africa
- Malaysia
- Israel
- Singapore
- Egypt
- Philippines
- Finland
- Chile
- Ireland
- Pakistan
- Greece
- Portugal
- Kazakhstan
- Algeria
- Czech Republic
- Qatar
- Peru
- Romania
- Vietnam
+ the largest producing countries
Data coverage:
- Global market volume and value
- Per Capita consumption
- Forecast of the market dynamics in the medium term
- Global production, split by region and country
- Global trade (exports and imports)
- Export and import prices
- Market trends, drivers and restraints
- Key market players and their profiles
Reasons to buy this report:
- Take advantage of the latest data
- Find deeper insights into current market developments
- Discover vital success factors affecting the market
This report is designed for manufacturers, distributors, importers, and wholesalers, as well as for investors, consultants and advisors.
In this report, you can find information that helps you to make informed decisions on the following issues:
- How to diversify your business and benefit from new market opportunities
- How to load your idle production capacity
- How to boost your sales on overseas markets
- How to increase your profit margins
- How to make your supply chain more sustainable
- How to reduce your production and supply chain costs
- How to outsource production to other countries
- How to prepare your business for global expansion
While doing this research, we combine the accumulated expertise of our analysts and the capabilities of artificial intelligence. The AI-based platform, developed by our data scientists, constitutes the key working tool for business analysts, empowering them to discover deep insights and ideas from the marketing data.
-
1. INTRODUCTION
Making Data-Driven Decisions to Grow Your Business
- REPORT DESCRIPTION
- RESEARCH METHODOLOGY AND AI PLATFORM
- DATA-DRIVEN DECISIONS FOR YOUR BUSINESS
- GLOSSARY AND SPECIFIC TERMS
-
2. EXECUTIVE SUMMARY
A Quick Overview of Market Performance
- KEY FINDINGS
- MARKET TRENDS This Chapter is Available Only for the Professional Edition PRO
-
3. MARKET OVERVIEW
Understanding the Current State of The Market and Its Prospects
- MARKET SIZE
- CONSUMPTION BY COUNTRY
- MARKET FORECAST TO 2030
-
4. MOST PROMISING PRODUCT
Finding New Products to Diversify Your Business
This Chapter is Available Only for the Professional Edition PRO- TOP PRODUCTS TO DIVERSIFY YOUR BUSINESS
- BEST-SELLING PRODUCTS
- MOST CONSUMED PRODUCT
- MOST TRADED PRODUCT
- MOST PROFITABLE PRODUCT FOR EXPORT
-
5. MOST PROMISING SUPPLYING COUNTRIES
Choosing the Best Countries to Establish Your Sustainable Supply Chain
This Chapter is Available Only for the Professional Edition PRO- TOP COUNTRIES TO SOURCE YOUR PRODUCT
- TOP PRODUCING COUNTRIES
- TOP EXPORTING COUNTRIES
- LOW-COST EXPORTING COUNTRIES
-
6. MOST PROMISING OVERSEAS MARKETS
Choosing the Best Countries to Boost Your Exports
This Chapter is Available Only for the Professional Edition PRO- TOP OVERSEAS MARKETS FOR EXPORTING YOUR PRODUCT
- TOP CONSUMING MARKETS
- UNSATURATED MARKETS
- TOP IMPORTING MARKETS
- MOST PROFITABLE MARKETS
7. GLOBAL PRODUCTION
The Latest Trends and Insights into The Industry
- PRODUCTION VOLUME AND VALUE
- PRODUCTION BY COUNTRY
8. GLOBAL IMPORTS
The Largest Importers on The Market and How They Succeed
- IMPORTS FROM 2012–2023
- IMPORTS BY COUNTRY
- IMPORT PRICES BY COUNTRY
9. GLOBAL EXPORTS
The Largest Exporters on The Market and How They Succeed
- EXPORTS FROM 2012–2023
- EXPORTS BY COUNTRY
- EXPORT PRICES BY COUNTRY
-
10. PROFILES OF MAJOR PRODUCERS
The Largest Producers on The Market and Their Profiles
This Chapter is Available Only for the Professional Edition PRO -
11. COUNTRY PROFILES
The Largest Markets And Their Profiles
This Chapter is Available Only for the Professional Edition PRO- United States
- China
- Japan
- Germany
- United Kingdom
- France
- Brazil
- Italy
- Russian Federation
- India
- Canada
- Australia
- Republic of Korea
- Spain
- Mexico
- Indonesia
- Netherlands
- Turkey
- Saudi Arabia
- Switzerland
- Sweden
- Nigeria
- Poland
- Belgium
- Argentina
- Norway
- Austria
- Thailand
- United Arab Emirates
- Colombia
- Denmark
- South Africa
- Malaysia
- Israel
- Singapore
- Egypt
- Philippines
- Finland
- Chile
- Ireland
- Pakistan
- Greece
- Portugal
- Kazakhstan
- Algeria
- Czech Republic
- Qatar
- Peru
- Romania
- Vietnam
-
LIST OF TABLES
- Key Findings In 2023
- Market Volume, In Physical Terms, 2012–2023
- Market Value, 2012–2023
- Per Capita Consumption, By Country, 2018–2023
- Production, In Physical Terms, By Country, 2012–2023
- Imports, In Physical Terms, By Country, 2012–2023
- Imports, In Value Terms, By Country, 2012–2023
- Import Prices, By Country Of Destination, 2012–2023
- Exports, In Physical Terms, By Country, 2012–2023
- Exports, In Value Terms, By Country, 2012–2023
- Export Prices, By Country Of Origin, 2012–2023
-
LIST OF FIGURES
- Market Volume, In Physical Terms, 2012–2023
- Market Value, 2012–2023
- Consumption, By Country, 2023
- Market Volume Forecast to 2030
- Market Value Forecast to 2030
- Products: Market Size And Growth, By Type
- Products: Average Per Capita Consumption, By Type
- Products: Exports And Growth, By Type
- Products: Export Prices And Growth, By Type
- Production Volume And Growth
- Exports And Growth
- Export Prices And Growth
- Market Size And Growth
- Per Capita Consumption
- Imports And Growth
- Import Prices
- Production, In Physical Terms, 2012–2023
- Production, In Value Terms, 2012–2023
- Production, By Country, 2023
- Production, In Physical Terms, By Country, 2012–2023
- Imports, In Physical Terms, 2012–2023
- Imports, In Value Terms, 2012–2023
- Imports, In Physical Terms, By Country, 2023
- Imports, In Physical Terms, By Country, 2012–2023
- Imports, In Value Terms, By Country, 2012–2023
- Import Prices, By Country, 2012–2023
- Exports, In Physical Terms, 2012–2023
- Exports, In Value Terms, 2012–2023
- Exports, In Physical Terms, By Country, 2023
- Exports, In Physical Terms, By Country, 2012–2023
- Exports, In Value Terms, By Country, 2012–2023
- Export Prices, 2012–2023
Global cocoa butter imports totaled X tons in 2016, dropping by -X% against the previous year figure. The total import volume increased at an average annual rate of +X% from 2007 to 2016- how...
Global cocoa butter imports totaled X tons in 2016, dropping by -X% against the previous year figure. The total import volume increased at an average annual rate of +X% from 2007 to 2016- how...
The global cocoa butter trade fluctuated mildly over the period under review. A slight drop in 2009 was followed by recovery in 2010 and another decline over 2011-2012. After increasing in 2013 and 2014, exports slightly decreased again in 2015, amount
Malaysia is one of the leaders in the global cocoa butter trade. In 2014, Malaysia exported X thousand tons of cocoa butter totaling X million USD, X% over the previous year. Its primary trading partner was the U.S., where it supplied X% of its


