World - Zinc Ores And Concentrates - Market Analysis, Forecast, Size, Trends And Insights
Get instant access to more than 2 million reports, dashboards, and datasets on the IndexBox Platform.
View PricingGlobal Zinc Ores and Concentrates Market Expected to Reach $27.1B by 2030 with +2.4% CAGR in Volume
IndexBox has just published a new report: World - Zinc Ores And Concentrates - Market Analysis, Forecast, Size, Trends And Insights.
The article highlights the increasing global demand for zinc ores and concentrates, with projections for growth in market volume and value by 2030. It provides detailed insights into consumption, production, imports, and exports of zinc ores and concentrates, including key trends in major consuming and producing countries. The data reveals fluctuations in market performance over the past decade, with notable increases in consumption and production levels, as well as shifts in import and export trends.
Market Forecast
Market Forecast
Driven by increasing demand for zinc ores and concentrates worldwide, the market is expected to continue an upward consumption trend over the next seven-year period. Market performance is forecast to decelerate, expanding with an anticipated CAGR of +2.4% for the period from 2023 to 2030, which is projected to bring the market volume to 26M tons by the end of 2030.
In value terms, the market is forecast to increase with an anticipated CAGR of +4.1% for the period from 2023 to 2030, which is projected to bring the market value to $27.1B (in nominal prices) by the end of 2030.
Consumption
Consumption
In 2023, global consumption of zinc ores and concentrates totaled 22M tons, increasing by 2.6% against the previous year's figure. The total consumption volume increased at an average annual rate of +3.4% from 2013 to 2023; however, the trend pattern indicated some noticeable fluctuations being recorded throughout the analyzed period. Over the period under review, global consumption hit record highs in 2023 and is expected to retain growth in the immediate term.
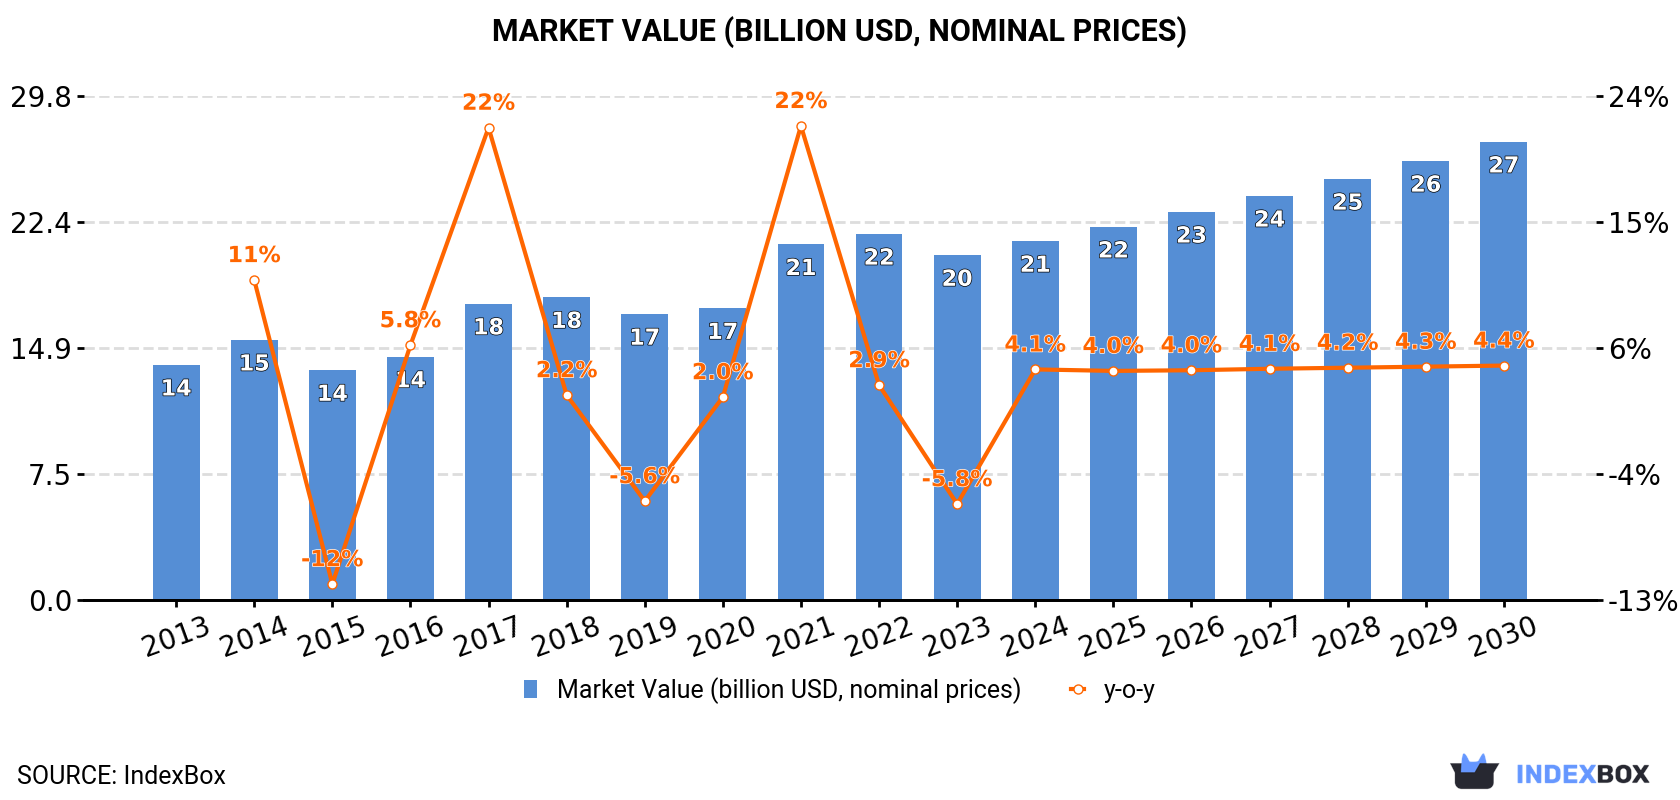
The global zinc ores and concentrates market revenue contracted to $20.4B in 2023, which is down by -5.8% against the previous year. This figure reflects the total revenues of producers and importers (excluding logistics costs, retail marketing costs, and retailers' margins, which will be included in the final consumer price). Overall, the total consumption indicated a tangible increase from 2013 to 2023: its value increased at an average annual rate of +3.9% over the last decade. The trend pattern, however, indicated some noticeable fluctuations being recorded throughout the analyzed period. Global consumption peaked at $21.6B in 2022, and then contracted in the following year.
Consumption By Country
The countries with the highest volumes of consumption in 2023 were China (4.7M tons), India (4.4M tons) and South Korea (1.7M tons), together accounting for 48% of global consumption. Australia, Peru, Japan, Ireland, Spain, Mexico, Canada, Kazakhstan, Finland and Bolivia lagged somewhat behind, together accounting for a further 33%.
From 2013 to 2023, the biggest increases were recorded for Ireland (with a CAGR of +23.8%), while consumption for the other global leaders experienced more modest paces of growth.
In value terms, the largest zinc ores and concentrates markets worldwide were China ($3.8B), India ($2.8B) and South Korea ($1.9B), with a combined 42% share of the global market. Canada, Australia, Ireland, Spain, Mexico, Japan, Bolivia, Finland, Kazakhstan and Peru lagged somewhat behind, together accounting for a further 36%.
Ireland, with a CAGR of +29.6%, recorded the highest growth rate of market size in terms of the main consuming countries over the period under review, while market for the other global leaders experienced more modest paces of growth.
The countries with the highest levels of zinc ores and concentrates per capita consumption in 2023 were Ireland (139 kg per person), Finland (93 kg per person) and Australia (59 kg per person).
From 2013 to 2023, the most notable rate of growth in terms of consumption, amongst the main consuming countries, was attained by Ireland (with a CAGR of +22.6%), while consumption for the other global leaders experienced more modest paces of growth.
Production
Production
Global zinc ores and concentrates production totaled 20M tons in 2023, remaining stable against the previous year's figure. The total output volume increased at an average annual rate of +2.1% from 2013 to 2023; the trend pattern remained consistent, with only minor fluctuations throughout the analyzed period. The most prominent rate of growth was recorded in 2015 when the production volume increased by 6.5% against the previous year. Global production peaked in 2023 and is likely to continue growth in years to come.
In value terms, zinc ores and concentrates production stood at $16.1B in 2023 estimated in export price. Over the period under review, the total production indicated a buoyant increase from 2013 to 2023: its value increased at an average annual rate of +5.3% over the last decade. The trend pattern, however, indicated some noticeable fluctuations being recorded throughout the analyzed period. Based on 2023 figures, production decreased by -5.2% against 2021 indices. The most prominent rate of growth was recorded in 2017 with an increase of 56% against the previous year. Over the period under review, global production reached the peak level at $17B in 2021; however, from 2022 to 2023, production remained at a lower figure.
Production By Country
The countries with the highest volumes of production in 2023 were India (4.4M tons), Australia (3.3M tons) and Peru (2.2M tons), together comprising 49% of global production. Bolivia, Turkey, the United States, Mexico, Ireland, Kazakhstan, Sweden, South Africa and Portugal lagged somewhat behind, together accounting for a further 34%.
From 2013 to 2023, the biggest increases were recorded for Portugal (with a CAGR of +14.8%), while production for the other global leaders experienced more modest paces of growth.
Imports
Imports
In 2023, overseas purchases of zinc ores and concentrates were finally on the rise to reach 13M tons for the first time since 2020, thus ending a two-year declining trend. The total import volume increased at an average annual rate of +2.8% from 2013 to 2023; however, the trend pattern indicated some noticeable fluctuations being recorded throughout the analyzed period. The most prominent rate of growth was recorded in 2020 when imports increased by 16%. As a result, imports reached the peak of 13M tons. From 2021 to 2023, the growth of global imports remained at a somewhat lower figure.
In value terms, zinc ores and concentrates imports reduced markedly to $12.6B in 2023. In general, imports continue to indicate strong growth. The growth pace was the most rapid in 2017 when imports increased by 54% against the previous year. Over the period under review, global imports attained the peak figure at $15.7B in 2022, and then dropped sharply in the following year.
Imports By Country
China was the largest importing country with an import of about 4.7M tons, which recorded 37% of total imports. South Korea (1,755K tons) ranks second in terms of the total imports with a 14% share, followed by Belgium (7.7%), Spain (6.4%), Japan (5.8%) and Finland (4.9%). Canada (560K tons), the Netherlands (439K tons), Norway (298K tons), France (251K tons) and Australia (218K tons) followed a long way behind the leaders.
China was also the fastest-growing in terms of the zinc ores and concentrates imports, with a CAGR of +8.9% from 2013 to 2023. At the same time, Belgium (+8.5%), Canada (+5.2%), Norway (+2.3%) and Finland (+1.3%) displayed positive paces of growth. South Korea, Spain and the Netherlands experienced a relatively flat trend pattern. By contrast, Australia (-1.3%), France (-2.0%) and Japan (-3.0%) illustrated a downward trend over the same period. From 2013 to 2023, the share of China and Belgium increased by +16 and +3.2 percentage points, respectively. The shares of the other countries remained relatively stable throughout the analyzed period.
In value terms, China ($3.9B), South Korea ($2.2B) and Belgium ($1.1B) were the countries with the highest levels of imports in 2023, with a combined 58% share of global imports.
Belgium, with a CAGR of +13.0%, saw the highest growth rate of the value of imports, in terms of the main importing countries over the period under review, while purchases for the other global leaders experienced more modest paces of growth.
Import Prices By Country
The average zinc ores and concentrates import price stood at $994 per ton in 2023, dropping by -20.7% against the previous year. In general, import price indicated a measured increase from 2013 to 2023: its price increased at an average annual rate of +3.0% over the last decade. The trend pattern, however, indicated some noticeable fluctuations being recorded throughout the analyzed period. The pace of growth was the most pronounced in 2021 when the average import price increased by 49%. Over the period under review, average import prices attained the peak figure at $1,254 per ton in 2022, and then dropped dramatically in the following year.
Prices varied noticeably by country of destination: amid the top importers, the country with the highest price was the Netherlands ($1,317 per ton), while Norway ($842 per ton) was amongst the lowest.
From 2013 to 2023, the most notable rate of growth in terms of prices was attained by the Netherlands (+6.6%), while the other global leaders experienced more modest paces of growth.
Exports
Exports
Global zinc ores and concentrates exports dropped modestly to 11M tons in 2023, which is down by -2.9% compared with the previous year. Over the period under review, exports, however, continue to indicate a relatively flat trend pattern. The most prominent rate of growth was recorded in 2018 with an increase of 12% against the previous year. As a result, the exports reached the peak of 11M tons. From 2019 to 2023, the growth of the global exports failed to regain momentum.
In value terms, zinc ores and concentrates exports shrank significantly to $10.9B in 2023. In general, total exports indicated tangible growth from 2013 to 2023: its value increased at an average annual rate of +4.6% over the last decade. The trend pattern, however, indicated some noticeable fluctuations being recorded throughout the analyzed period. The pace of growth was the most pronounced in 2017 when exports increased by 57%. Over the period under review, the global exports reached the maximum at $13.8B in 2022, and then dropped markedly in the following year.
Exports By Country
In 2023, Australia (2M tons) and Peru (1.5M tons) were the key exporters of zinc ores and concentratesacross the globe, together mixing up 33% of total exports. Turkey (871K tons) ranks next in terms of the total exports with an 8.3% share, followed by the United States (6.1%), Belgium (6%) and Bolivia (5.4%). Portugal (440K tons), South Africa (436K tons), Russia (368K tons), Sweden (343K tons), Kazakhstan (303K tons), Eritrea (253K tons) and Mexico (203K tons) held a relatively small share of total exports.
From 2013 to 2023, the biggest increases were recorded for Russia (with a CAGR of +20.6%), while shipments for the other global leaders experienced more modest paces of growth.
In value terms, Peru ($1.6B), Australia ($1.4B) and Bolivia ($1.3B) were the countries with the highest levels of exports in 2023, together comprising 40% of global exports. The United States, Belgium, Russia, Turkey, Sweden, Eritrea, South Africa, Portugal, Kazakhstan and Mexico lagged somewhat behind, together accounting for a further 42%.
Among the main exporting countries, Russia, with a CAGR of +30.4%, recorded the highest rates of growth with regard to the value of exports, over the period under review, while shipments for the other global leaders experienced more modest paces of growth.
Export Prices By Country
In 2023, the average zinc ores and concentrates export price amounted to $1,032 per ton, shrinking by -18.8% against the previous year. In general, export price indicated a measured increase from 2013 to 2023: its price increased at an average annual rate of +4.0% over the last decade. The trend pattern, however, indicated some noticeable fluctuations being recorded throughout the analyzed period. The most prominent rate of growth was recorded in 2021 an increase of 47%. The global export price peaked at $1,270 per ton in 2022, and then declined remarkably in the following year.
Prices varied noticeably by country of origin: amid the top suppliers, the country with the highest price was Bolivia ($2,326 per ton), while Turkey ($416 per ton) was amongst the lowest.
From 2013 to 2023, the most notable rate of growth in terms of prices was attained by Bolivia (+8.7%), while the other global leaders experienced more modest paces of growth.
This report provides an in-depth analysis of the global market for zinc ores and concentrates. Within it, you will discover the latest data on market trends and opportunities by country, consumption, production and price developments, as well as the global trade (imports and exports). The forecast exhibits the market prospects through 2030.
Product coverage:
- Prodcom 07291520 -
Country coverage:
Worldwide - the report contains statistical data for 200 countries and includes detailed profiles of the 50 largest consuming countries:
- USA
- China
- Japan
- Germany
- United Kingdom
- France
- Brazil
- Italy
- Russian Federation
- India
- Canada
- Australia
- Republic of Korea
- Spain
- Mexico
- Indonesia
- Netherlands
- Turkey
- Saudi Arabia
- Switzerland
- Sweden
- Nigeria
- Poland
- Belgium
- Argentina
- Norway
- Austria
- Thailand
- United Arab Emirates
- Colombia
- Denmark
- South Africa
- Malaysia
- Israel
- Singapore
- Egypt
- Philippines
- Finland
- Chile
- Ireland
- Pakistan
- Greece
- Portugal
- Kazakhstan
- Algeria
- Czech Republic
- Qatar
- Peru
- Romania
- Vietnam
+ the largest producing countries
Data coverage:
- Global market volume and value
- Per Capita consumption
- Forecast of the market dynamics in the medium term
- Global production, split by region and country
- Global trade (exports and imports)
- Export and import prices
- Market trends, drivers and restraints
- Key market players and their profiles
Company coverage:
Reasons to buy this report:
- Take advantage of the latest data
- Find deeper insights into current market developments
- Discover vital success factors affecting the market
This report is designed for manufacturers, distributors, importers, and wholesalers, as well as for investors, consultants and advisors.
In this report, you can find information that helps you to make informed decisions on the following issues:
- How to diversify your business and benefit from new market opportunities
- How to load your idle production capacity
- How to boost your sales on overseas markets
- How to increase your profit margins
- How to make your supply chain more sustainable
- How to reduce your production and supply chain costs
- How to outsource production to other countries
- How to prepare your business for global expansion
While doing this research, we combine the accumulated expertise of our analysts and the capabilities of artificial intelligence. The AI-based platform, developed by our data scientists, constitutes the key working tool for business analysts, empowering them to discover deep insights and ideas from the marketing data.
-
1. INTRODUCTION
Making Data-Driven Decisions to Grow Your Business
- REPORT DESCRIPTION
- RESEARCH METHODOLOGY AND AI PLATFORM
- DATA-DRIVEN DECISIONS FOR YOUR BUSINESS
- GLOSSARY AND SPECIFIC TERMS
-
2. EXECUTIVE SUMMARY
A Quick Overview of Market Performance
- KEY FINDINGS
- MARKET TRENDS This Chapter is Available Only for the Professional Edition PRO
-
3. MARKET OVERVIEW
Understanding the Current State of The Market and Its Prospects
- MARKET SIZE
- CONSUMPTION BY COUNTRY
- MARKET FORECAST TO 2030
-
4. MOST PROMISING PRODUCT
Finding New Products to Diversify Your Business
This Chapter is Available Only for the Professional Edition PRO- TOP PRODUCTS TO DIVERSIFY YOUR BUSINESS
- BEST-SELLING PRODUCTS
- MOST CONSUMED PRODUCT
- MOST TRADED PRODUCT
- MOST PROFITABLE PRODUCT FOR EXPORT
-
5. MOST PROMISING SUPPLYING COUNTRIES
Choosing the Best Countries to Establish Your Sustainable Supply Chain
This Chapter is Available Only for the Professional Edition PRO- TOP COUNTRIES TO SOURCE YOUR PRODUCT
- TOP PRODUCING COUNTRIES
- TOP EXPORTING COUNTRIES
- LOW-COST EXPORTING COUNTRIES
-
6. MOST PROMISING OVERSEAS MARKETS
Choosing the Best Countries to Boost Your Exports
This Chapter is Available Only for the Professional Edition PRO- TOP OVERSEAS MARKETS FOR EXPORTING YOUR PRODUCT
- TOP CONSUMING MARKETS
- UNSATURATED MARKETS
- TOP IMPORTING MARKETS
- MOST PROFITABLE MARKETS
7. GLOBAL PRODUCTION
The Latest Trends and Insights into The Industry
- PRODUCTION VOLUME AND VALUE
- PRODUCTION BY COUNTRY
8. GLOBAL IMPORTS
The Largest Importers on The Market and How They Succeed
- IMPORTS FROM 2012–2023
- IMPORTS BY COUNTRY
- IMPORT PRICES BY COUNTRY
9. GLOBAL EXPORTS
The Largest Exporters on The Market and How They Succeed
- EXPORTS FROM 2012–2023
- EXPORTS BY COUNTRY
- EXPORT PRICES BY COUNTRY
-
10. PROFILES OF MAJOR PRODUCERS
The Largest Producers on The Market and Their Profiles
This Chapter is Available Only for the Professional Edition PRO -
11. COUNTRY PROFILES
The Largest Markets And Their Profiles
This Chapter is Available Only for the Professional Edition PRO- United States
- China
- Japan
- Germany
- United Kingdom
- France
- Brazil
- Italy
- Russian Federation
- India
- Canada
- Australia
- Republic of Korea
- Spain
- Mexico
- Indonesia
- Netherlands
- Turkey
- Saudi Arabia
- Switzerland
- Sweden
- Nigeria
- Poland
- Belgium
- Argentina
- Norway
- Austria
- Thailand
- United Arab Emirates
- Colombia
- Denmark
- South Africa
- Malaysia
- Israel
- Singapore
- Egypt
- Philippines
- Finland
- Chile
- Ireland
- Pakistan
- Greece
- Portugal
- Kazakhstan
- Algeria
- Czech Republic
- Qatar
- Peru
- Romania
- Vietnam
-
LIST OF TABLES
- Key Findings In 2023
- Market Volume, In Physical Terms, 2012–2023
- Market Value, 2012–2023
- Per Capita Consumption, By Country, 2018–2023
- Production, In Physical Terms, By Country, 2012–2023
- Imports, In Physical Terms, By Country, 2012–2023
- Imports, In Value Terms, By Country, 2012–2023
- Import Prices, By Country Of Destination, 2012–2023
- Exports, In Physical Terms, By Country, 2012–2023
- Exports, In Value Terms, By Country, 2012–2023
- Export Prices, By Country Of Origin, 2012–2023
-
LIST OF FIGURES
- Market Volume, In Physical Terms, 2012–2023
- Market Value, 2012–2023
- Consumption, By Country, 2023
- Market Volume Forecast to 2030
- Market Value Forecast to 2030
- Products: Market Size And Growth, By Type
- Products: Average Per Capita Consumption, By Type
- Products: Exports And Growth, By Type
- Products: Export Prices And Growth, By Type
- Production Volume And Growth
- Exports And Growth
- Export Prices And Growth
- Market Size And Growth
- Per Capita Consumption
- Imports And Growth
- Import Prices
- Production, In Physical Terms, 2012–2023
- Production, In Value Terms, 2012–2023
- Production, By Country, 2023
- Production, In Physical Terms, By Country, 2012–2023
- Imports, In Physical Terms, 2012–2023
- Imports, In Value Terms, 2012–2023
- Imports, In Physical Terms, By Country, 2023
- Imports, In Physical Terms, By Country, 2012–2023
- Imports, In Value Terms, By Country, 2012–2023
- Import Prices, By Country, 2012–2023
- Exports, In Physical Terms, 2012–2023
- Exports, In Value Terms, 2012–2023
- Exports, In Physical Terms, By Country, 2023
- Exports, In Physical Terms, By Country, 2012–2023
- Exports, In Value Terms, By Country, 2012–2023
- Export Prices, 2012–2023


