Germany - Colouring Matter Of Vegetable Or Animal Origin - Market Analysis, Forecast, Size, Trends And Insights
Get instant access to more than 2 million reports, dashboards, and datasets on the IndexBox Platform.
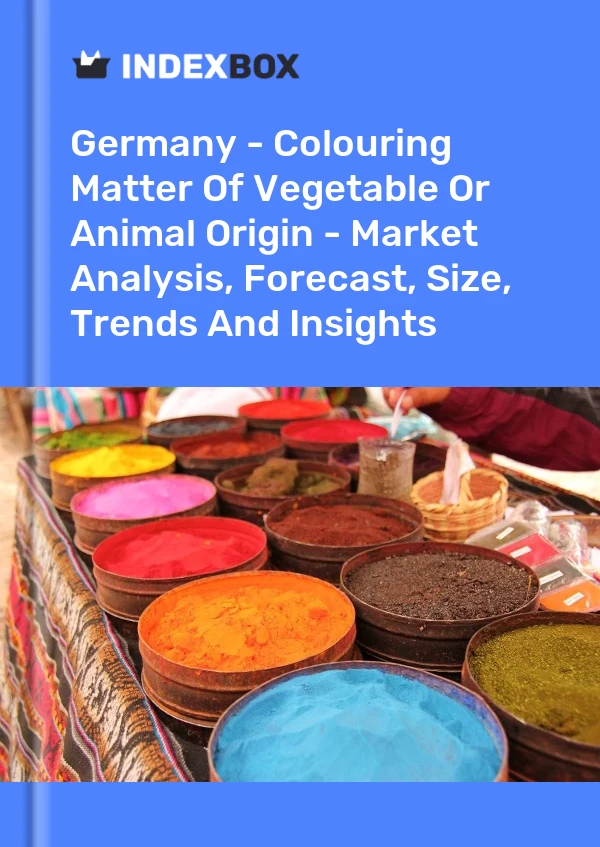
View PricingGermany's Market for Vegetable or Animal Colouring Matter Rose 13% to Reach $91M in 2018
IndexBox has just published a new report: 'Germany - Colouring Matter Of Vegetable Or Animal Origin - Market Analysis, Forecast, Size, Trends And Insights'. Here is a summary of the report's key findings.
The revenue of the market for colouring matter of vegetable or animal origin in Germany amounted to $91M in 2018, going up by 13% against the previous year. This figure reflects the total revenues of producers and importers (excluding logistics costs, retail marketing costs, and retailers' margins, which will be included in the final consumer price). The market value increased at an average annual rate of +2.8% from 2008 to 2018; however, the trend pattern remained relatively stable, with only minor fluctuations being recorded over the period under review. The growth pace was the most rapid in 2012 with an increase of 19% year-to-year. Over the period under review, the market for vegetable or animal colouring matter reached its peak figure level in 2018 and is likely to see steady growth in the near future.
Production in Germany
In 2018, the production of colouring matter of vegetable or animal origin in Germany stood at 9.7K tons, increasing by 37% against the previous year. Over the period under review, production of colouring matter of vegetable or animal origin continues to indicate a resilient increase. The pace of growth appeared the most rapid in 2012 when production volume increased by 48% year-to-year. Production of colouring matter of vegetable or animal origin peaked in 2018 and is expected to retain its growth in the immediate term.
In value terms, production of colouring matter of vegetable or animal origin amounted to $65M in 2018 estimated in export prices. In general, production of colouring matter of vegetable or animal origin continues to indicate a relatively flat trend pattern. The pace of growth was the most pronounced in 2014 when production volume increased by 12% year-to-year. In that year, production of colouring matter of vegetable or animal origin reached its peak level of $74M. From 2015 to 2018, production of colouring matter of vegetable or animal origin growth remained at a somewhat lower figure.
Exports from Germany
In 2018, approx. 4.3K tons of colouring matter of vegetable or animal origin were exported from Germany; picking up by 2.3% against the previous year. The total export volume increased at an average annual rate of +3.2% over the period from 2008 to 2018; the trend pattern remained consistent, with somewhat noticeable fluctuations over the period under review. The pace of growth was the most pronounced in 2010 when exports increased by 18% against the previous year. Exports peaked in 2018 and are expected to retain its growth in the immediate term.
In value terms, exports of colouring matter of vegetable or animal origin totaled $91M (IndexBox estimates) in 2018. The total export value increased at an average annual rate of +3.1% from 2008 to 2018; the trend pattern indicated some noticeable fluctuations being recorded over the period under review. The most prominent rate of growth was recorded in 2010 when exports increased by 43% year-to-year. Exports peaked at $109M in 2011; however, from 2012 to 2018, exports failed to regain their momentum.
Exports by Country
Ukraine (414 tons), the Netherlands (371 tons) and France (318 tons) were the main destinations of exports of colouring matter of vegetable or animal origin from Germany, with a combined 26% share of total exports.
From 2008 to 2018, the most notable rate of growth in terms of exports, amongst the main countries of destination, was attained by Ukraine, while the other leaders experienced more modest paces of growth.
In value terms, the largest markets for vegetable or animal colouring matter exported from Germany were the Netherlands ($8.6M), the UK ($8.4M) and France ($6.4M), with a combined 26% share of total exports. Hungary, Italy, Spain, Poland, Belgium, Israel, Turkey, Ukraine and Austria lagged somewhat behind, together comprising a further 39%.
Hungary experienced the highest growth rate of exports, among the main countries of destination over the last decade, while the other leaders experienced more modest paces of growth.
Export Prices by Country
In 2018, the average export price for colouring matter of vegetable or animal origin amounted to $21,162 per ton, growing by 7.1% against the previous year. Over the period under review, the export price for colouring matter of vegetable or animal origin, however, continues to indicate a relatively flat trend pattern. The growth pace was the most rapid in 2011 an increase of 30% y-o-y. In that year, the average export prices for colouring matter of vegetable or animal origin attained their peak level of $30,856 per ton. From 2012 to 2018, the growth in terms of the average export prices for colouring matter of vegetable or animal origin failed to regain its momentum.
There were significant differences in the average prices for the major foreign markets. In 2018, the country with the highest price was Hungary ($32,531 per ton), while the average price for exports to Ukraine ($7,105 per ton) was amongst the lowest.
From 2008 to 2018, the most notable rate of growth in terms of prices was recorded for supplies to Hungary, while the prices for the other major destinations experienced more modest paces of growth.
Imports into Germany
Imports of colouring matter of vegetable or animal origin into Germany totaled 5.5K tons in 2018, jumping by 7% against the previous year. The total import volume increased at an average annual rate of +4.0% from 2008 to 2018; however, the trend pattern indicated some noticeable fluctuations being recorded in certain years. The most prominent rate of growth was recorded in 2010 when imports increased by 17% against the previous year. Imports peaked in 2018 and are likely to continue its growth in the near future.
In value terms, imports of colouring matter of vegetable or animal origin stood at $107M (IndexBox estimates) in 2018. In general, the total imports indicated resilient growth from 2008 to 2018: its value increased at an average annual rate of +4.0% over the last decade. The trend pattern, however, indicated some noticeable fluctuations being recorded throughout the analyzed period. Based on 2018 figures, imports of colouring matter of vegetable or animal origin increased by +18.5% against 2015 indices. The most prominent rate of growth was recorded in 2010 when imports increased by 25% year-to-year. Imports peaked in 2018 and are likely to see steady growth in the near future.
Imports by Country
The Netherlands (1.3K tons), China (678 tons) and Italy (548 tons) were the main suppliers of imports of colouring matter of vegetable or animal origin to Germany, together comprising 46% of total imports. These countries were followed by the U.S., India, Peru, Ecuador, Denmark, Spain, Belgium, the UK and France, which together accounted for a further 44%.
From 2008 to 2018, the most notable rate of growth in terms of imports, amongst the main suppliers, was attained by Ecuador, while the other leaders experienced more modest paces of growth.
In value terms, the largest vegetable or animal colouring matter suppliers to Germany were China ($20M), the Netherlands ($19M) and Peru ($8.5M), together accounting for 44% of total imports.
In terms of the main suppliers, China experienced the highest growth rate of imports, over the last decade, while the other leaders experienced more modest paces of growth.
Import Prices by Country
In 2018, the average import price for colouring matter of vegetable or animal origin amounted to $19,424 per ton, reducing by -5.2% against the previous year. Over the period from 2008 to 2018, it increased at an average annual rate of +2.5%. The pace of growth was the most pronounced in 2011 when the average import price increased by 35% year-to-year. Over the period under review, the average import prices for colouring matter of vegetable or animal origin reached their peak figure at $25,499 per ton in 2012; however, from 2013 to 2018, import prices remained at a lower figure.
Prices varied noticeably by the country of origin; the country with the highest price was France ($30,870 per ton), while the price for Ecuador ($4,082 per ton) was amongst the lowest.
From 2008 to 2018, the most notable rate of growth in terms of prices was attained by Peru, while the prices for the other major suppliers experienced more modest paces of growth.
This report provides an in-depth analysis of the market for vegetable or animal colouring matter in Germany. Within it, you will discover the latest data on market trends and opportunities by country, consumption, production and price developments, as well as the global trade (imports and exports). The forecast exhibits the market prospects through 2030.
Product coverage:
- Prodcom 20122270 - Colouring matter of vegetable or animal origin and preparations based thereon (including dyeing extracts) (excluding animal black)
Country coverage:
- Germany
Data coverage:
- Market volume and value
- Per Capita consumption
- Forecast of the market dynamics in the medium term
- Trade (exports and imports) in Germany
- Export and import prices
- Market trends, drivers and restraints
- Key market players and their profiles
Reasons to buy this report:
- Take advantage of the latest data
- Find deeper insights into current market developments
- Discover vital success factors affecting the market
This report is designed for manufacturers, distributors, importers, and wholesalers, as well as for investors, consultants and advisors.
In this report, you can find information that helps you to make informed decisions on the following issues:
- How to diversify your business and benefit from new market opportunities
- How to load your idle production capacity
- How to boost your sales on overseas markets
- How to increase your profit margins
- How to make your supply chain more sustainable
- How to reduce your production and supply chain costs
- How to outsource production to other countries
- How to prepare your business for global expansion
While doing this research, we combine the accumulated expertise of our analysts and the capabilities of artificial intelligence. The AI-based platform, developed by our data scientists, constitutes the key working tool for business analysts, empowering them to discover deep insights and ideas from the marketing data.
-
1. INTRODUCTION
Making Data-Driven Decisions to Grow Your Business
- REPORT DESCRIPTION
- RESEARCH METHODOLOGY AND AI PLATFORM
- DATA-DRIVEN DECISIONS FOR YOUR BUSINESS
- GLOSSARY AND SPECIFIC TERMS
-
2. EXECUTIVE SUMMARY
A Quick Overview of Market Performance
- KEY FINDINGS
- MARKET TRENDS This Chapter is Available Only for the Professional Edition PRO
-
3. MARKET OVERVIEW
Understanding the Current State of The Market and Its Prospects
- MARKET SIZE
- MARKET STRUCTURE
- TRADE BALANCE
- PER CAPITA CONSUMPTION
- MARKET FORECAST TO 2030
-
4. MOST PROMISING PRODUCT
Finding New Products to Diversify Your Business
This Chapter is Available Only for the Professional Edition PRO- TOP PRODUCTS TO DIVERSIFY YOUR BUSINESS
- BEST-SELLING PRODUCTS
- MOST CONSUMED PRODUCT
- MOST TRADED PRODUCT
- MOST PROFITABLE PRODUCT FOR EXPORT
-
5. MOST PROMISING SUPPLYING COUNTRIES
Choosing the Best Countries to Establish Your Sustainable Supply Chain
This Chapter is Available Only for the Professional Edition PRO- TOP COUNTRIES TO SOURCE YOUR PRODUCT
- TOP PRODUCING COUNTRIES
- TOP EXPORTING COUNTRIES
- LOW-COST EXPORTING COUNTRIES
-
6. MOST PROMISING OVERSEAS MARKETS
Choosing the Best Countries to Boost Your Exports
This Chapter is Available Only for the Professional Edition PRO- TOP OVERSEAS MARKETS FOR EXPORTING YOUR PRODUCT
- TOP CONSUMING MARKETS
- UNSATURATED MARKETS
- TOP IMPORTING MARKETS
- MOST PROFITABLE MARKETS
7. PRODUCTION
The Latest Trends and Insights into The Industry
- PRODUCTION VOLUME AND VALUE
8. IMPORTS
The Largest Import Supplying Countries
- IMPORTS FROM 2012–2023
- IMPORTS BY COUNTRY
- IMPORT PRICES BY COUNTRY
9. EXPORTS
The Largest Destinations for Exports
- EXPORTS FROM 2012–2023
- EXPORTS BY COUNTRY
- EXPORT PRICES BY COUNTRY
-
10. PROFILES OF MAJOR PRODUCERS
The Largest Producers on The Market and Their Profiles
This Chapter is Available Only for the Professional Edition PRO -
LIST OF TABLES
- Key Findings In 2023
- Market Volume, In Physical Terms, 2012–2023
- Market Value, 2012–2023
- Per Capita Consumption In 2012-2023
- Imports, In Physical Terms, By Country, 2012–2023
- Imports, In Value Terms, By Country, 2012–2023
- Import Prices, By Country Of Origin, 2012–2023
- Exports, In Physical Terms, By Country, 2012–2023
- Exports, In Value Terms, By Country, 2012–2023
- Export Prices, By Country Of Destination, 2012–2023
-
LIST OF FIGURES
- Market Volume, In Physical Terms, 2012–2023
- Market Value, 2012–2023
- Market Structure – Domestic Supply vs. Imports, In Physical Terms, 2012-2023
- Market Structure – Domestic Supply vs. Imports, In Value Terms, 2012-2023
- Trade Balance, In Physical Terms, 2012-2023
- Trade Balance, In Value Terms, 2012-2023
- Per Capita Consumption, 2012-2023
- Market Volume Forecast to 2030
- Market Value Forecast to 2030
- Products: Market Size And Growth, By Type
- Products: Average Per Capita Consumption, By Type
- Products: Exports And Growth, By Type
- Products: Export Prices And Growth, By Type
- Production Volume And Growth
- Exports And Growth
- Export Prices And Growth
- Market Size And Growth
- Per Capita Consumption
- Imports And Growth
- Import Prices
- Production, In Physical Terms, 2012–2023
- Production, In Value Terms, 2012–2023
- Imports, In Physical Terms, 2012–2023
- Imports, In Value Terms, 2012–2023
- Imports, In Physical Terms, By Country, 2023
- Imports, In Physical Terms, By Country, 2012–2023
- Imports, In Value Terms, By Country, 2012–2023
- Import Prices, By Country Of Origin, 2012–2023
- Exports, In Physical Terms, 2012–2023
- Exports, In Value Terms, 2012–2023
- Exports, In Physical Terms, By Country, 2023
- Exports, In Physical Terms, By Country, 2012–2023
- Exports, In Value Terms, By Country, 2012–2023
- Export Prices, By Country Of Destination, 2012–2023


