
U.S. Storage Battery Market. Analysis And Forecast to 2030
Get instant access to more than 2 million reports, dashboards, and datasets on the IndexBox Platform.
View PricingNovember 2023 Witnesses $2.7B Surge in Imports of Storage Batteries in United States
U.S. Storage Battery Imports
In November 2023, purchases abroad of storage batteries was finally on the rise to reach 76M units after two months of decline. Overall, imports, however, recorded a noticeable contraction. The growth pace was the most rapid in March 2023 when imports increased by 13% month-to-month. Over the period under review, imports attained the maximum at 114M units in November 2022; however, from December 2022 to November 2023, imports stood at a somewhat lower figure.
In value terms, storage battery imports expanded notably to $2.7B (IndexBox estimates) in November 2023. The total import value increased at an average monthly rate of +1.0% from November 2022 to November 2023; however, the trend pattern remained relatively stable, with only minor fluctuations being observed throughout the analyzed period. The pace of growth appeared the most rapid in January 2023 when imports increased by 28% against the previous month. As a result, imports attained the peak of $2.9B. From February 2023 to November 2023, the growth of imports failed to regain momentum.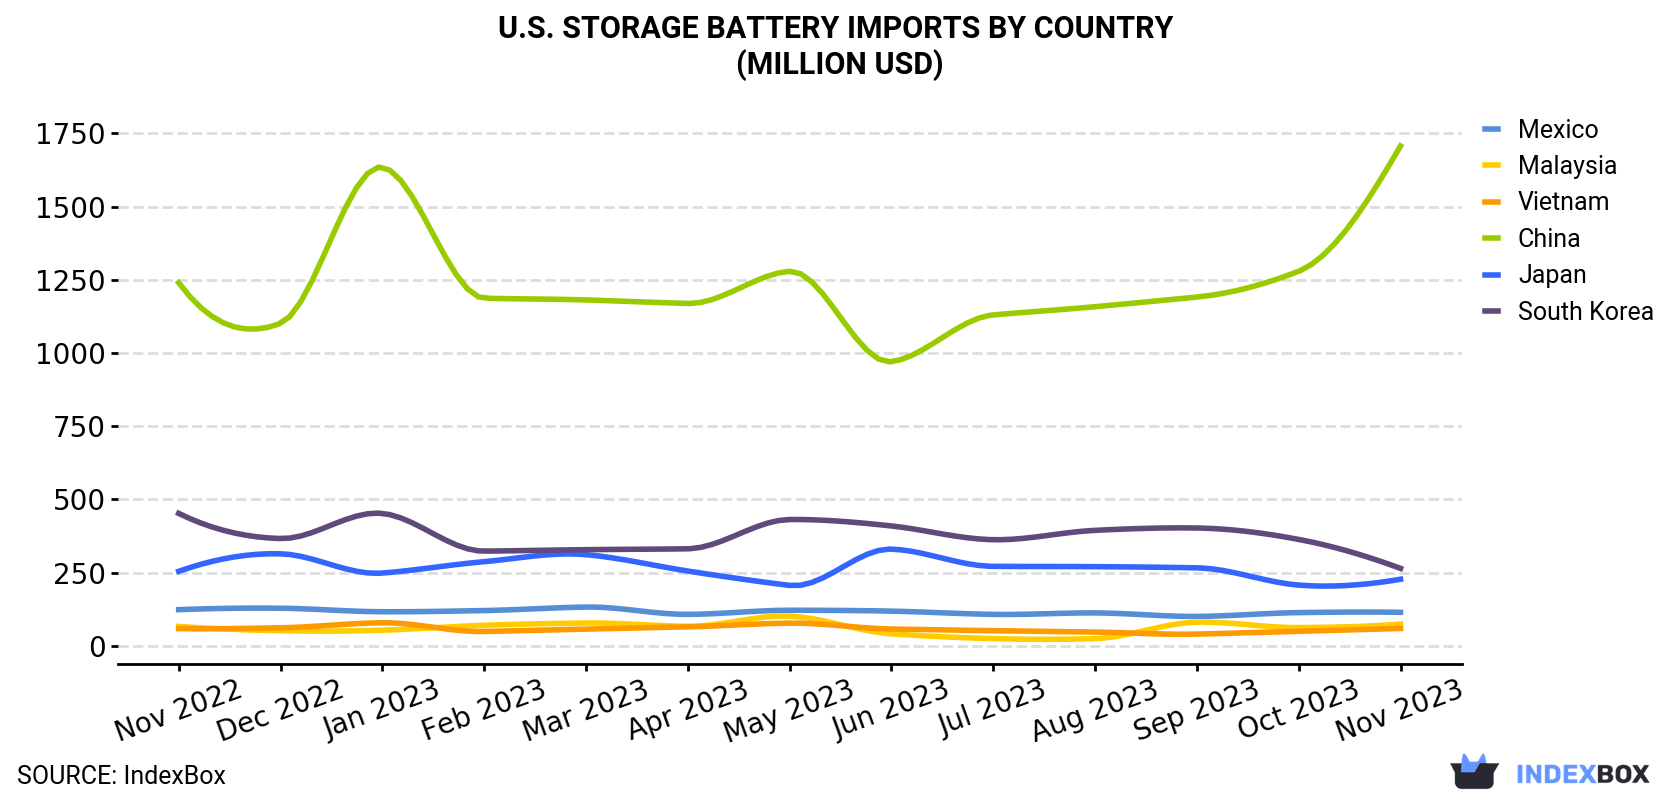
| COUNTRY | Import Value of Storage Battery in U.S. (million USD) | ||||||||||||
|---|---|---|---|---|---|---|---|---|---|---|---|---|---|
| Nov 2022 | Dec 2022 | Jan 2023 | Feb 2023 | Mar 2023 | Apr 2023 | May 2023 | Jun 2023 | Jul 2023 | Aug 2023 | Sep 2023 | Oct 2023 | Nov 2023 | |
| China | 1,240 | 1,101 | 1,635 | 1,187 | 1,181 | 1,169 | 1,279 | 970 | 1,130 | 1,158 | 1,191 | 1,279 | 1,707 |
| South Korea | 452 | 366 | 452 | 323 | 328 | 331 | 431 | 409 | 362 | 394 | 402 | 363 | 264 |
| Japan | 254 | 314 | 248 | 287 | 311 | 255 | 206 | 330 | 271 | 270 | 266 | 207 | 227 |
| Mexico | 123 | 128 | 116 | 120 | 132 | 107 | 121 | 118 | 107 | 112 | 100 | 113 | 114 |
| Malaysia | 65.8 | 51.2 | 52.9 | 69.7 | 77.4 | 66.2 | 101 | 40.5 | 24.1 | 24.2 | 80.4 | 61.9 | 73.8 |
| Vietnam | 58.2 | 61.2 | 78.4 | 48.5 | 56.6 | 64.5 | 77.1 | 56.9 | 51.4 | 46.5 | 39.7 | 49.2 | 58.9 |
| Others | 212 | 240 | 306 | 315 | 307 | 299 | 297 | 271 | 309 | 282 | 269 | 294 | 264 |
| Total | 2,405 | 2,262 | 2,889 | 2,350 | 2,392 | 2,292 | 2,513 | 2,196 | 2,255 | 2,287 | 2,349 | 2,368 | 2,710 |
Imports by Country
In November 2023, China (33M units) constituted the largest supplier of storage battery to the United States, with a 43% share of total imports. Moreover, storage battery imports from China exceeded the figures recorded by the second-largest supplier, South Korea (16M units), twofold. The third position in this ranking was taken by Japan (11M units), with a 15% share.
From November 2022 to November 2023, the average monthly growth rate of volume from China was relatively modest. The remaining supplying countries recorded the following average monthly rates of imports growth: South Korea (-6.2% per month) and Japan (-7.6% per month).
In value terms, China ($1.7B) constituted the largest supplier of storage battery to the United States, comprising 63% of total imports. The second position in the ranking was held by South Korea ($264M), with a 9.7% share of total imports. It was followed by Japan, with an 8.4% share.
From November 2022 to November 2023, the average monthly growth rate of value from China totaled +2.7%. The remaining supplying countries recorded the following average monthly rates of imports growth: South Korea (-4.4% per month) and Japan (-0.9% per month).
Import Prices by Country
In November 2023, the storage battery price stood at $35.5 per unit (CIF, US), with an increase of 8.7% against the previous month. Overall, import price indicated a pronounced expansion from November 2022 to November 2023: its price increased at an average monthly rate of +4.4% over the last twelve-month period. The trend pattern, however, indicated some noticeable fluctuations being recorded throughout the analyzed period. Based on November 2023 figures, storage battery import price increased by +79.3% against June 2023 indices. The most prominent rate of growth was recorded in September 2023 when the average import price increased by 32% against the previous month. The import price peaked in November 2023.
Prices varied noticeably by the country of origin: the country with the highest price was China ($51.4 per unit), while the price for Malaysia ($12.0 per unit) was amongst the lowest.
From November 2022 to November 2023, the most notable rate of growth in terms of prices was attained by Japan (+7.2%), while the prices for the other major suppliers experienced more modest paces of growth.
This report provides an in-depth analysis of the storage battery market in the U.S.. Within it, you will discover the latest data on market trends and opportunities by country, consumption, production and price developments, as well as the global trade (imports and exports). The forecast exhibits the market prospects through 2030.
Product coverage:
- NAICS 335911 - Storage battery manufacturing
Companies mentioned:
- Exide Technologies
- Enersys
- Ultralife Corporation
- B456 Systems
- Polypore International
- Eaglepicher Technologies
- Crown Battery Manufacturing Company
- Trojan Battery Company
- Energizer Battery Manufacturing
- Robert Bosch Battery Systems
- Tfi
- Bren-Tronics
- Valence Technology
- Enerdel
- Saft America
- Hrg Group
- Enersys Energy Products
- Superior Battery Manufacturing Company
- Ener1
- Mathews Associates
- Xalt Energy
- Panasonic Energy Corporation of America, Greatbatch
- Arotech Corporation
- Duracell International
- Enersys Delaware
- A & A Manufacturing Company
- Duracell
- Energizer Battery
- Ascent Batteries International
Country coverage:
- United States
Data coverage:
- Market volume and value
- Per Capita consumption
- Forecast of the market dynamics in the medium term
- Trade (exports and imports) in the U.S.
- Export and import prices
- Market trends, drivers and restraints
- Key market players and their profiles
Reasons to buy this report:
- Take advantage of the latest data
- Find deeper insights into current market developments
- Discover vital success factors affecting the market
This report is designed for manufacturers, distributors, importers, and wholesalers, as well as for investors, consultants and advisors.
In this report, you can find information that helps you to make informed decisions on the following issues:
- How to diversify your business and benefit from new market opportunities
- How to load your idle production capacity
- How to boost your sales on overseas markets
- How to increase your profit margins
- How to make your supply chain more sustainable
- How to reduce your production and supply chain costs
- How to outsource production to other countries
- How to prepare your business for global expansion
While doing this research, we combine the accumulated expertise of our analysts and the capabilities of artificial intelligence. The AI-based platform, developed by our data scientists, constitutes the key working tool for business analysts, empowering them to discover deep insights and ideas from the marketing data.
-
1. INTRODUCTION
Making Data-Driven Decisions to Grow Your Business
- REPORT DESCRIPTION
- RESEARCH METHODOLOGY AND AI PLATFORM
- DATA-DRIVEN DECISIONS FOR YOUR BUSINESS
- GLOSSARY AND SPECIFIC TERMS
-
2. EXECUTIVE SUMMARY
A Quick Overview of Market Performance
- KEY FINDINGS
- MARKET TRENDS This Chapter is Available Only for the Professional Edition PRO
-
3. MARKET OVERVIEW
Understanding the Current State of The Market and Its Prospects
- MARKET SIZE
- MARKET STRUCTURE
- TRADE BALANCE
- PER CAPITA CONSUMPTION
- MARKET FORECAST TO 2030
-
4. MOST PROMISING PRODUCT
Finding New Products to Diversify Your Business
This Chapter is Available Only for the Professional Edition PRO- TOP PRODUCTS TO DIVERSIFY YOUR BUSINESS
- BEST-SELLING PRODUCTS
- MOST CONSUMED PRODUCT
- MOST TRADED PRODUCT
- MOST PROFITABLE PRODUCT FOR EXPORT
-
5. MOST PROMISING SUPPLYING COUNTRIES
Choosing the Best Countries to Establish Your Sustainable Supply Chain
This Chapter is Available Only for the Professional Edition PRO- TOP COUNTRIES TO SOURCE YOUR PRODUCT
- TOP PRODUCING COUNTRIES
- TOP EXPORTING COUNTRIES
- LOW-COST EXPORTING COUNTRIES
-
6. MOST PROMISING OVERSEAS MARKETS
Choosing the Best Countries to Boost Your Exports
This Chapter is Available Only for the Professional Edition PRO- TOP OVERSEAS MARKETS FOR EXPORTING YOUR PRODUCT
- TOP CONSUMING MARKETS
- UNSATURATED MARKETS
- TOP IMPORTING MARKETS
- MOST PROFITABLE MARKETS
7. PRODUCTION
The Latest Trends and Insights into The Industry
- PRODUCTION VOLUME AND VALUE
8. IMPORTS
The Largest Import Supplying Countries
- IMPORTS FROM 2012–2023
- IMPORTS BY COUNTRY
- IMPORT PRICES BY COUNTRY
9. EXPORTS
The Largest Destinations for Exports
- EXPORTS FROM 2012–2023
- EXPORTS BY COUNTRY
- EXPORT PRICES BY COUNTRY
-
10. PROFILES OF MAJOR PRODUCERS
The Largest Producers on The Market and Their Profiles
This Chapter is Available Only for the Professional Edition PRO -
LIST OF TABLES
- Key Findings In 2023
- Market Volume, In Physical Terms, 2012–2023
- Market Value, 2012–2023
- Per Capita Consumption In 2012-2023
- Imports, In Physical Terms, By Country, 2012–2023
- Imports, In Value Terms, By Country, 2012–2023
- Import Prices, By Country Of Origin, 2012–2023
- Exports, In Physical Terms, By Country, 2012–2023
- Exports, In Value Terms, By Country, 2012–2023
- Export Prices, By Country Of Destination, 2012–2023
-
LIST OF FIGURES
- Market Volume, In Physical Terms, 2012–2023
- Market Value, 2012–2023
- Market Structure – Domestic Supply vs. Imports, In Physical Terms, 2012-2023
- Market Structure – Domestic Supply vs. Imports, In Value Terms, 2012-2023
- Trade Balance, In Physical Terms, 2012-2023
- Trade Balance, In Value Terms, 2012-2023
- Per Capita Consumption, 2012-2023
- Market Volume Forecast to 2030
- Market Value Forecast to 2030
- Products: Market Size And Growth, By Type
- Products: Average Per Capita Consumption, By Type
- Products: Exports And Growth, By Type
- Products: Export Prices And Growth, By Type
- Production Volume And Growth
- Exports And Growth
- Export Prices And Growth
- Market Size And Growth
- Per Capita Consumption
- Imports And Growth
- Import Prices
- Production, In Physical Terms, 2012–2023
- Production, In Value Terms, 2012–2023
- Imports, In Physical Terms, 2012–2023
- Imports, In Value Terms, 2012–2023
- Imports, In Physical Terms, By Country, 2023
- Imports, In Physical Terms, By Country, 2012–2023
- Imports, In Value Terms, By Country, 2012–2023
- Import Prices, By Country Of Origin, 2012–2023
- Exports, In Physical Terms, 2012–2023
- Exports, In Value Terms, 2012–2023
- Exports, In Physical Terms, By Country, 2023
- Exports, In Physical Terms, By Country, 2012–2023
- Exports, In Value Terms, By Country, 2012–2023
- Export Prices, By Country Of Destination, 2012–2023


